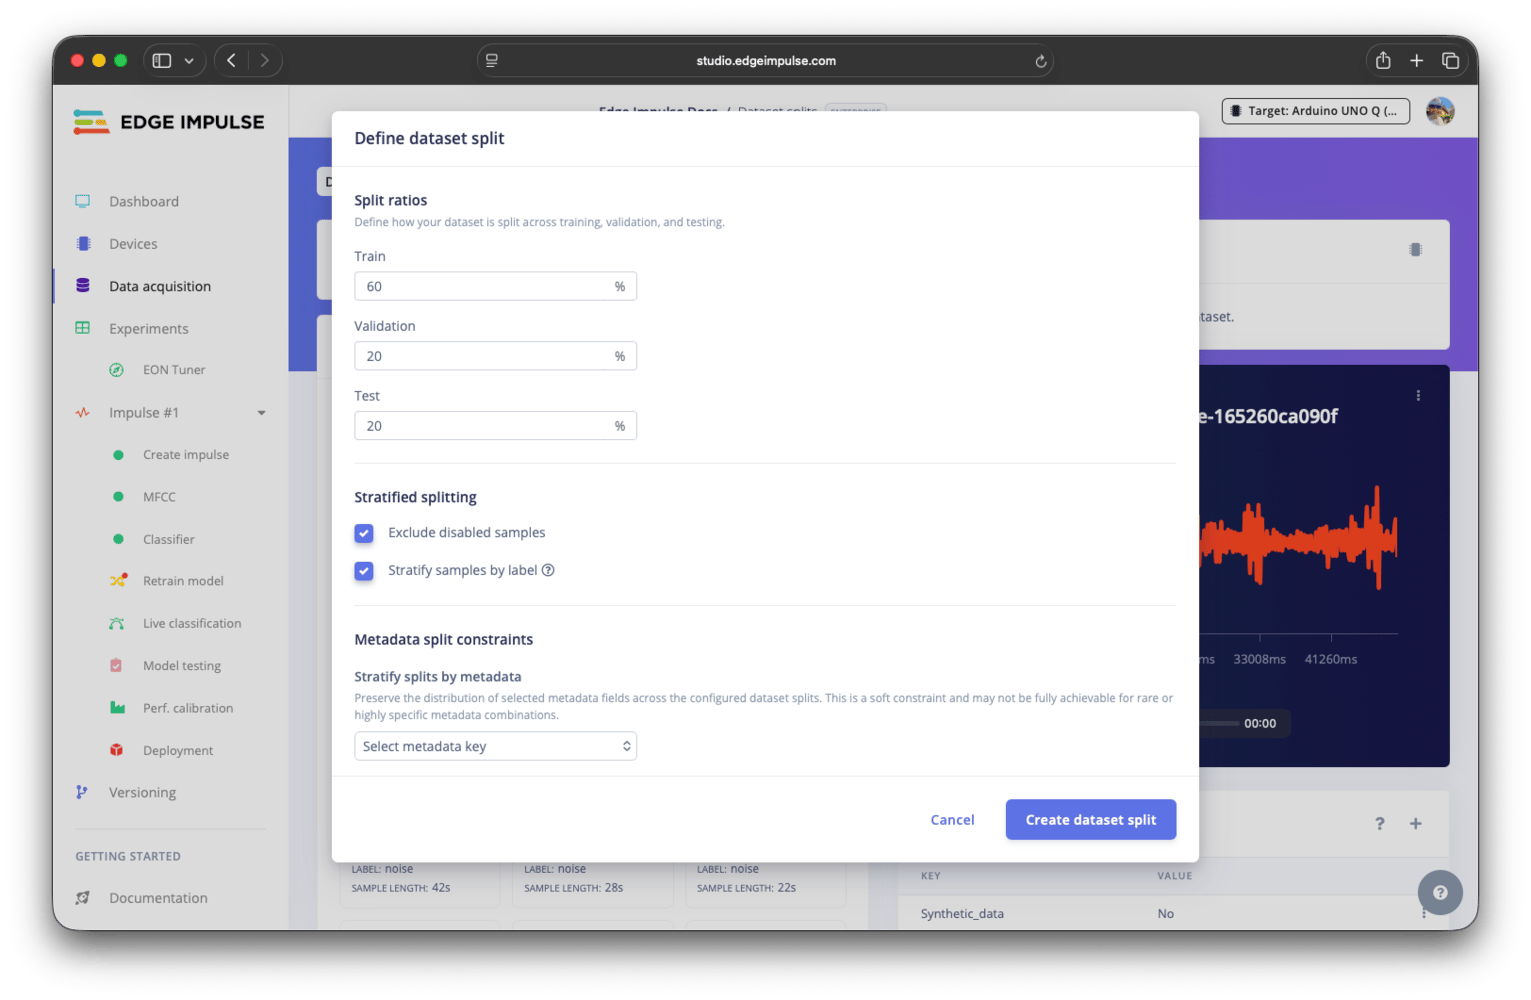
Define dataset split modal
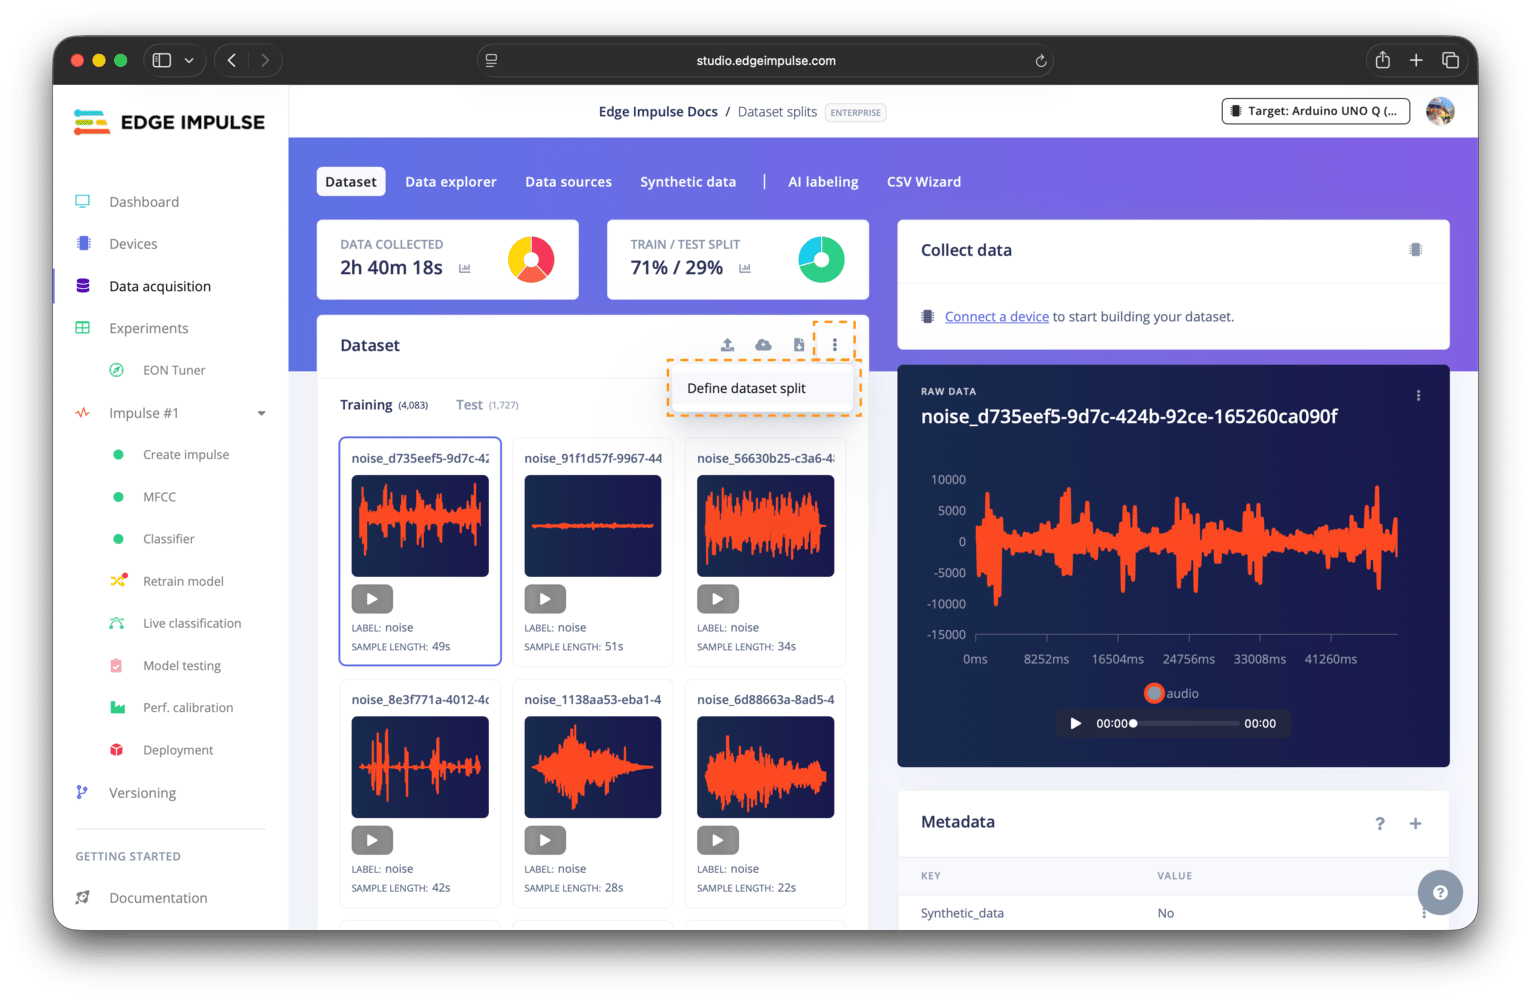
Define dataset split menu item
Split ratios
Validation set only available when explicit validation set setting is enabledThe validation set option is only available when the explicit validation set advanced setting is enabled. If this setting is disabled, no separate validation set option will be shown.
Stratified splitting
Stratified splitting attempts to preserve the label distribution across splits. Each split will contain similar proportions of each label, as much as possible. This is useful when labels are imbalanced and you want each dataset split to reflect the overall distribution. Disabled samples can optionally be excluded. Stratification is best-effort and may not be achievable for labels with few data samples.Metadata split constraints
Metadata-based constraints give you more control over how samples are distributed between splits. These operate alongside label stratification and may interact with it. There are two types of constraints: stratify by metadata (a soft constraint) and group by metadata (a hard constraint).Stratify splits by metadata
Stratifying the splits by metadata attempts to preserve the distribution of selected metadata keys across splits, similar to label stratification. For example, if you stratify by adevice_type key, each split will aim to contain a similar proportion of samples from each device value.
This applies in addition to label stratification and is a best-effort only; it may not hold for highly specific combinations of labels and metadata.
Group samples by metadata
Grouping by metadata ensures that all samples sharing the same metadata value for a specific key are placed in the same split. For example, keeping all samples from a single subject, device, or session together. This is commonly used to prevent data leakage. This is a hard constraint. Entire groups are assigned together, even if this causes imbalance or overrides stratification behaviour.Data preview
Click thePreview dataset split button to simulate the split before applying it. This helps you validate that your constraints produce the expected outcomes.
There are three graph views available, each with a corresponding table: overall, assignment, and stratification.
Overall view
The overall view shows the final distribution of samples across splits. It is the simplest summary of the result, helps confirm that the splits roughly match the intended ratios, and that no split is unexpectedly small or empty.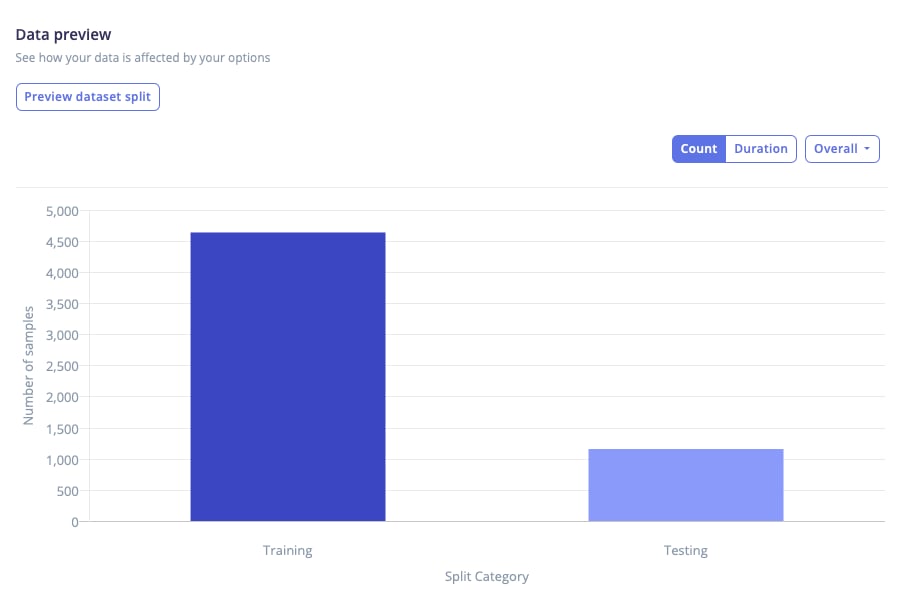
Data preview - overall view graph
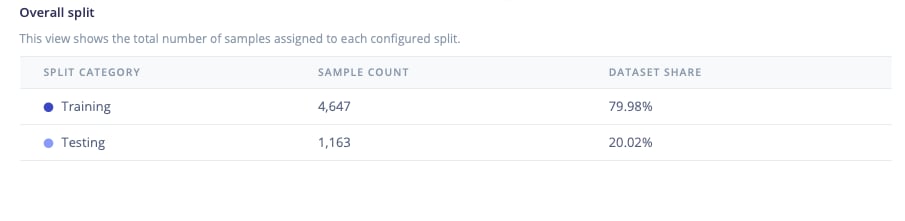
Data preview - overall view table
Assignment view
The assignment view shows how samples are grouped into buckets and assigned to splits. A bucket represents the unit of assignment. When stratifying by metadata, buckets contain the values of the selected targets, for examplehey_arduino|device_a|session_2.
When grouping is enabled, buckets correspond to those grouping constraints. Because grouped buckets must stay together, they appear as 100% assigned to a single split.
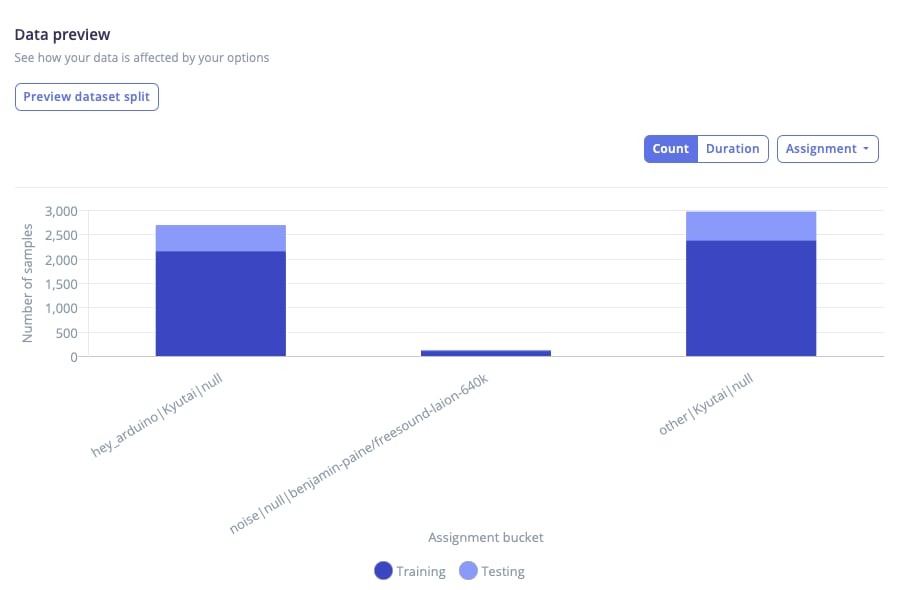
Data preview - assignment view graph
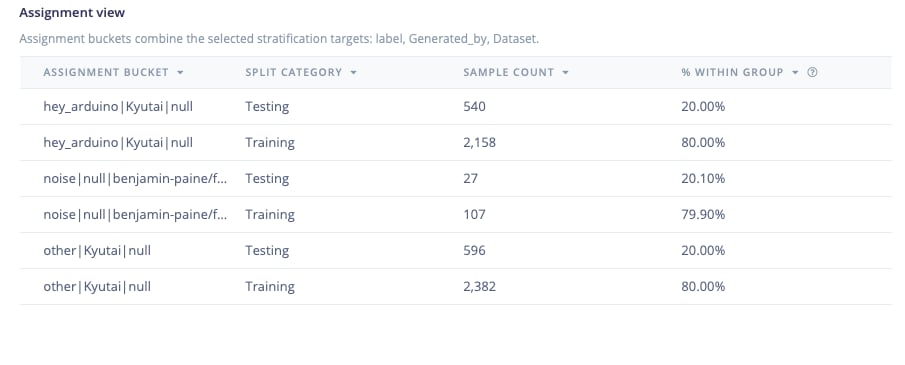
Data preview - assignment view table
Stratification view
Only available when stratification is enabledThe stratification view is only available when stratification by label or metadata is enabled. If stratification is disabled, this view will not appear in the dropdown selector for the different graph views.
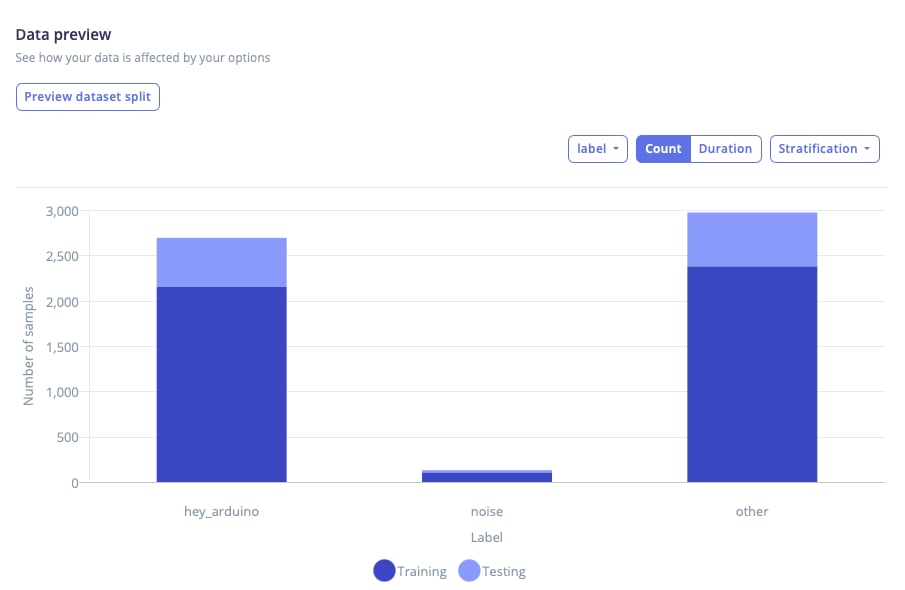
Data preview - stratification view graph
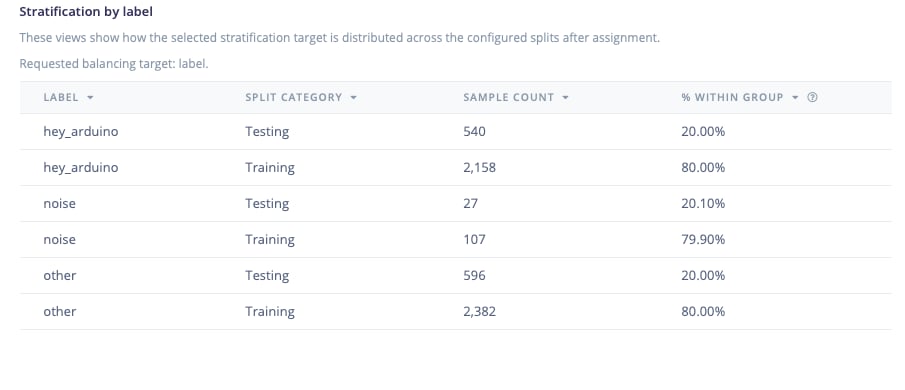
Data preview - stratification view table
Create dataset split
ClickCreate dataset split to apply the configuration. This immediately reassigns samples between splits, enforcing grouping constraints and applying stratification where possible.