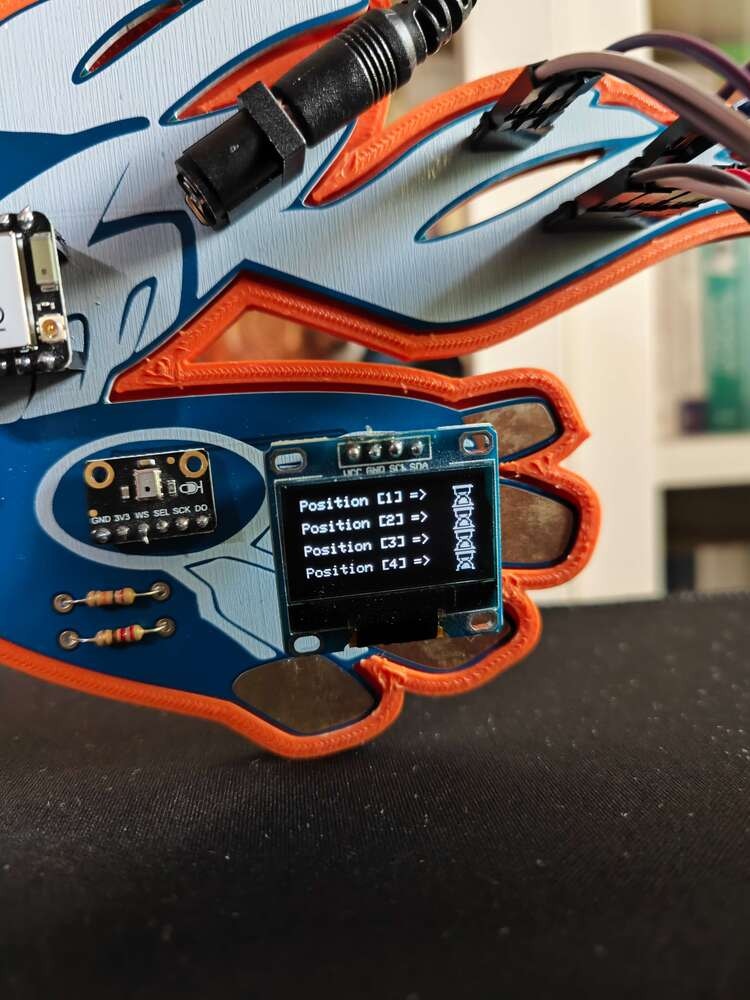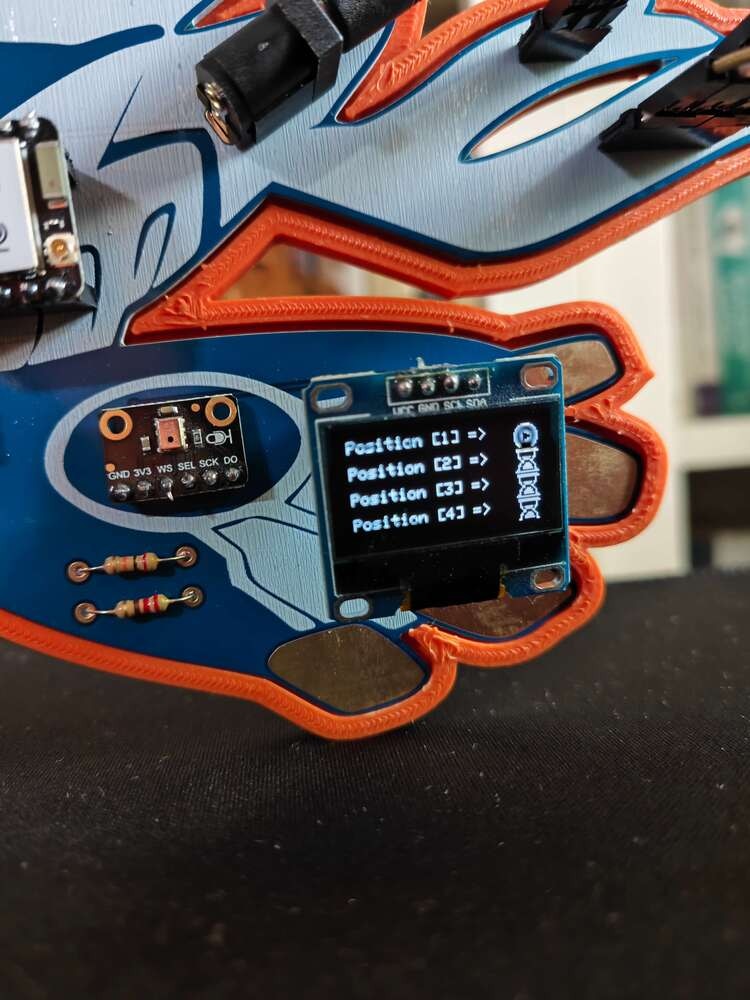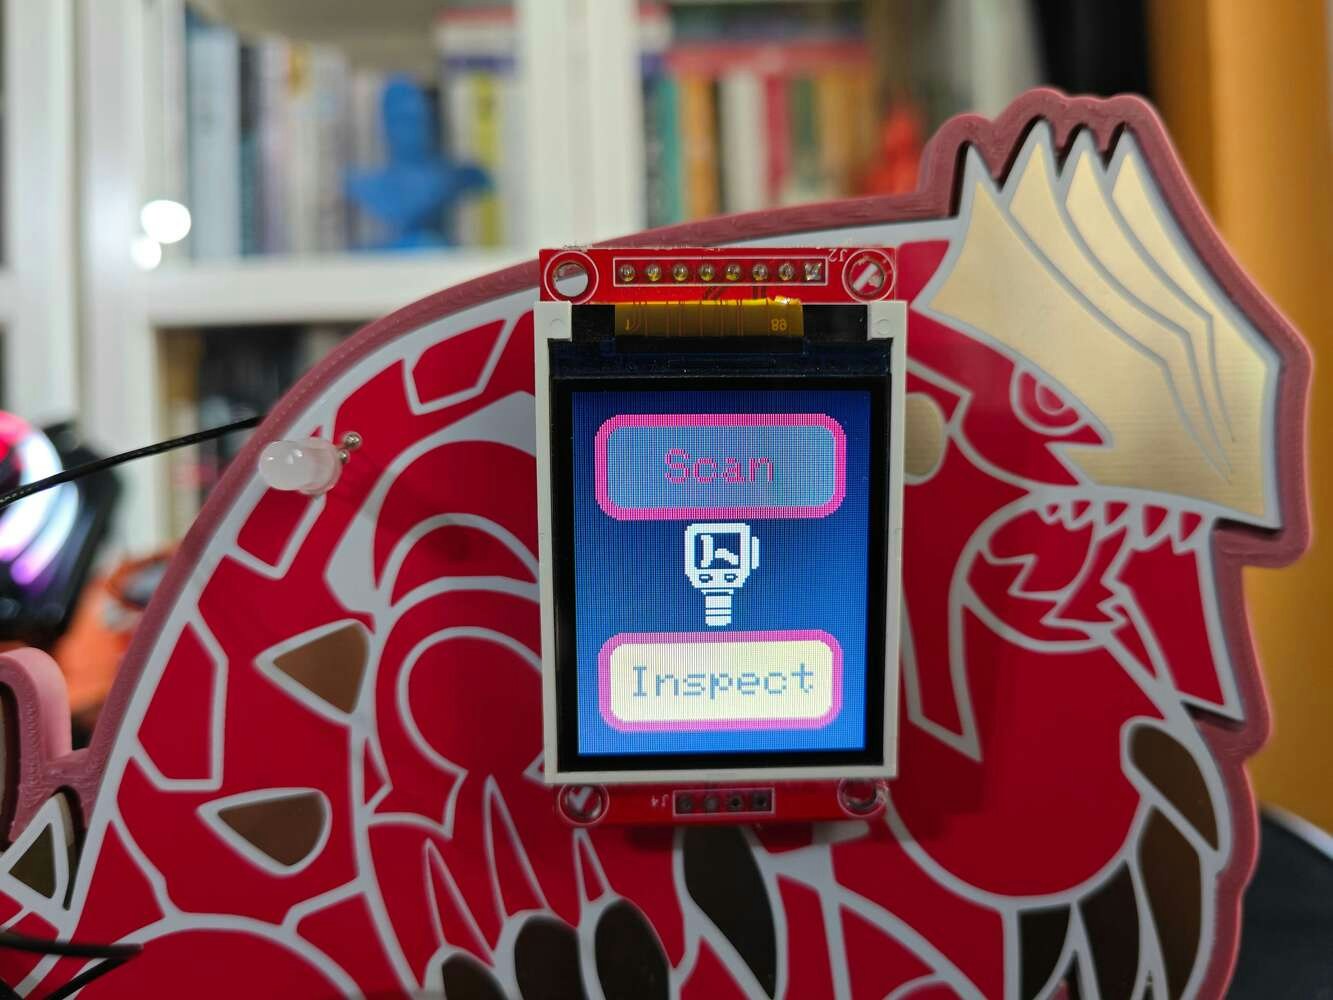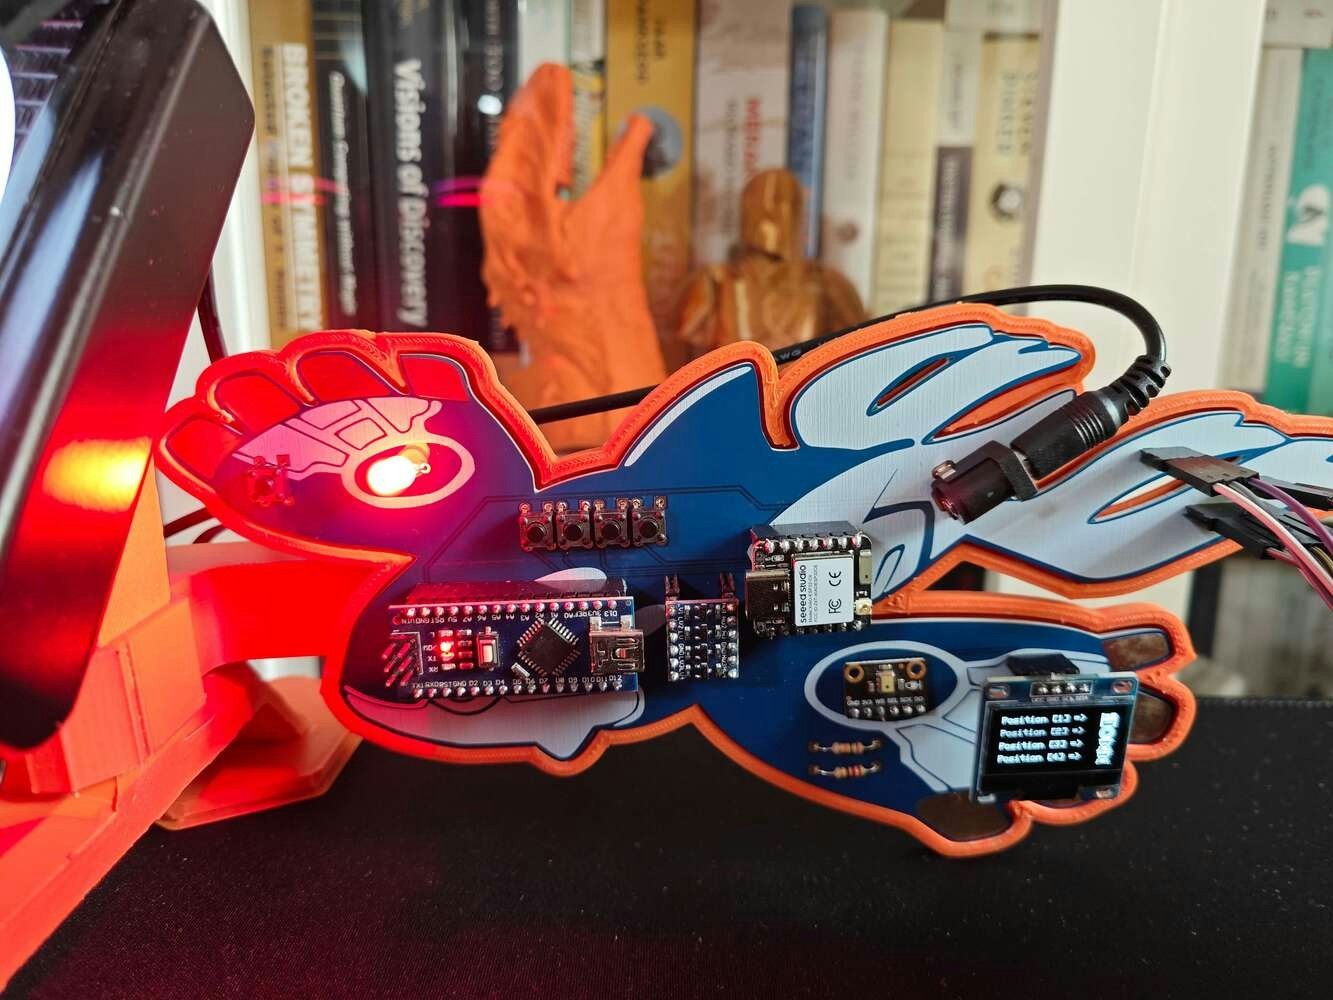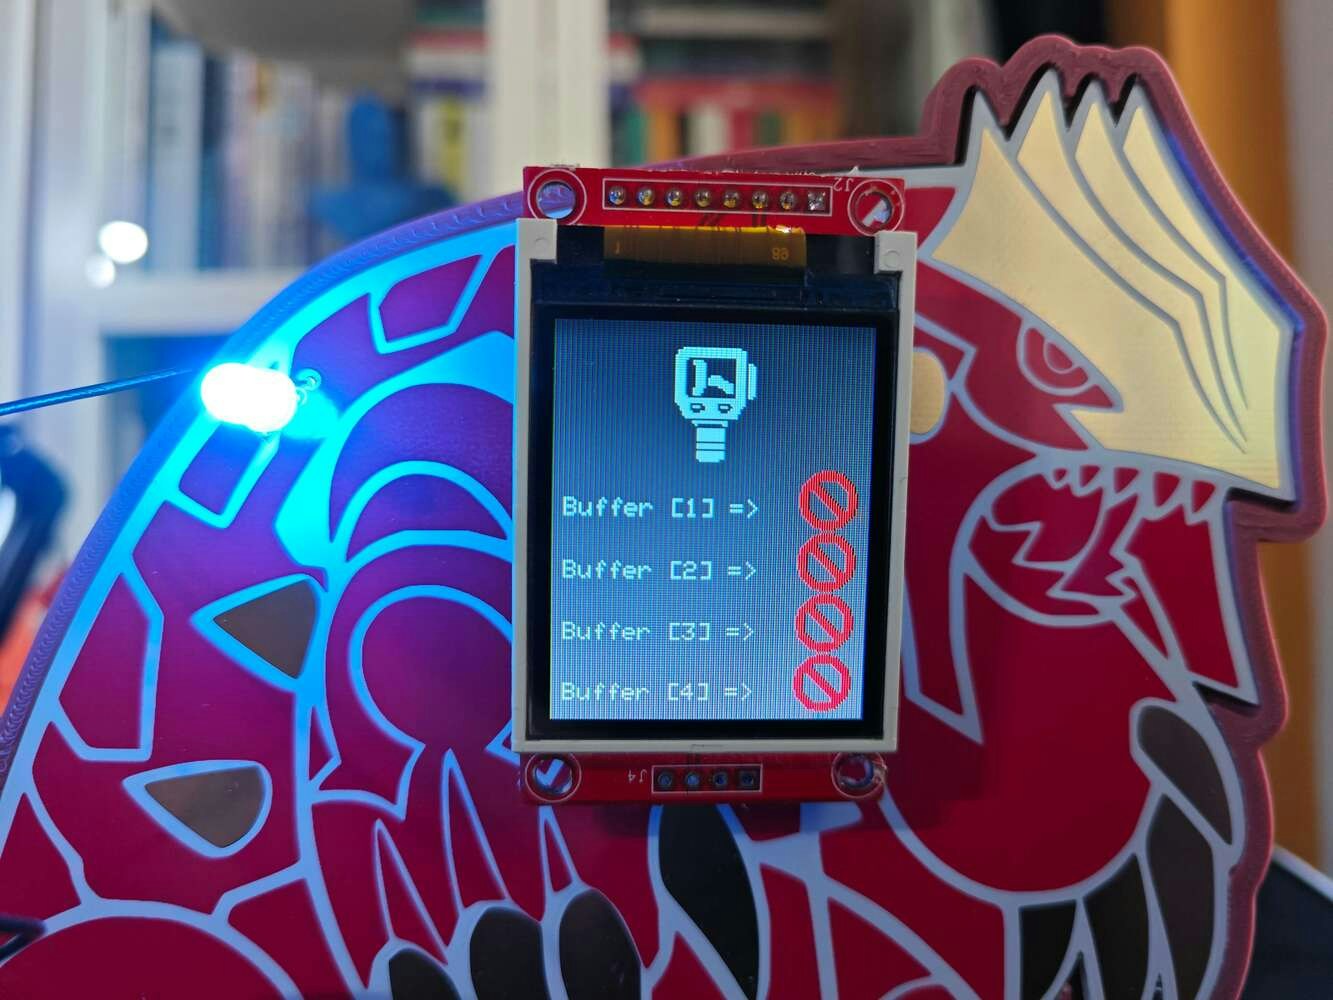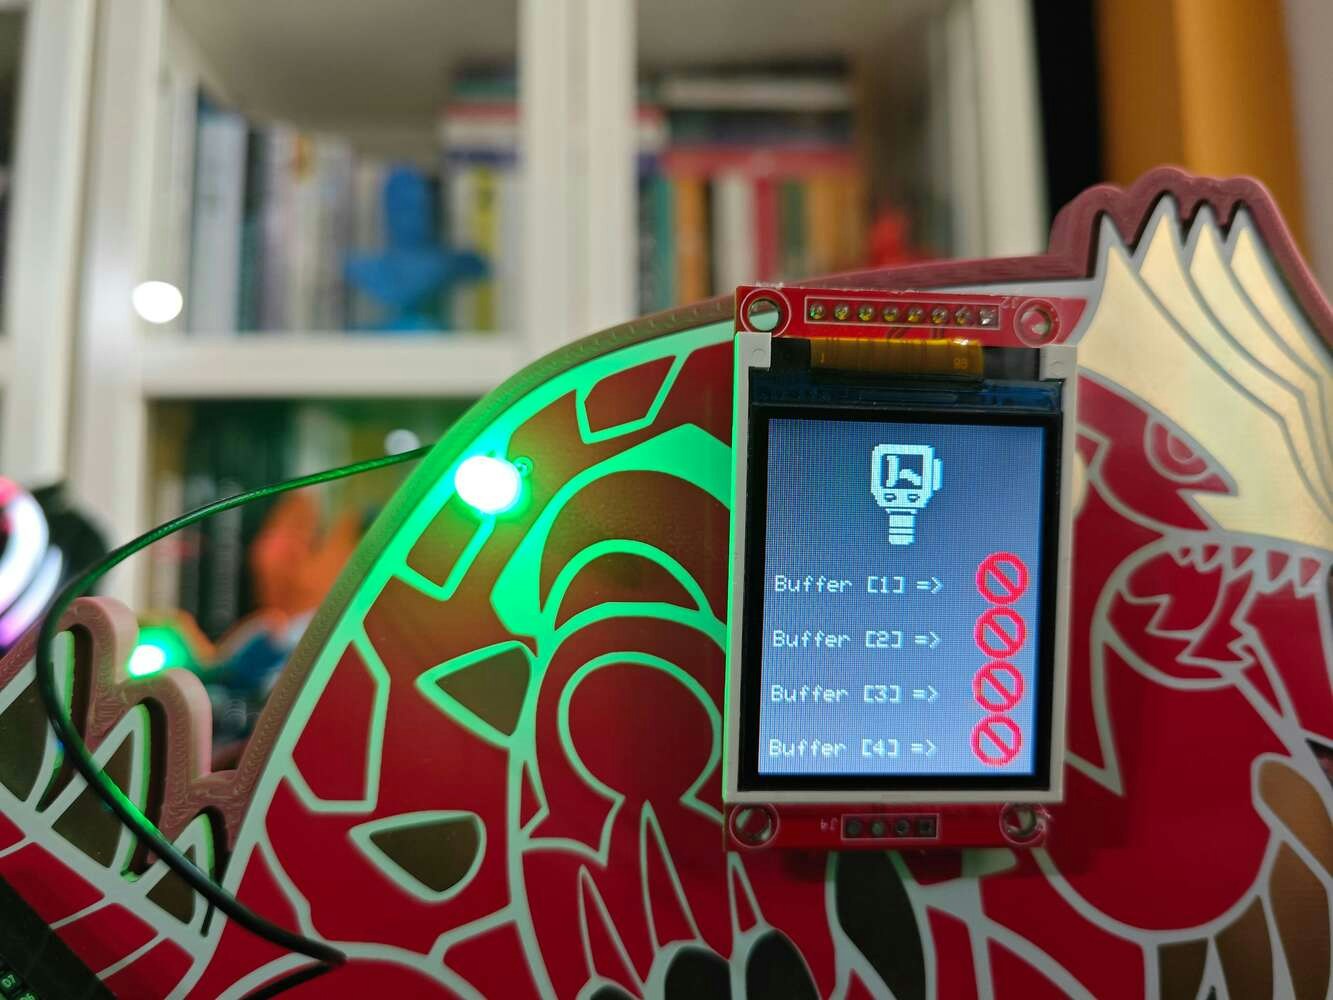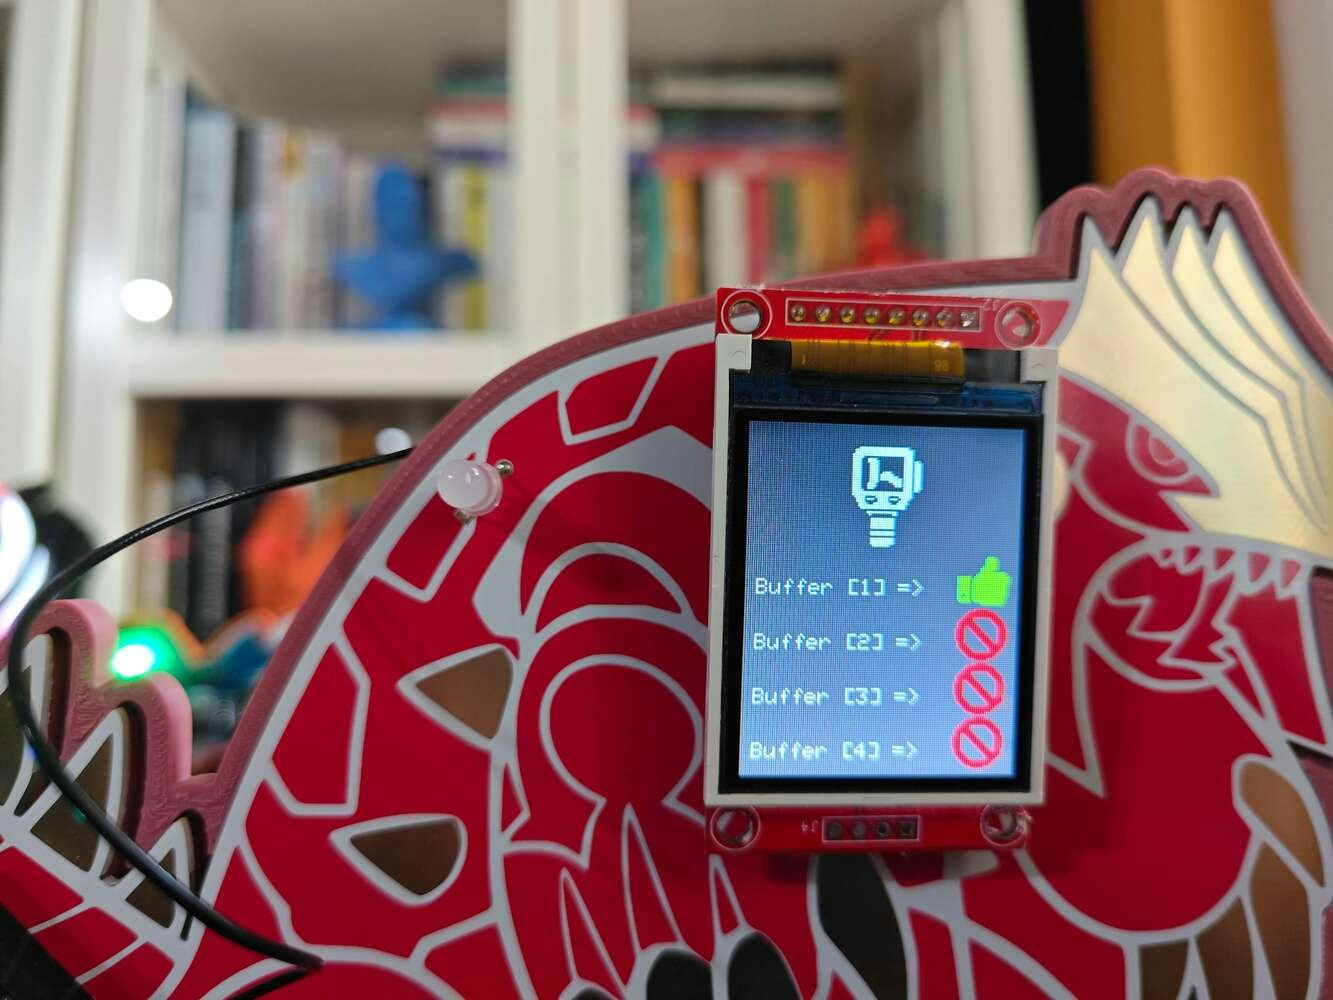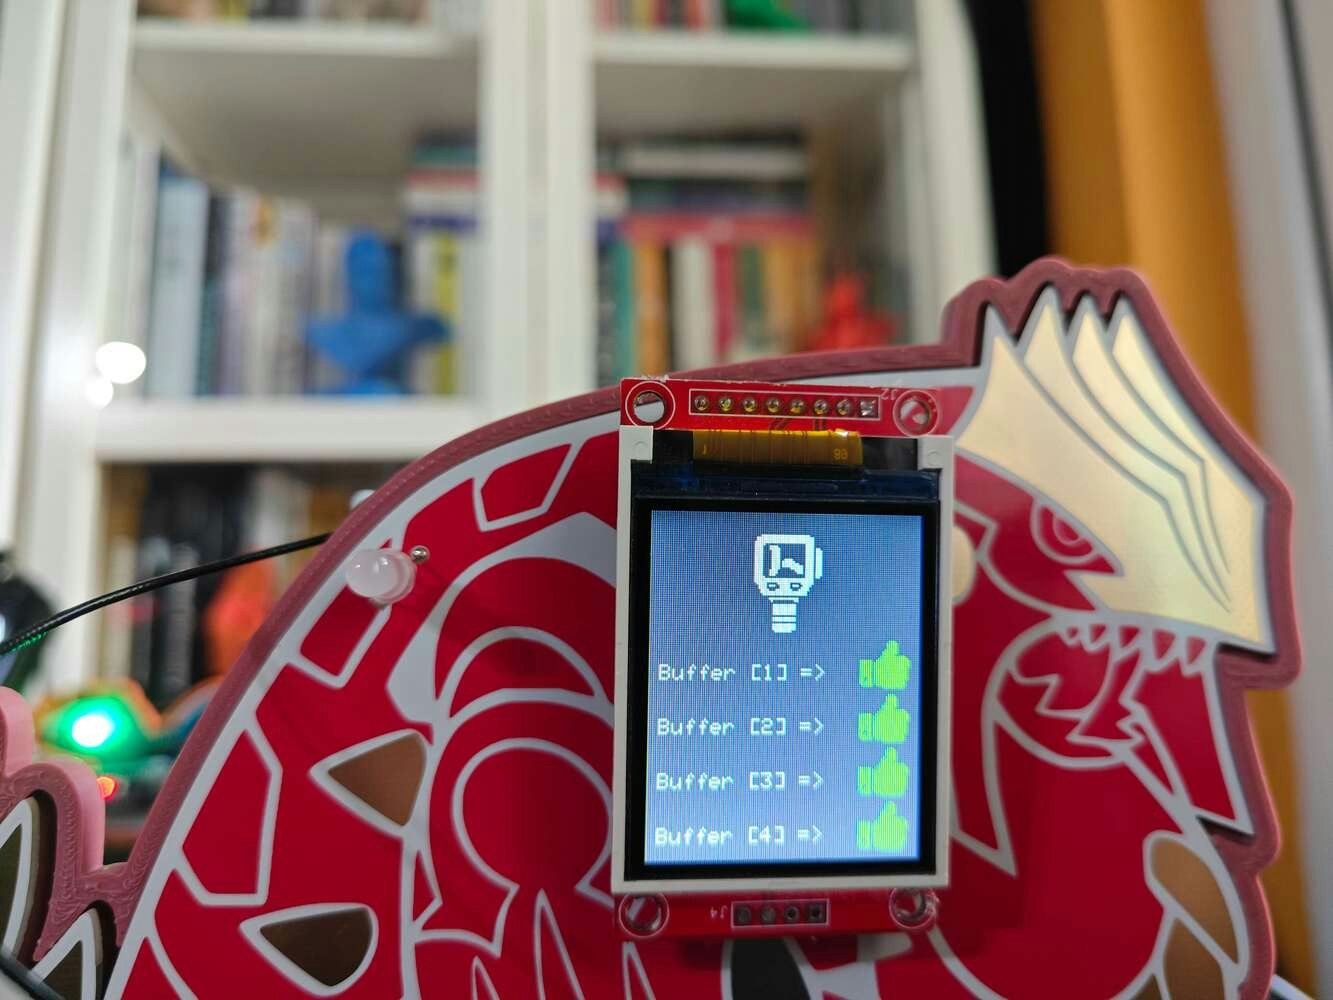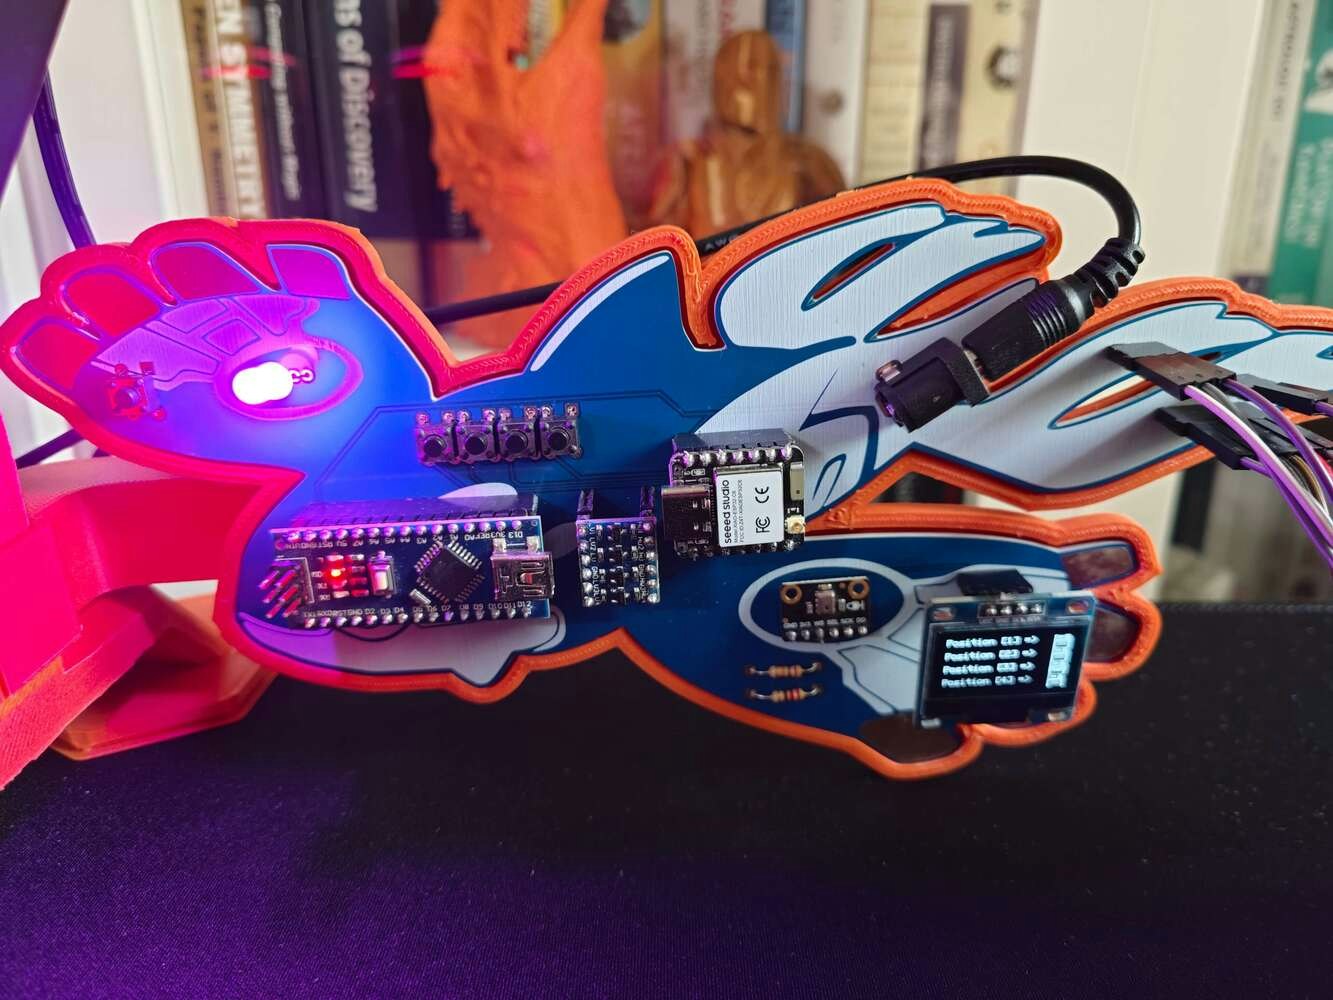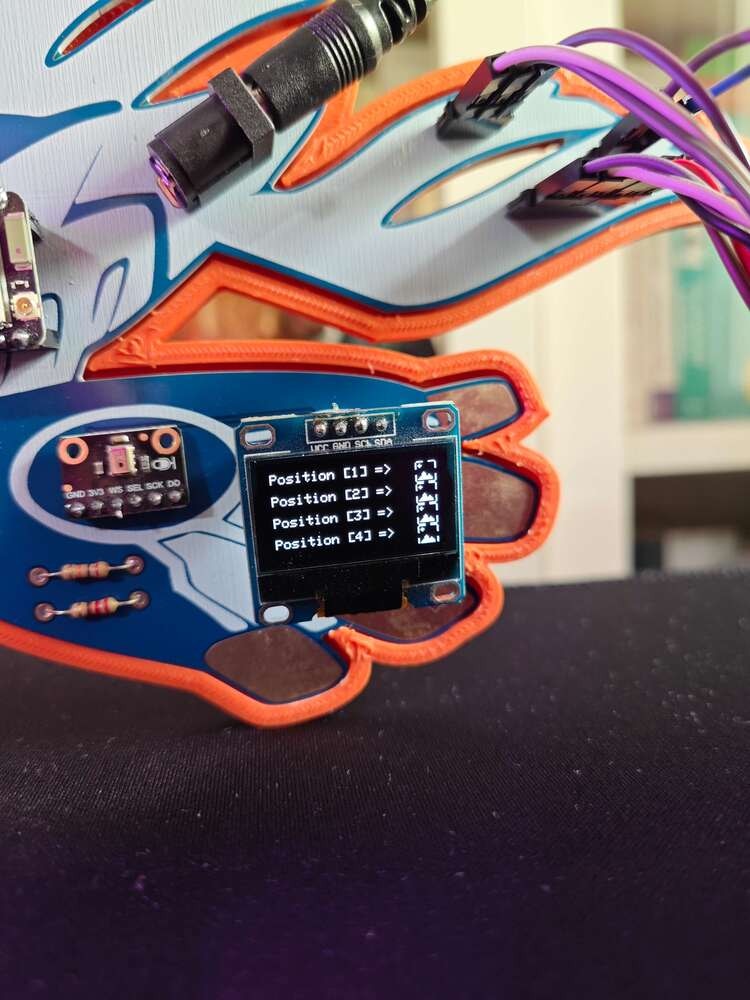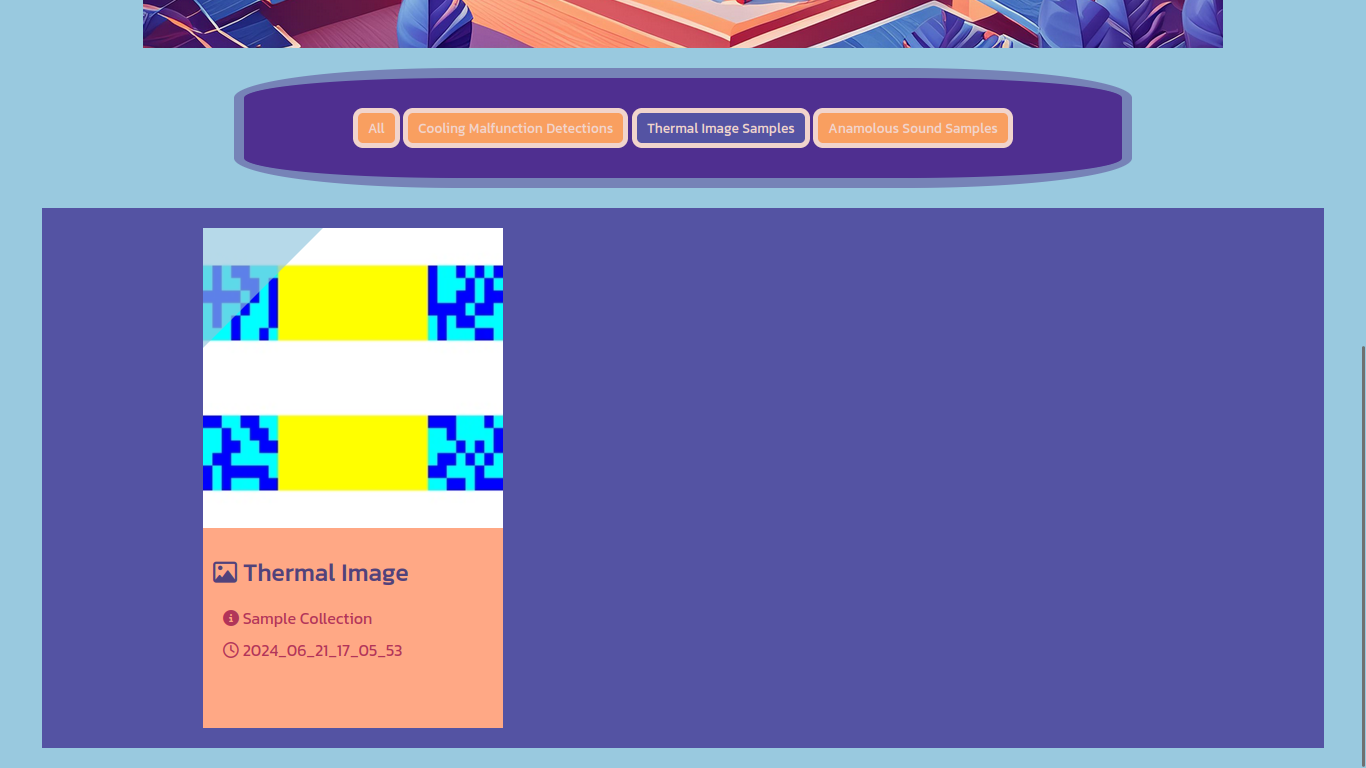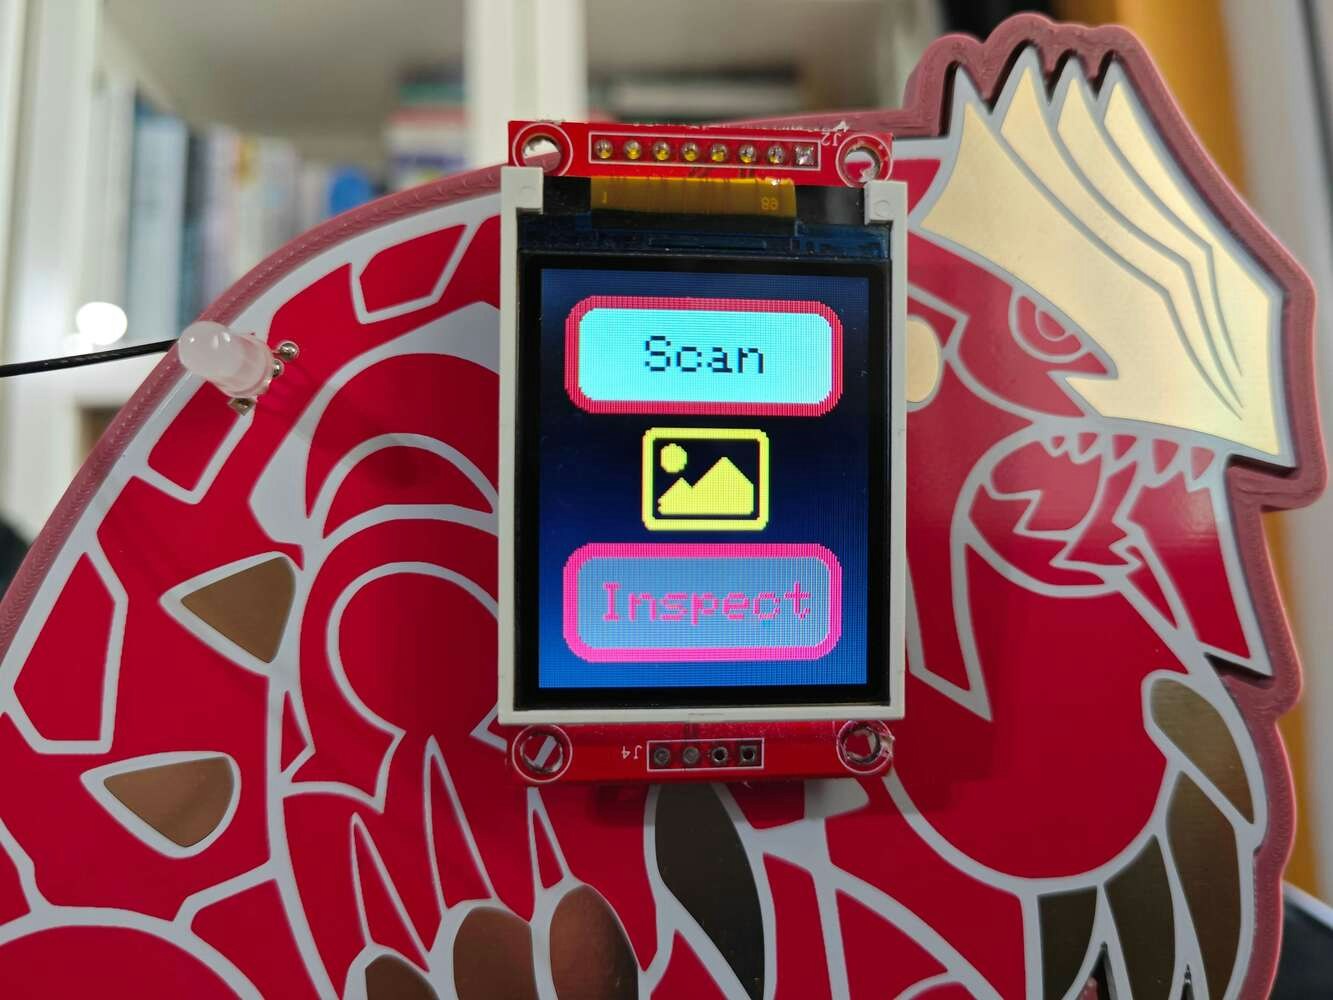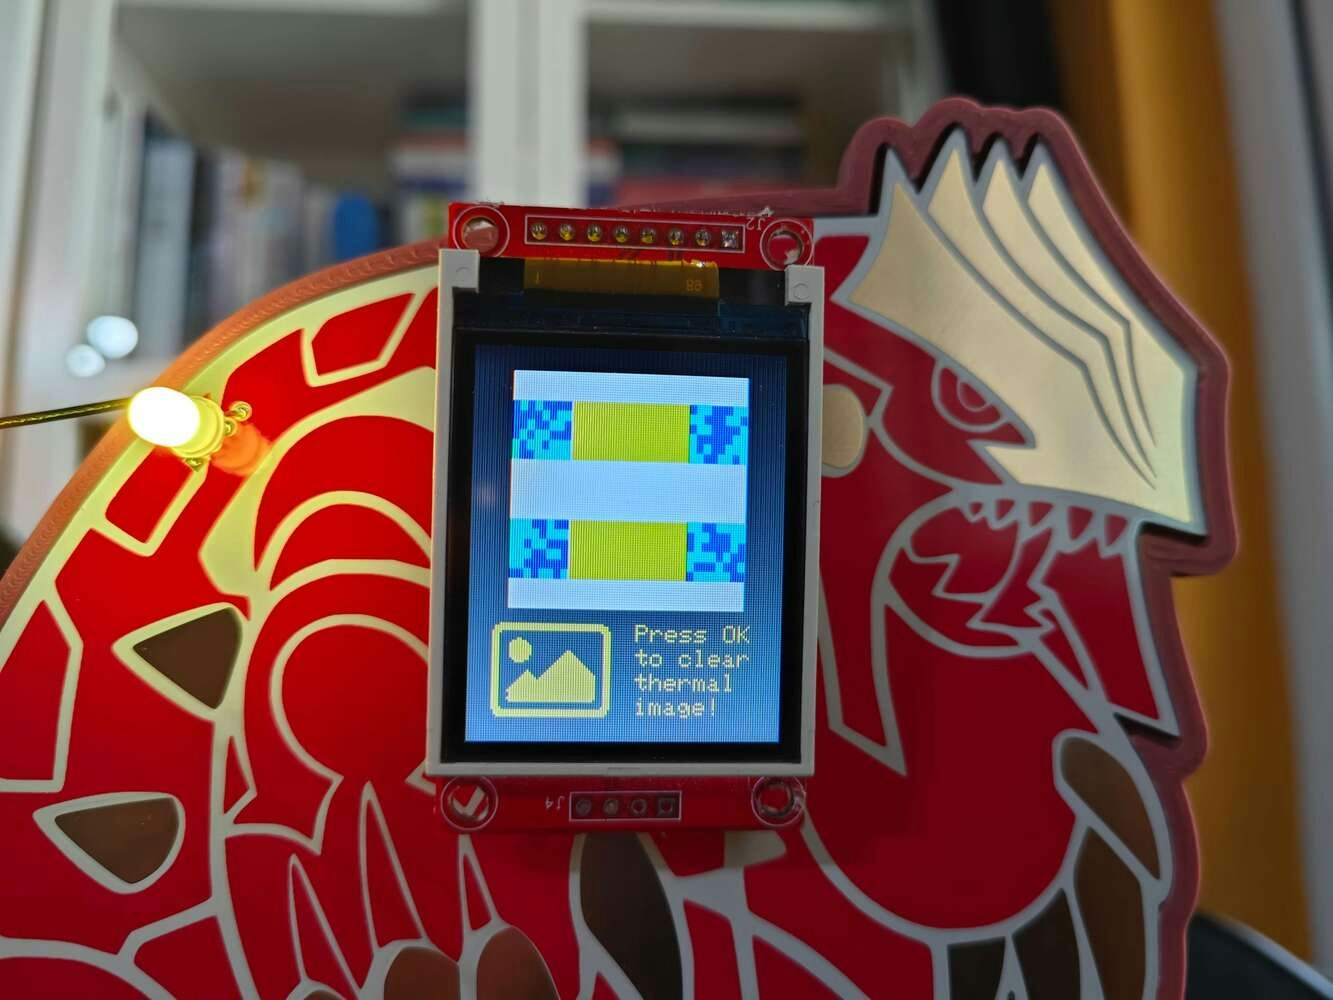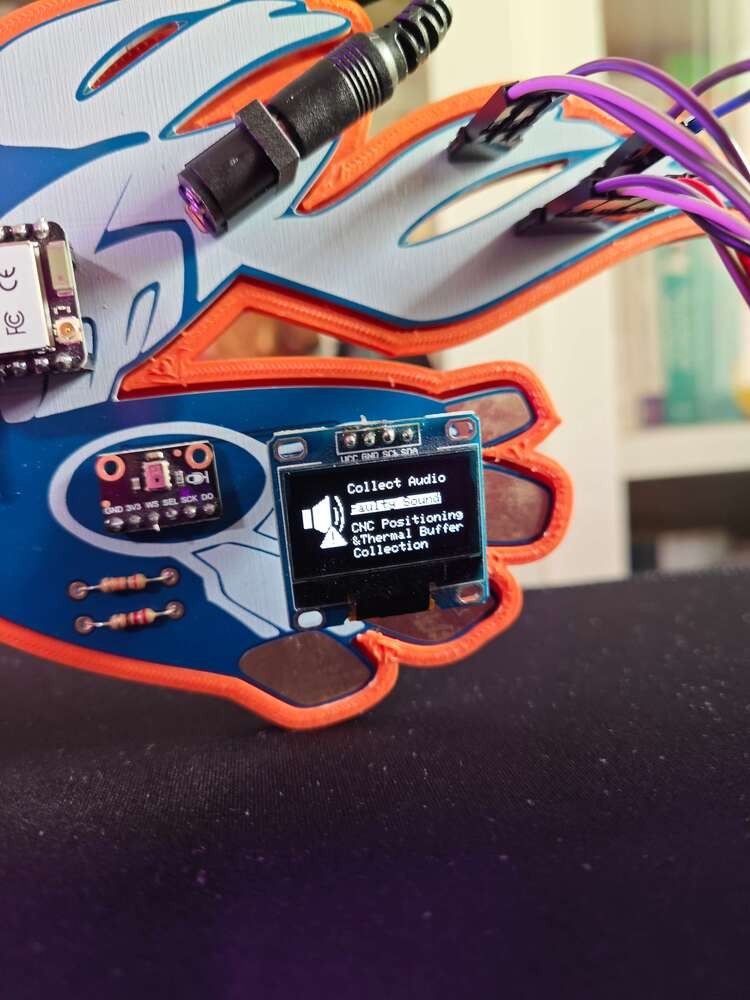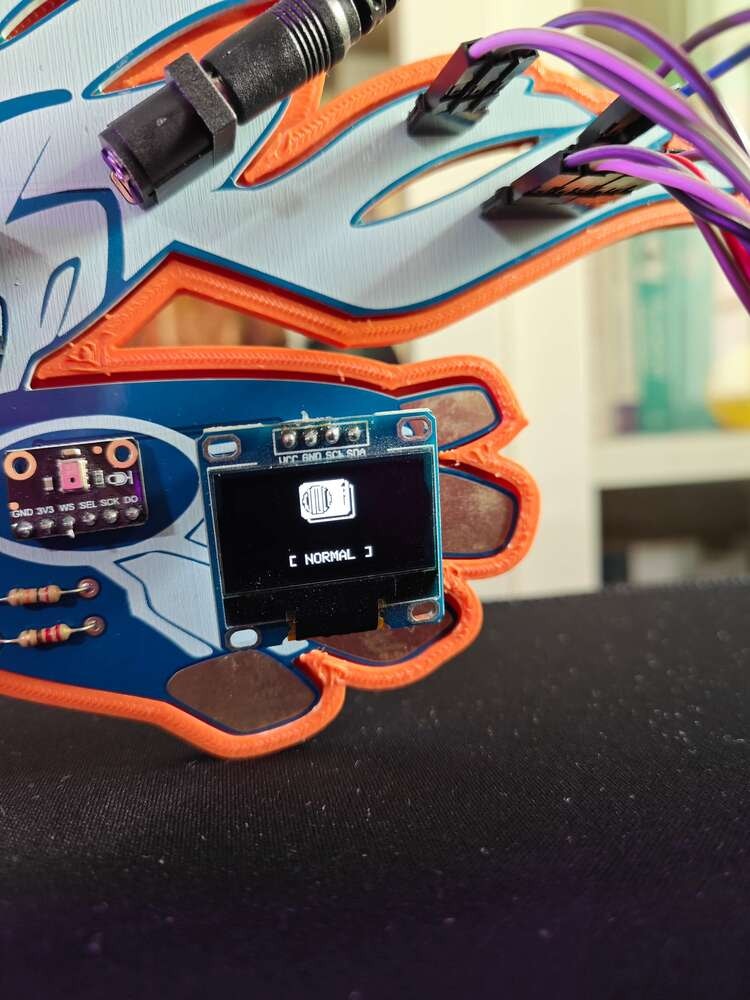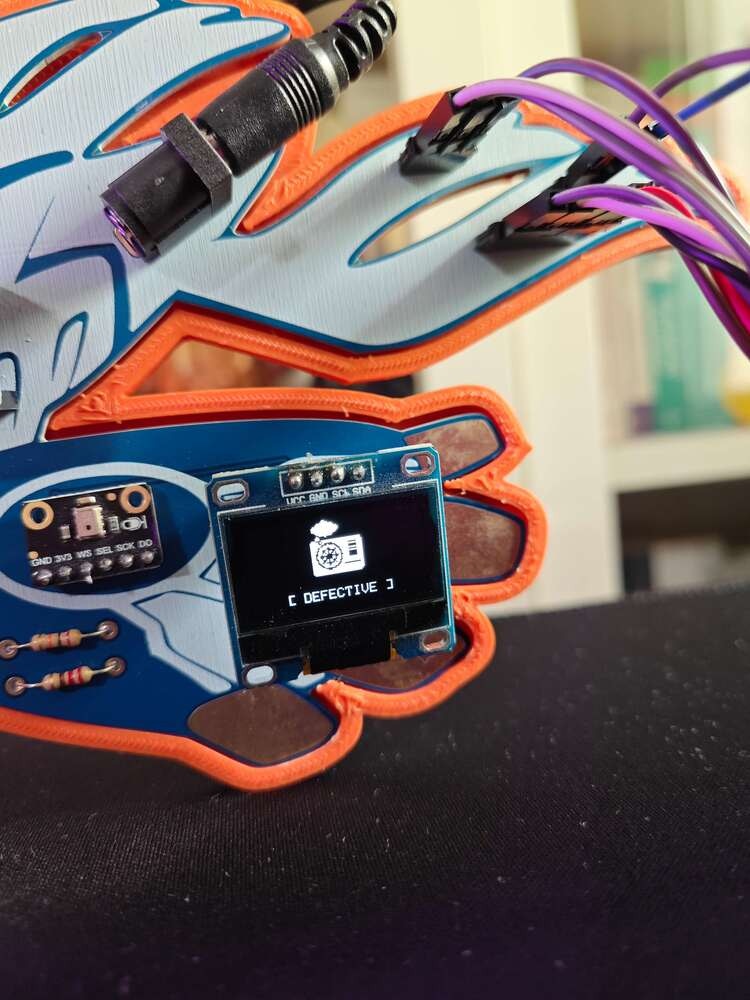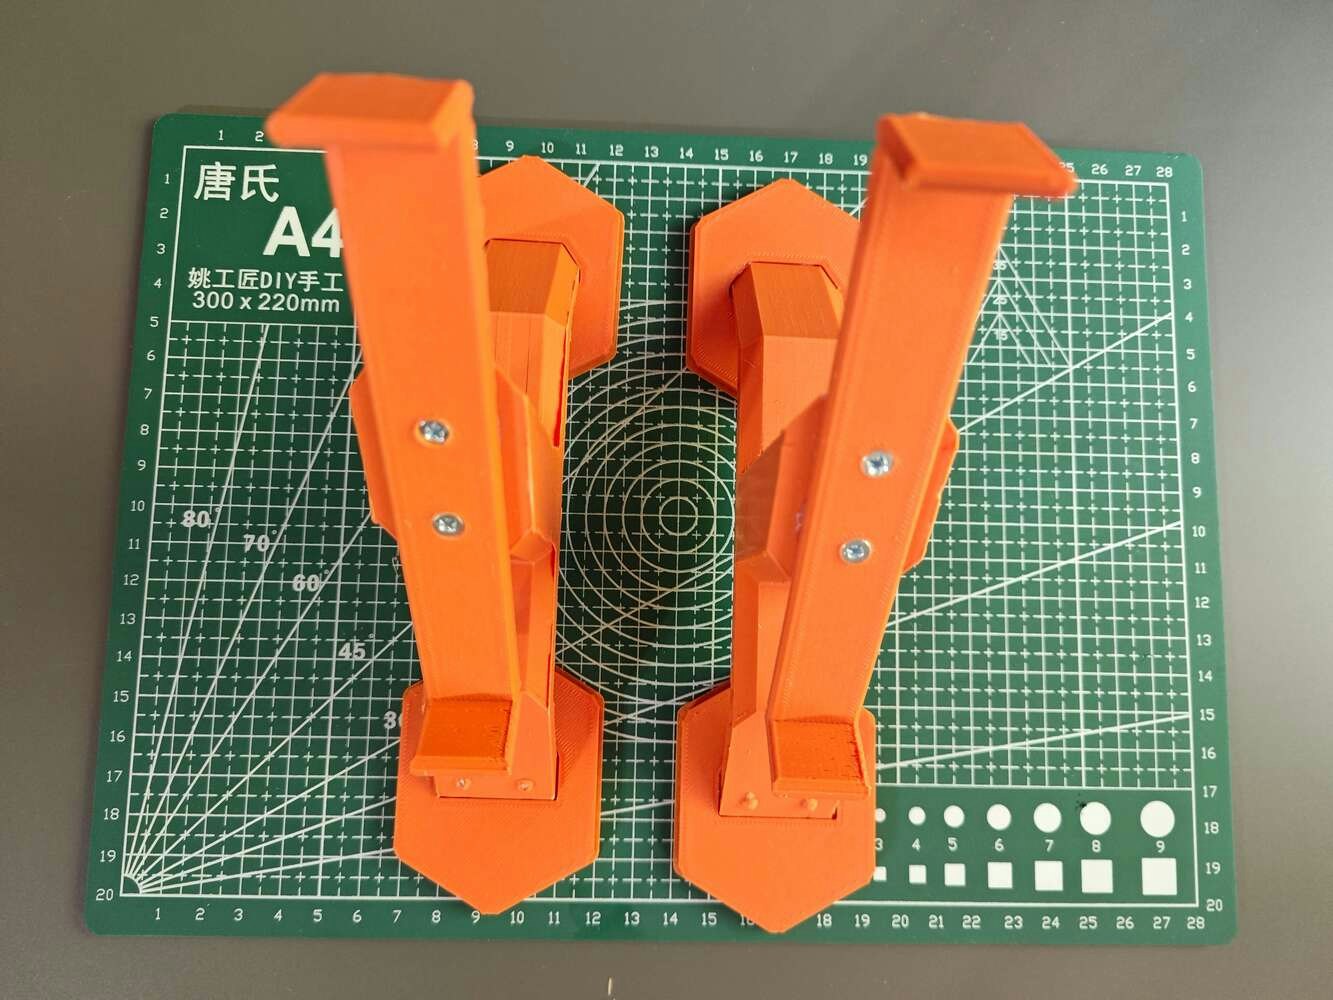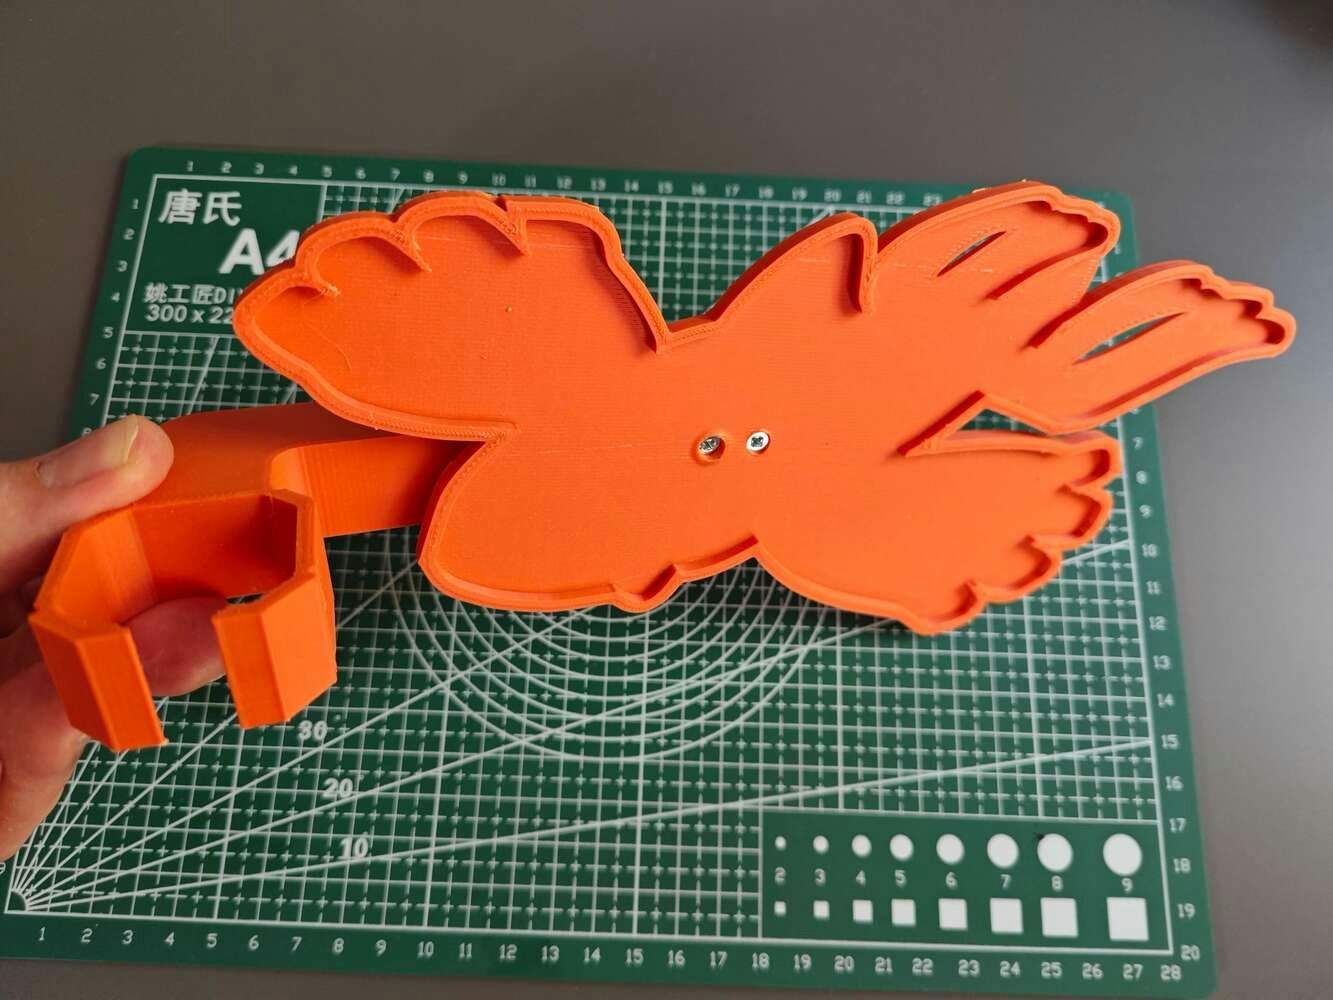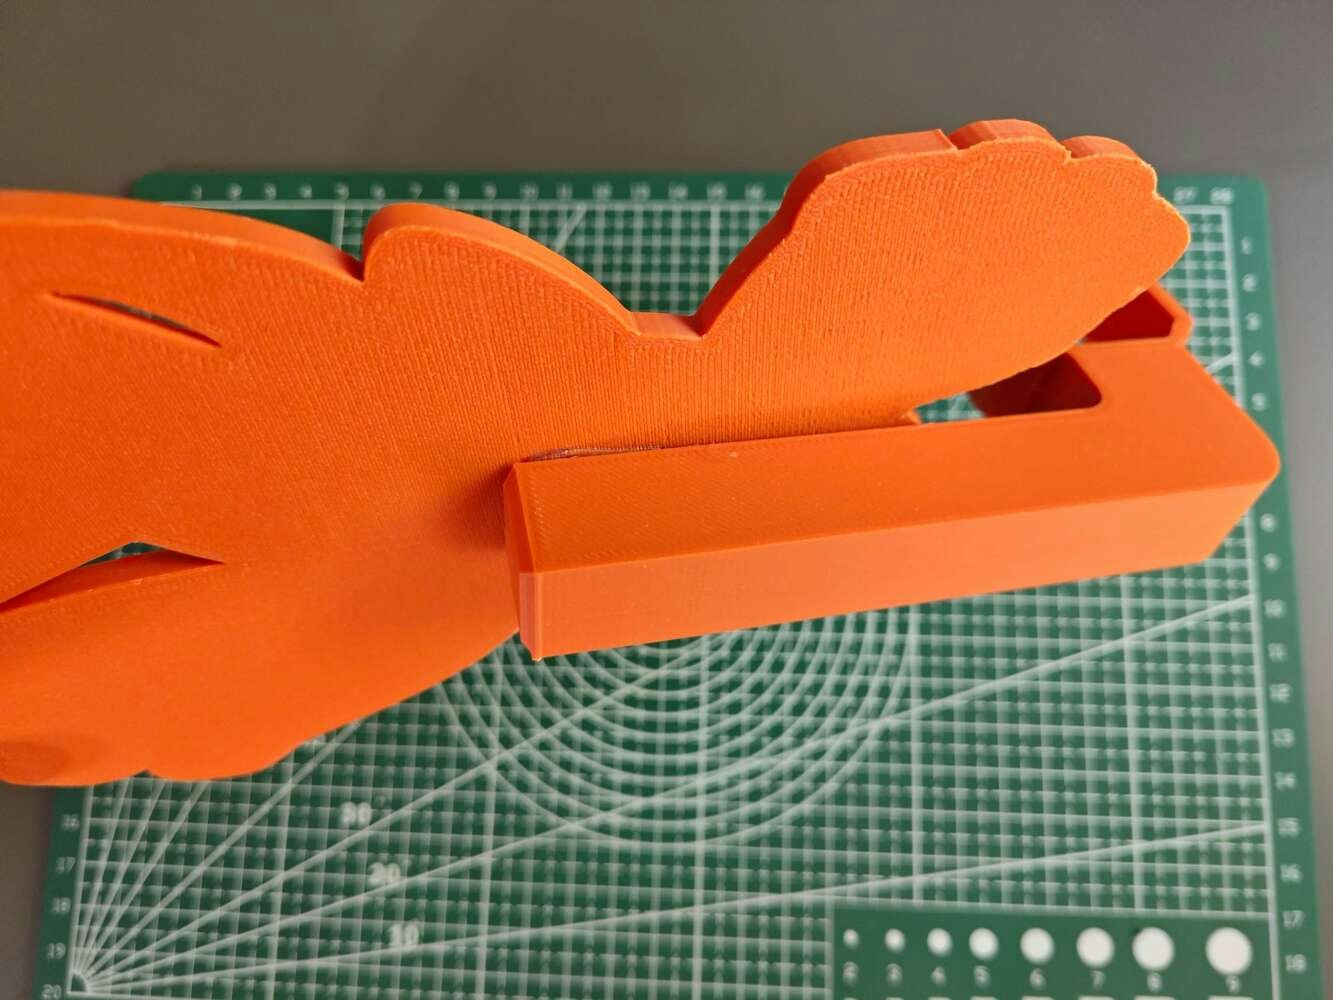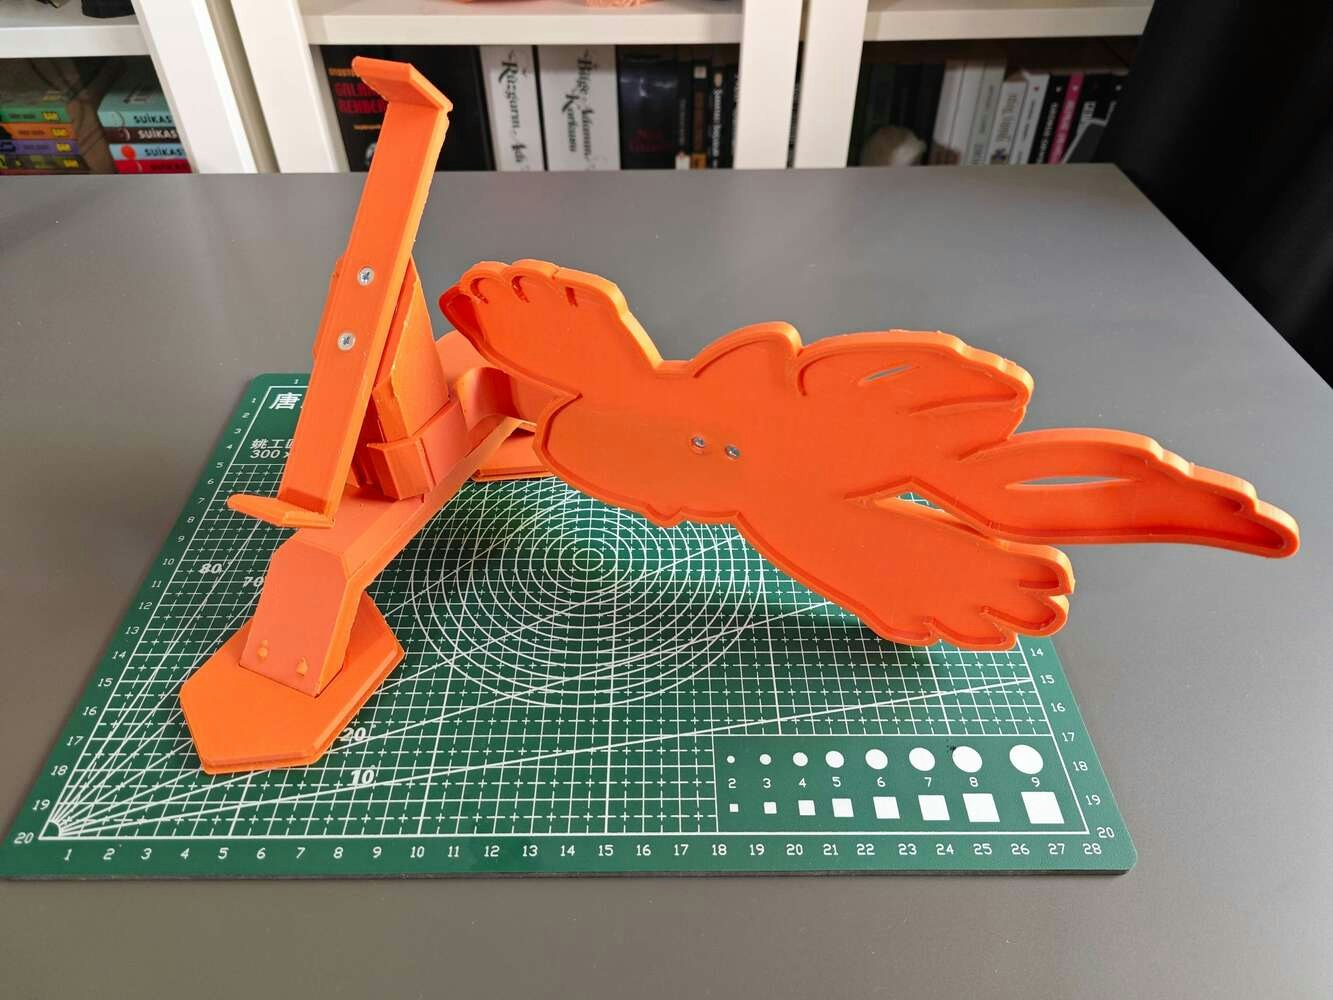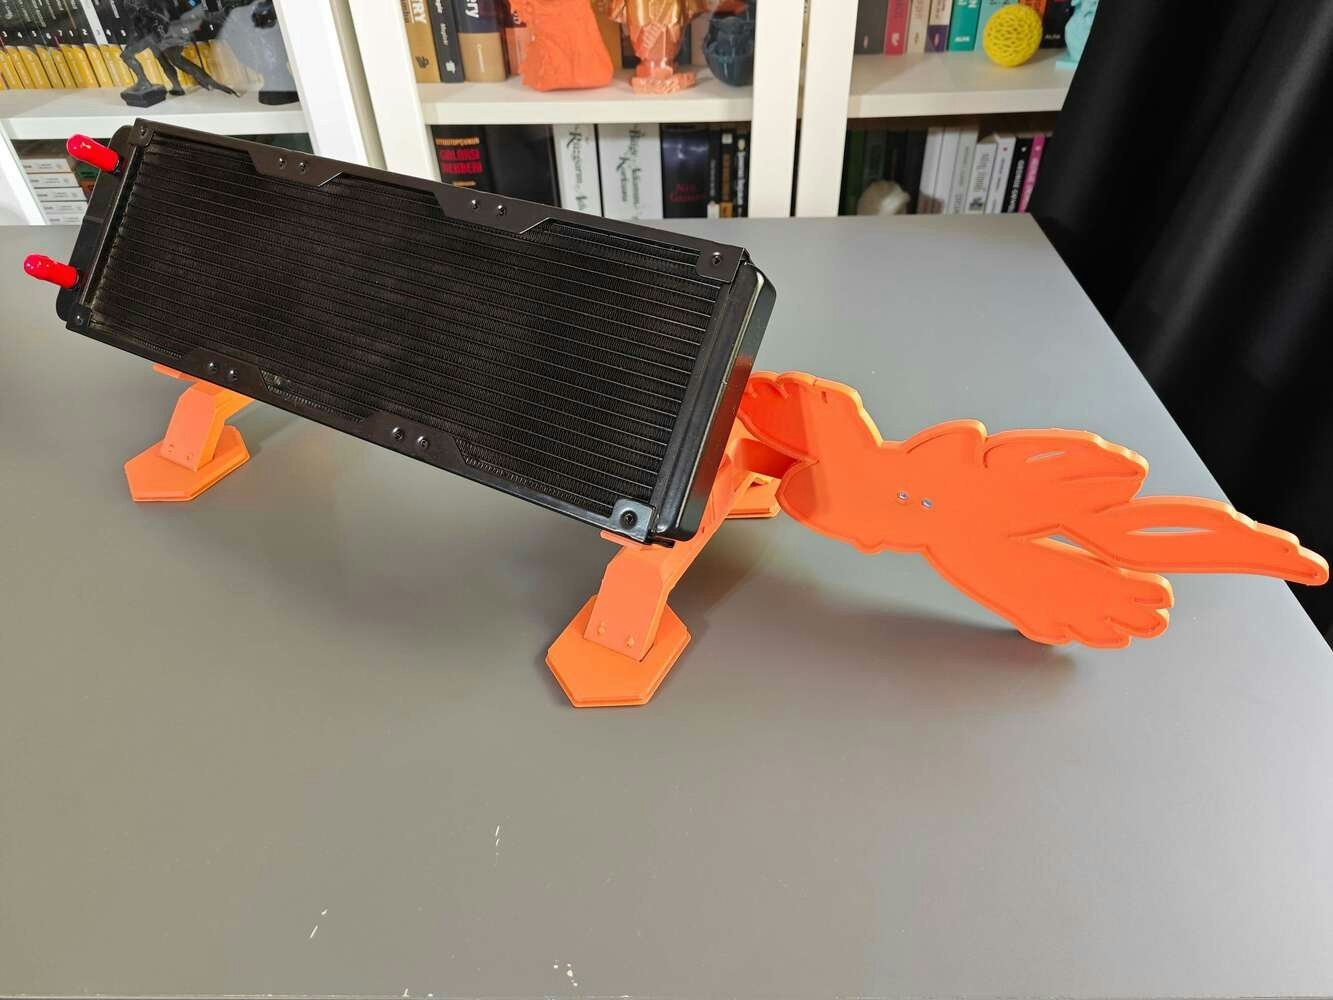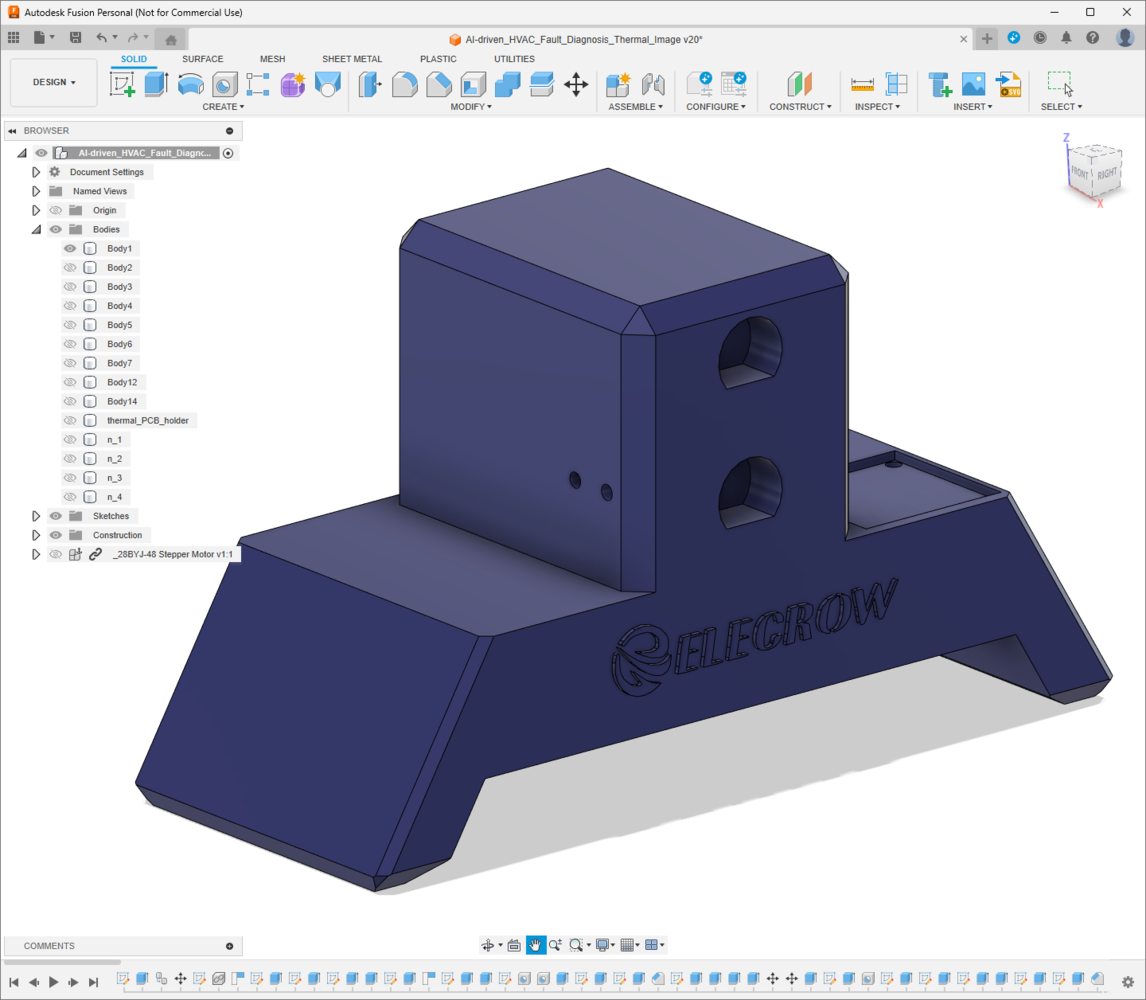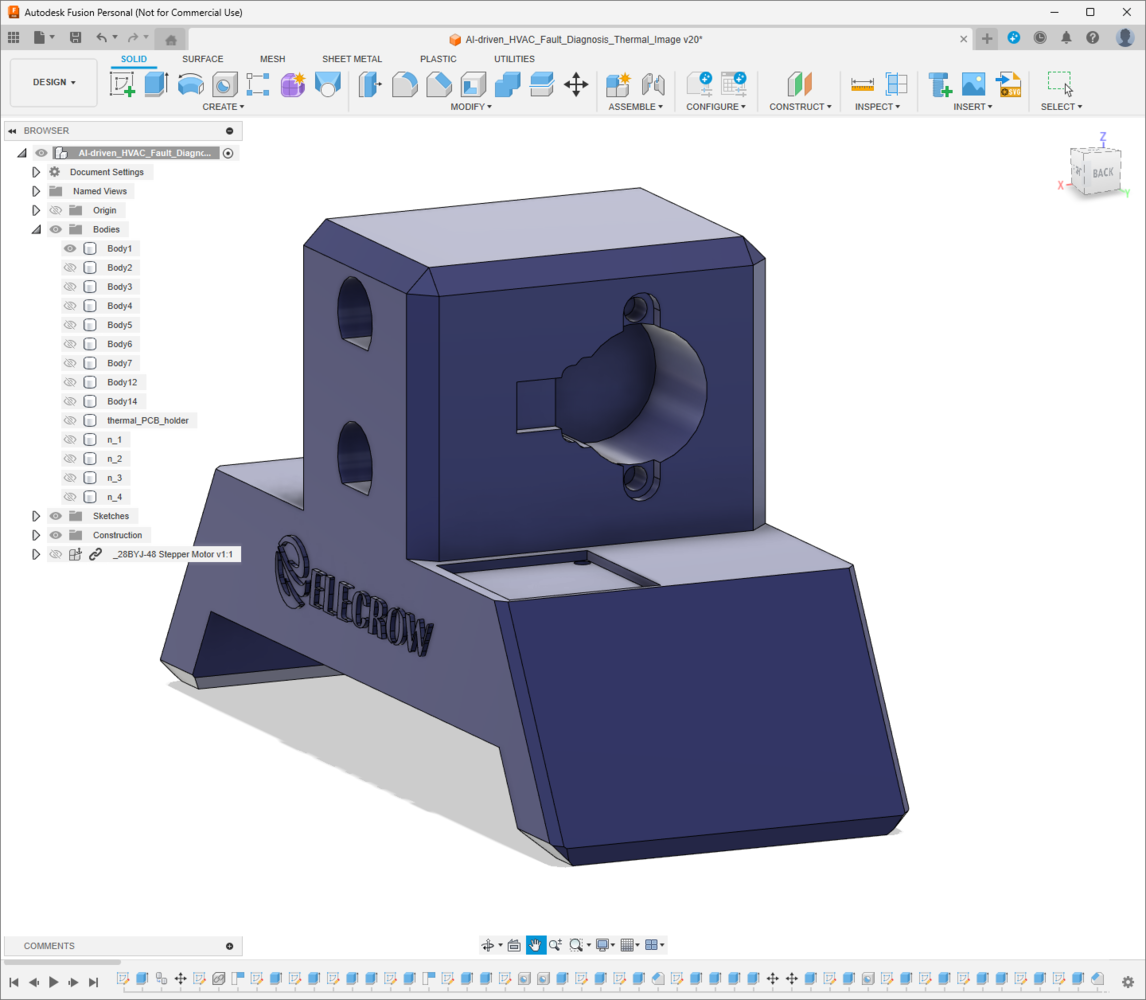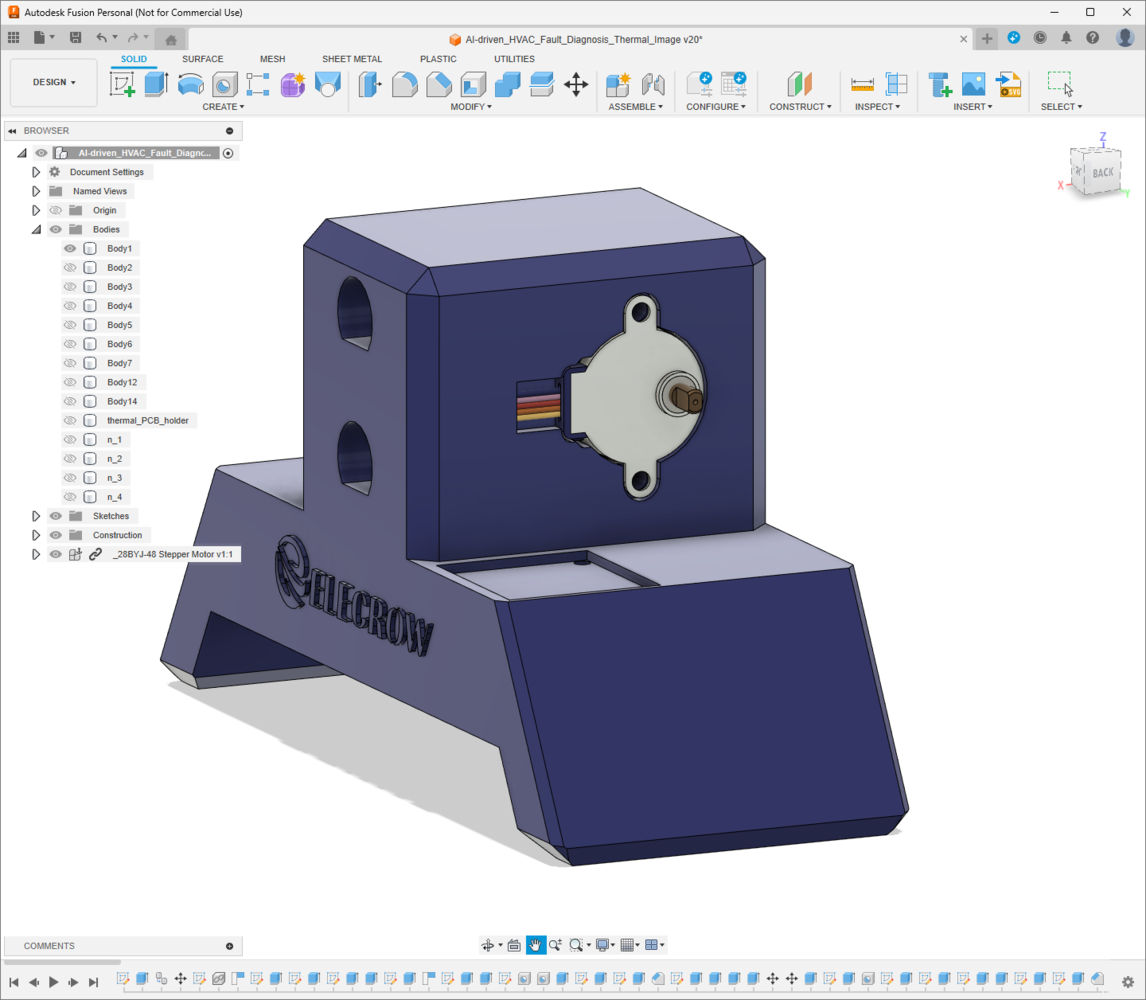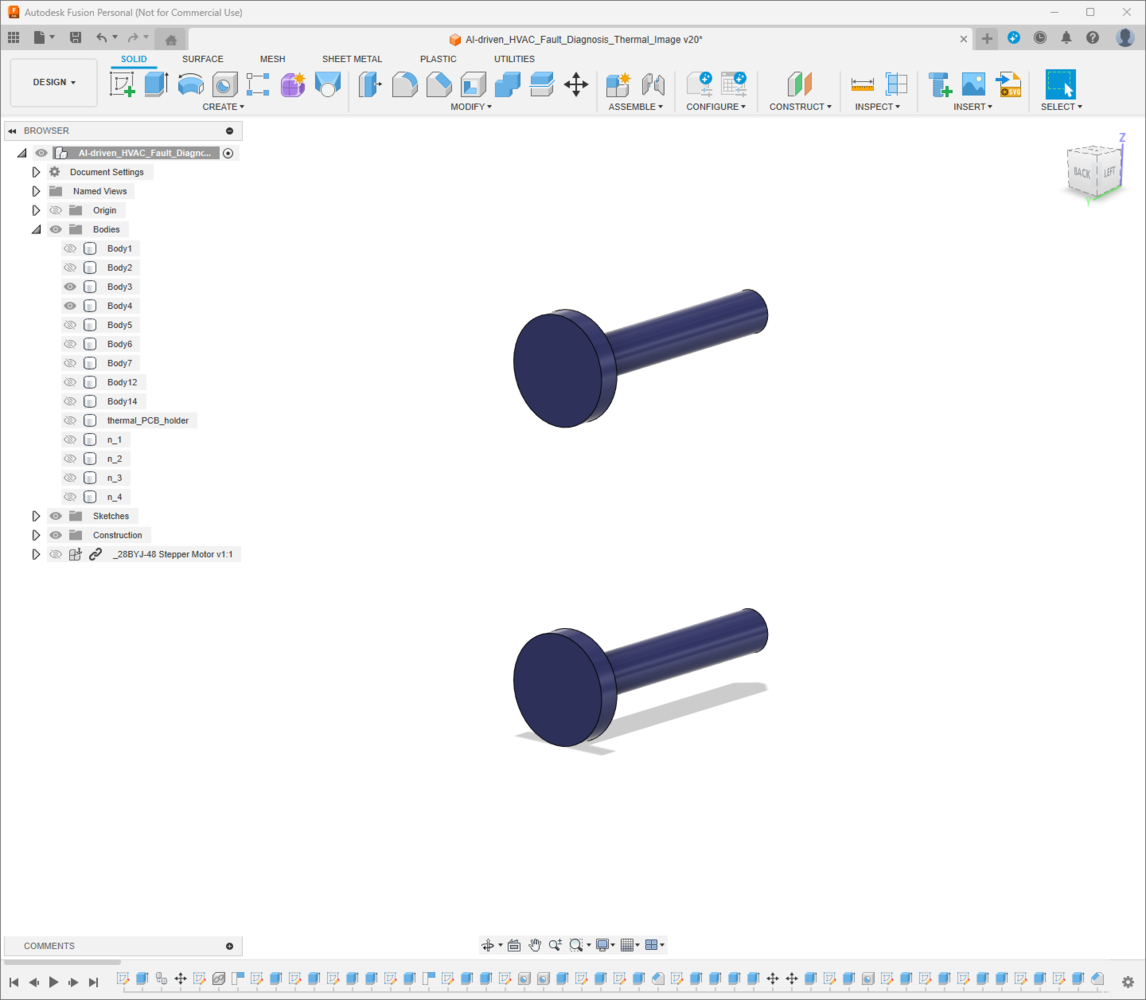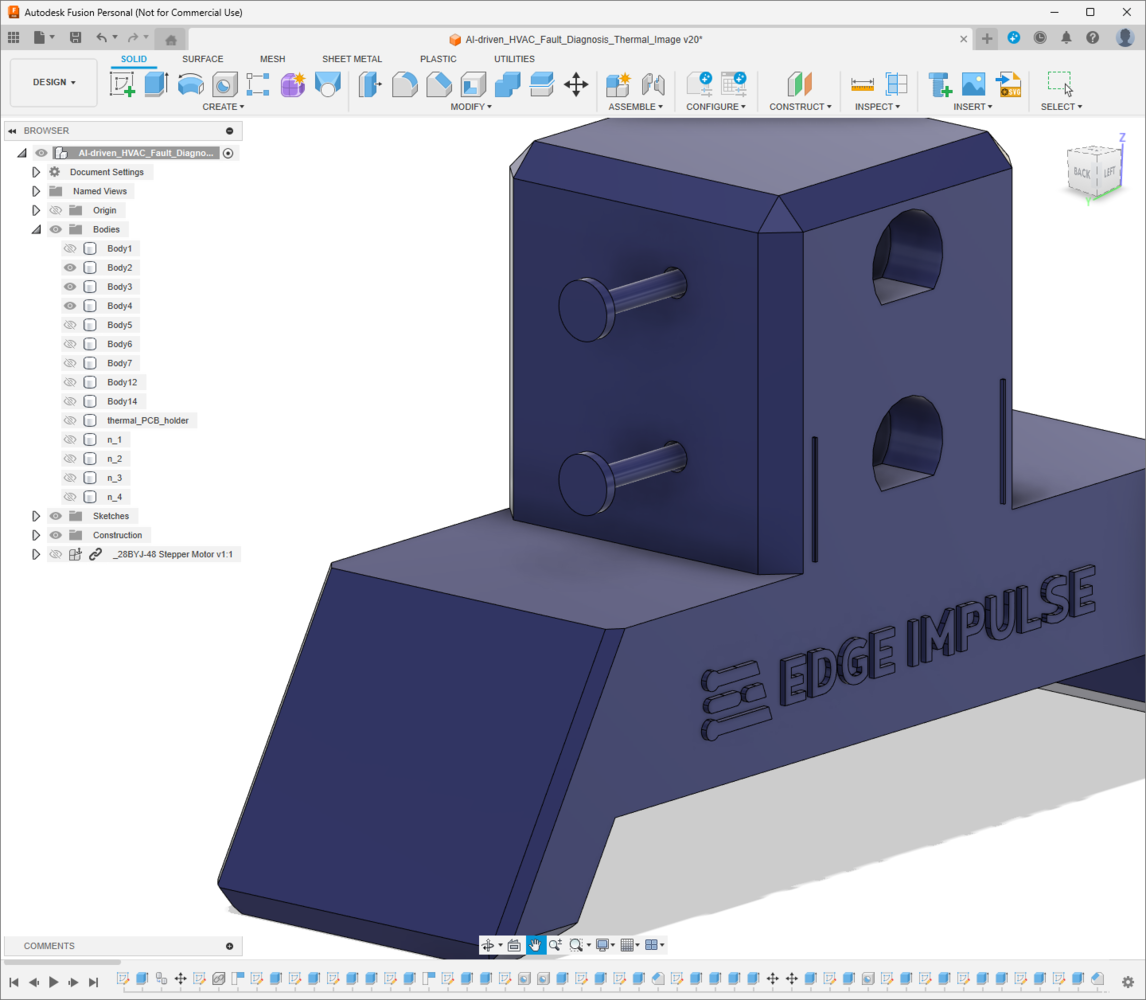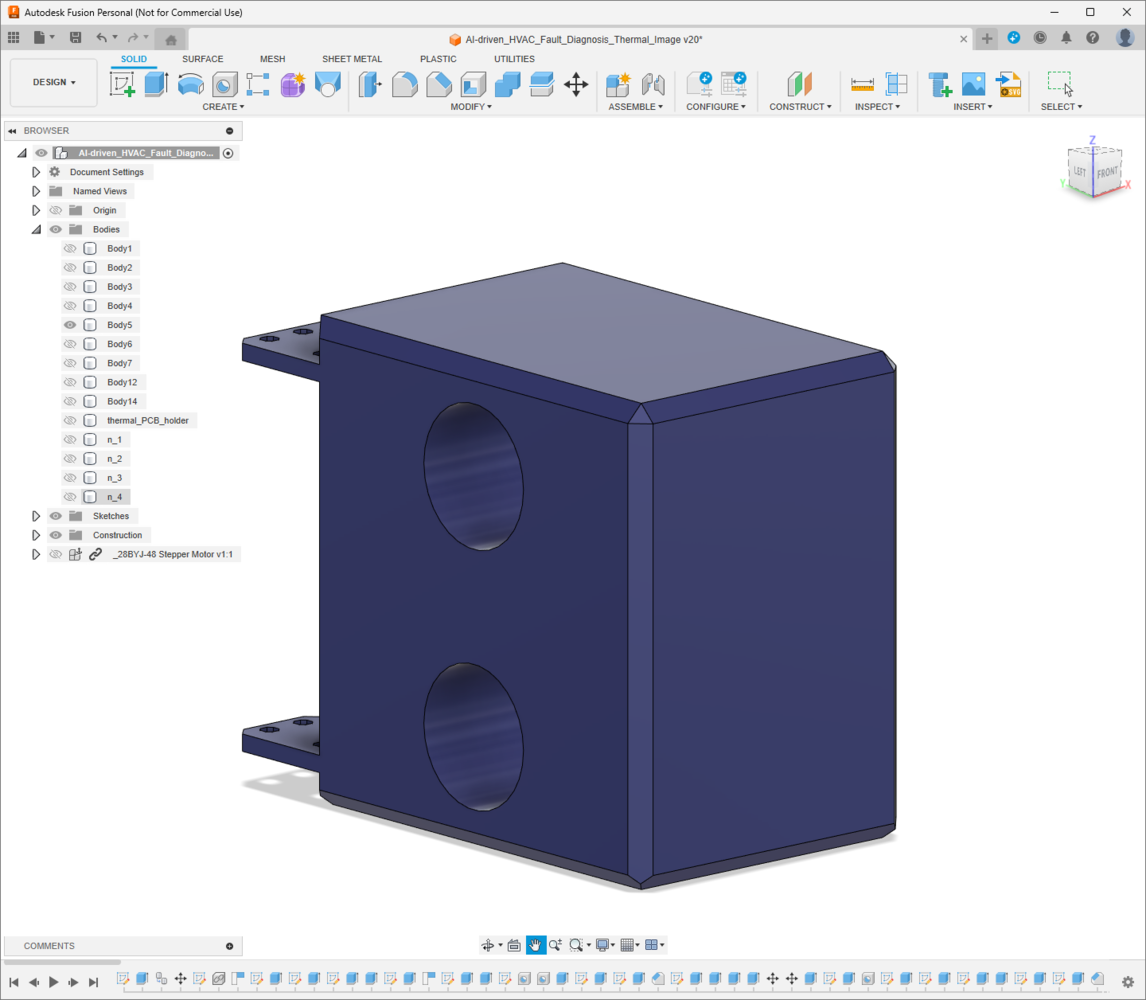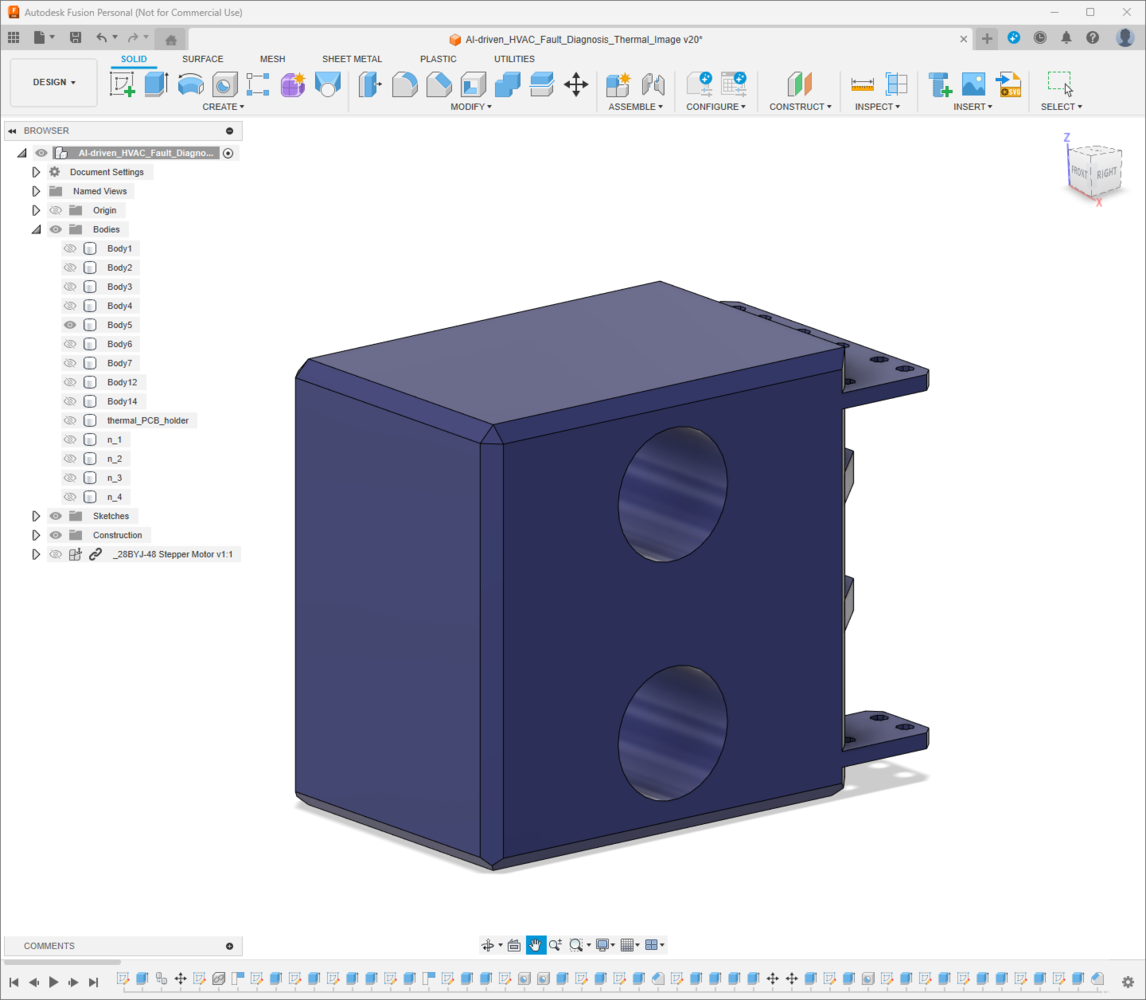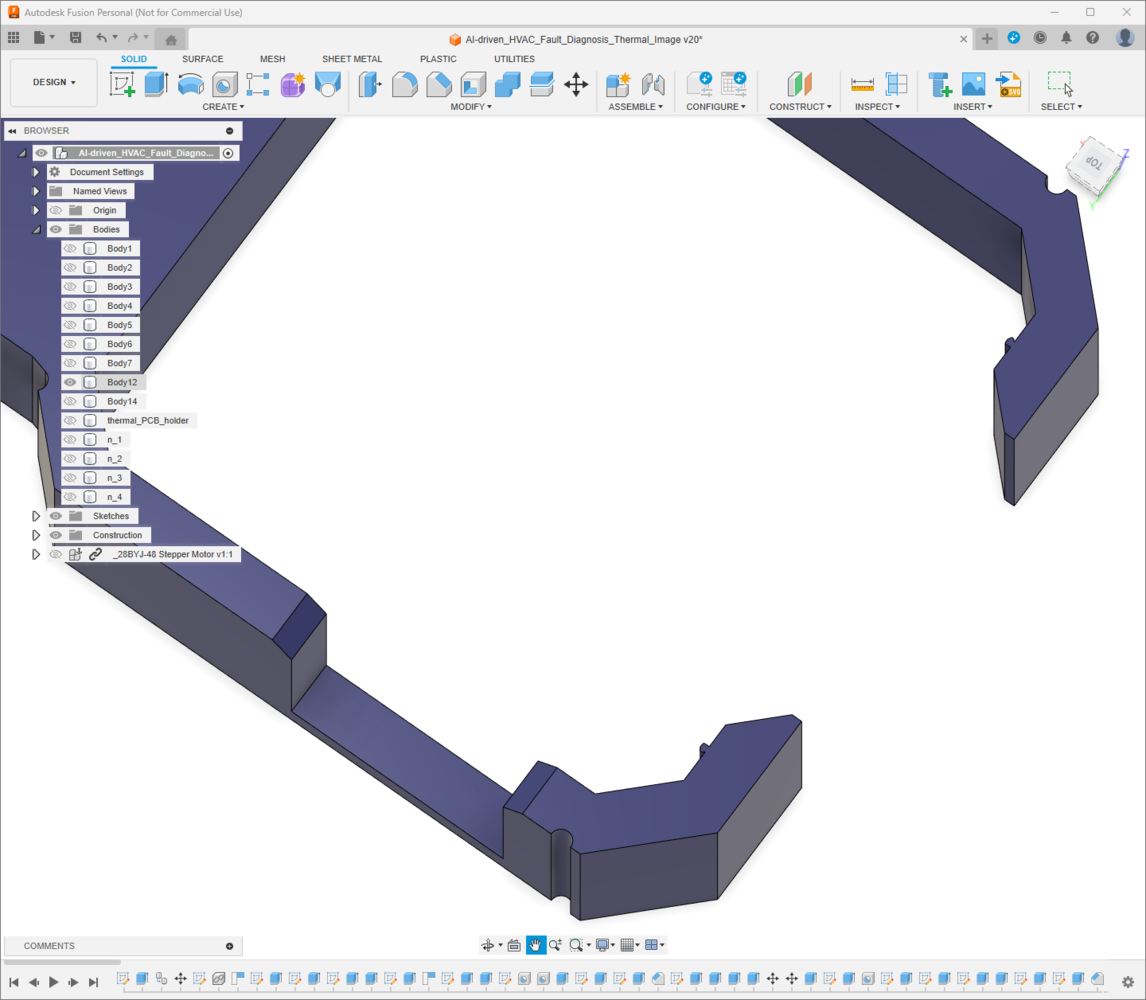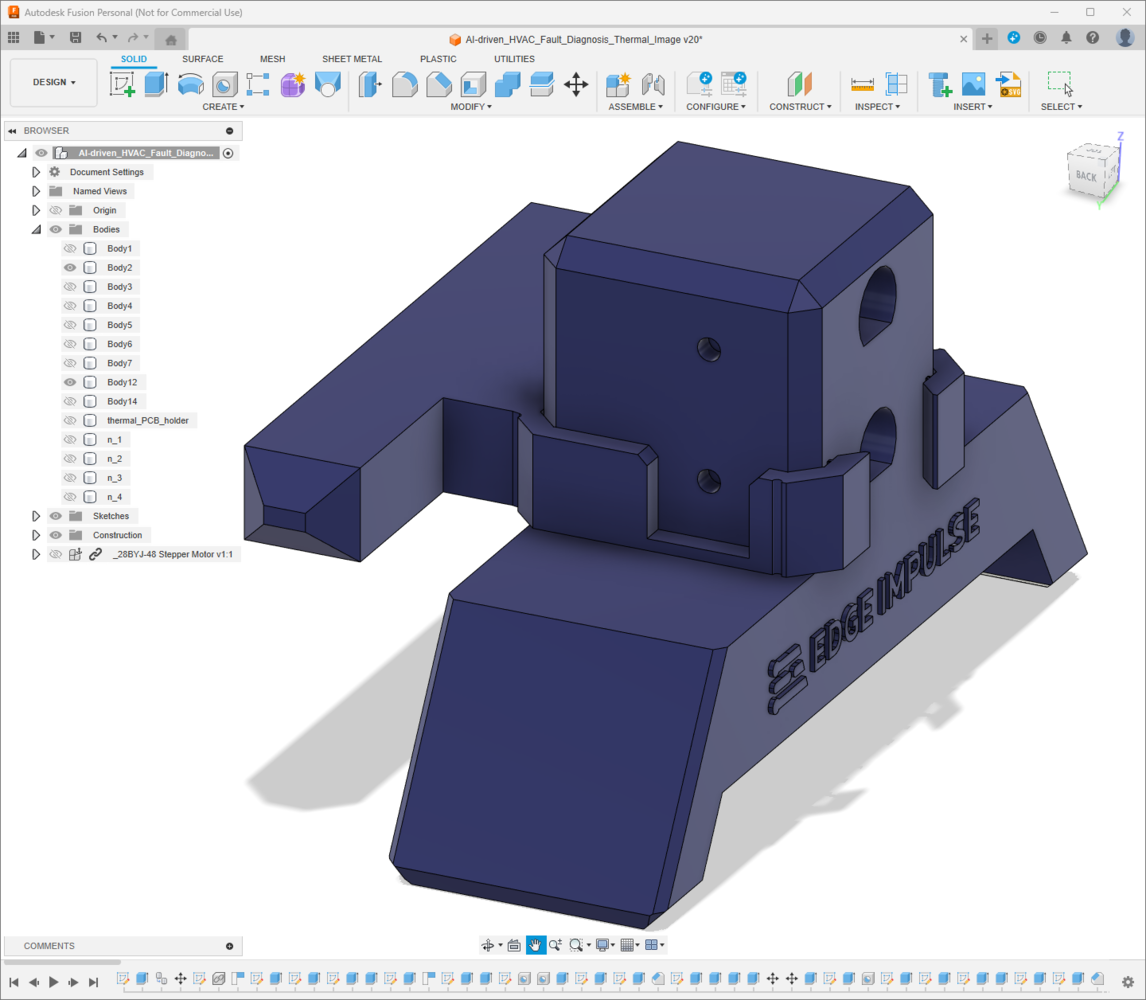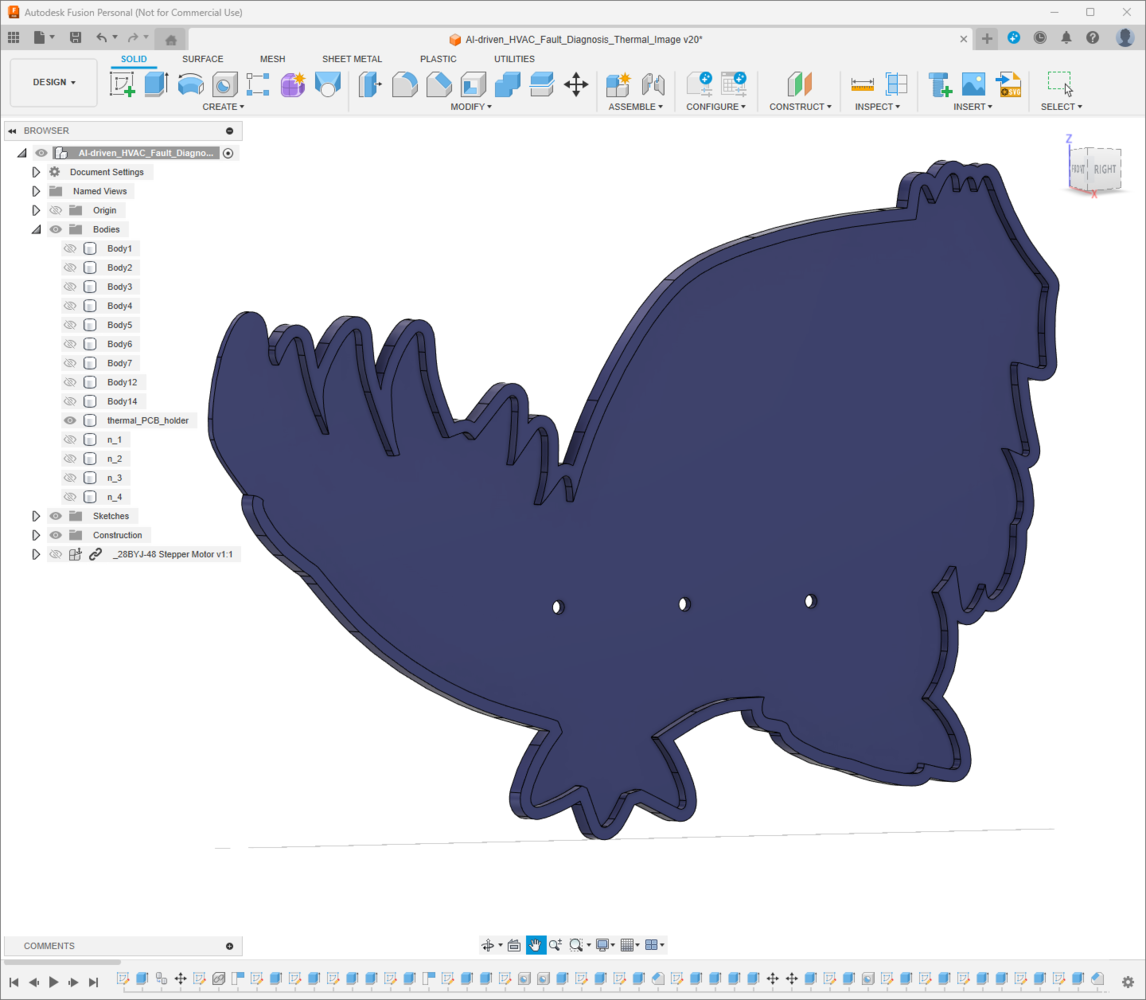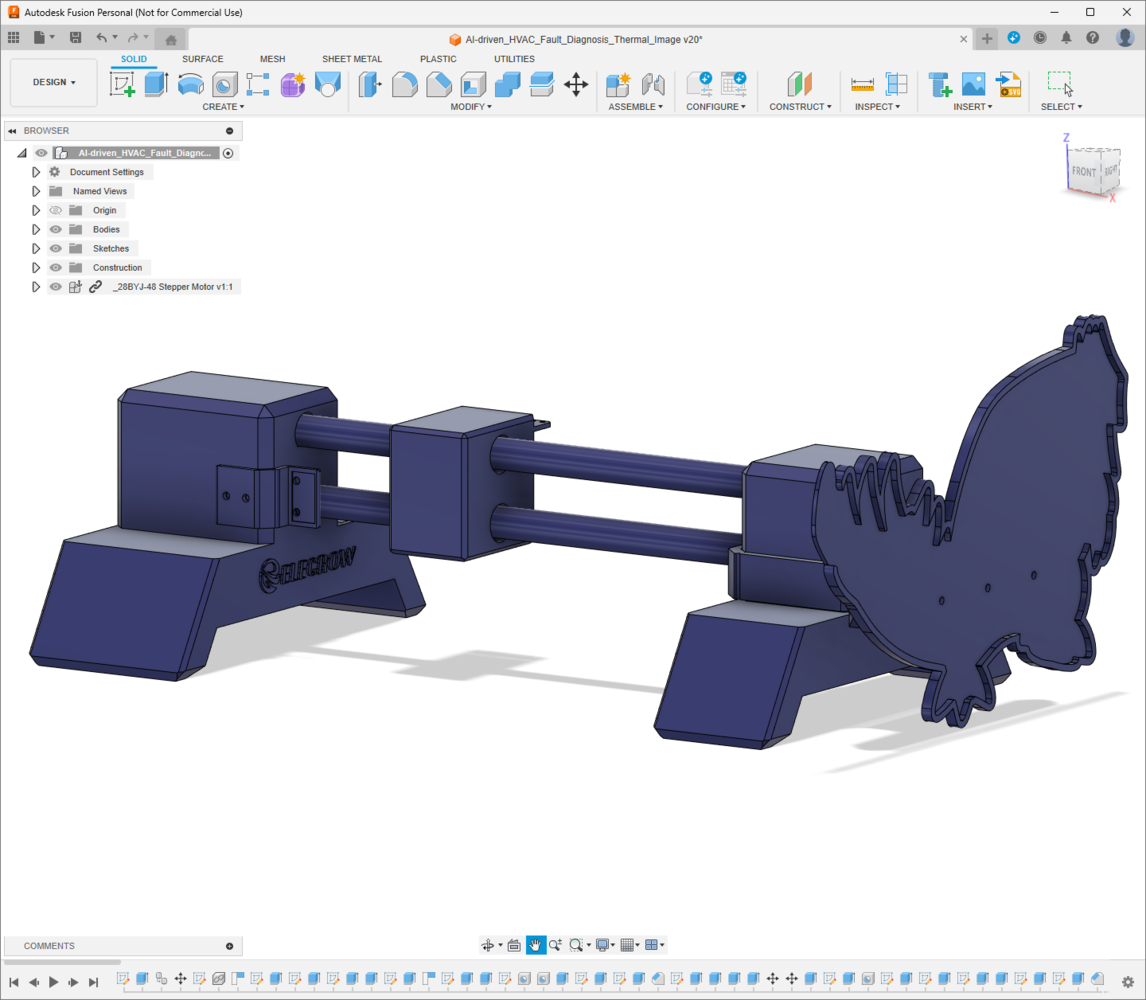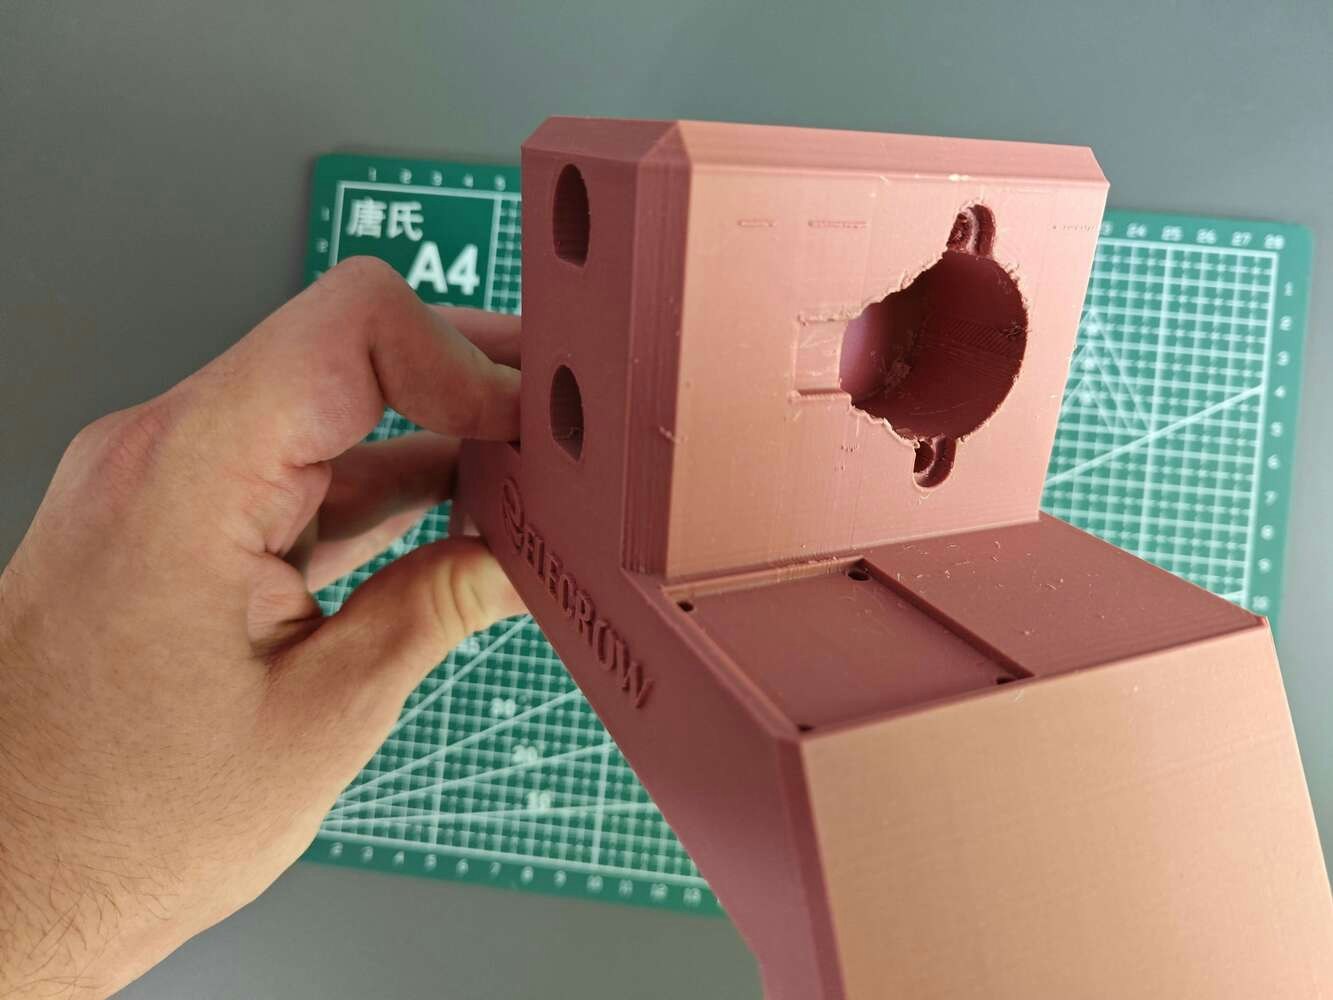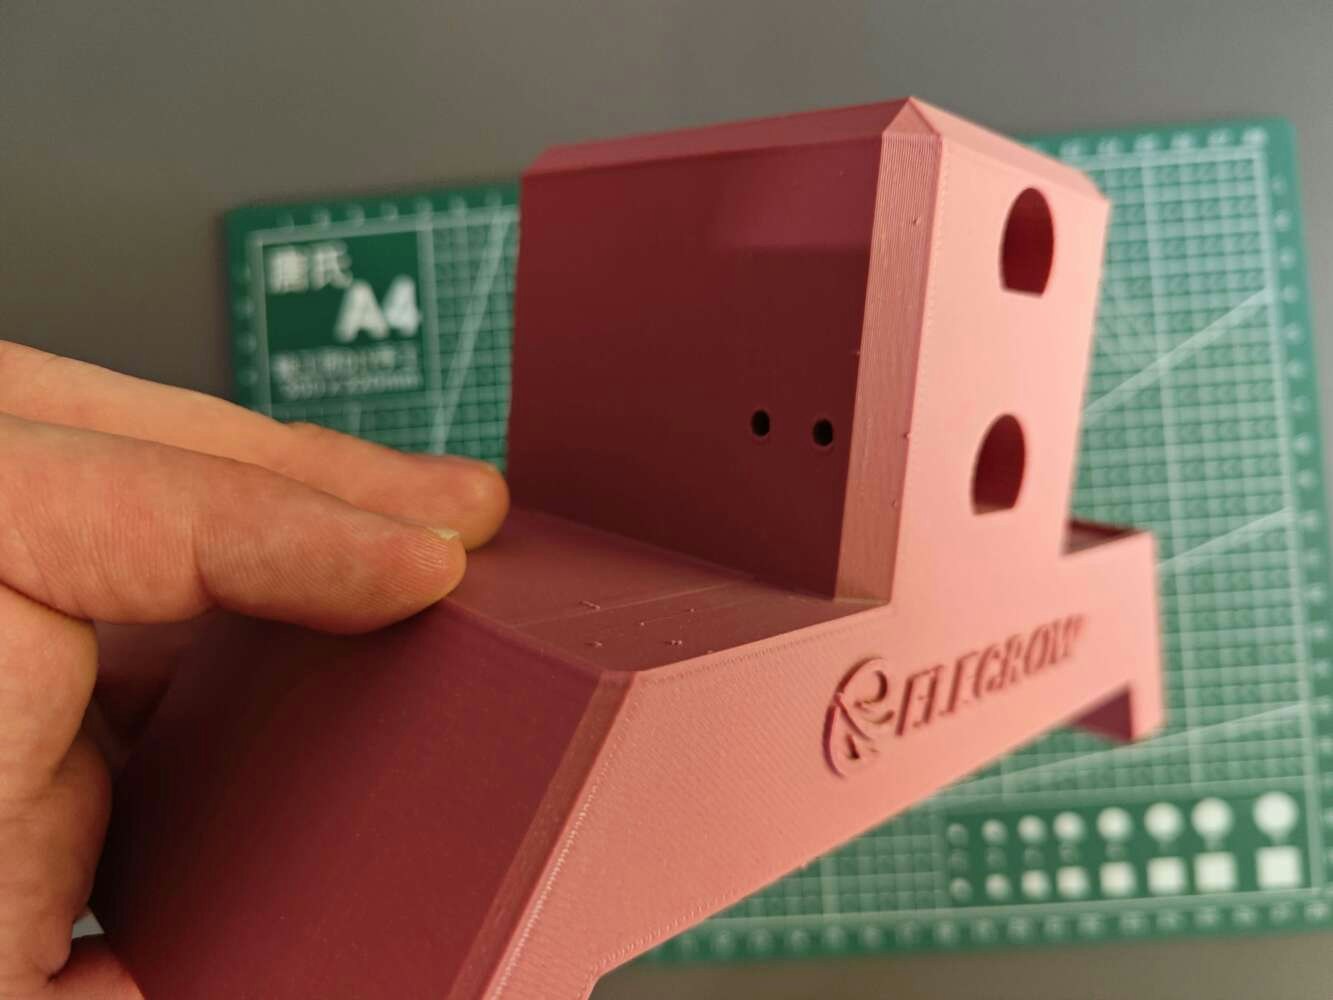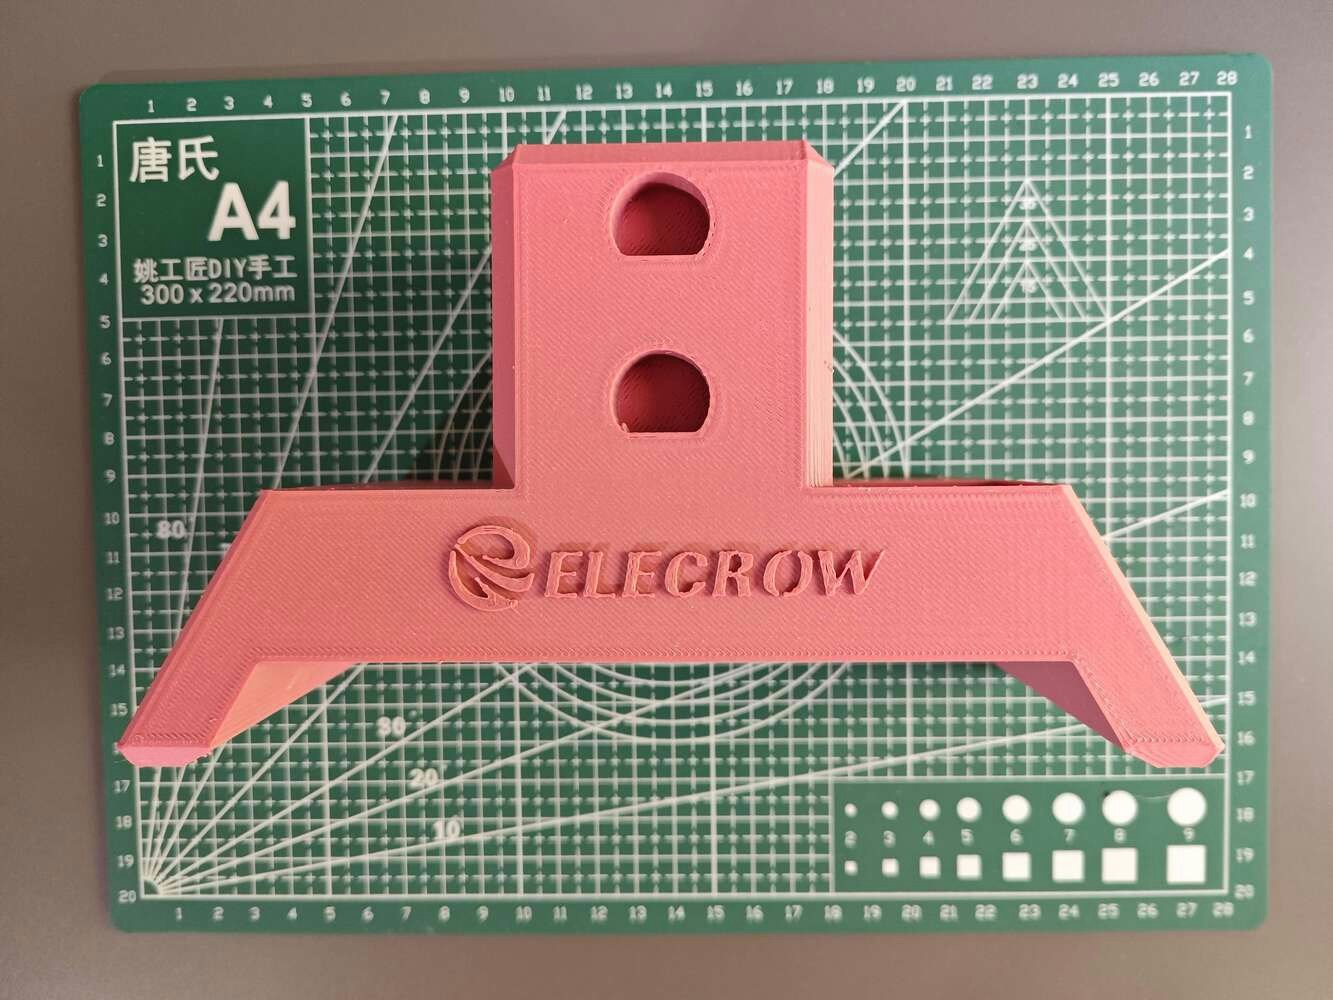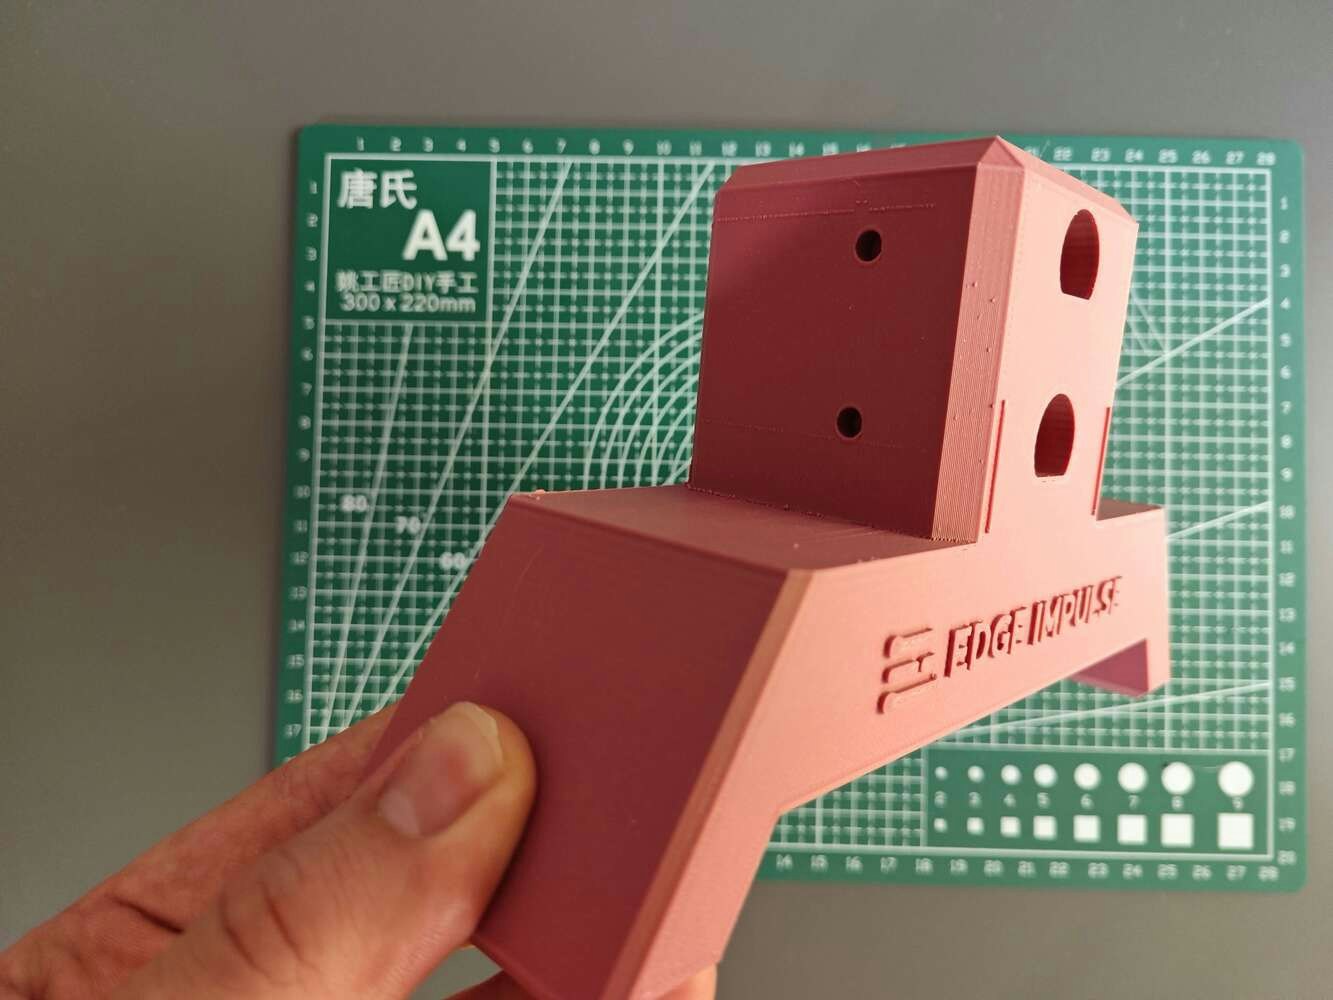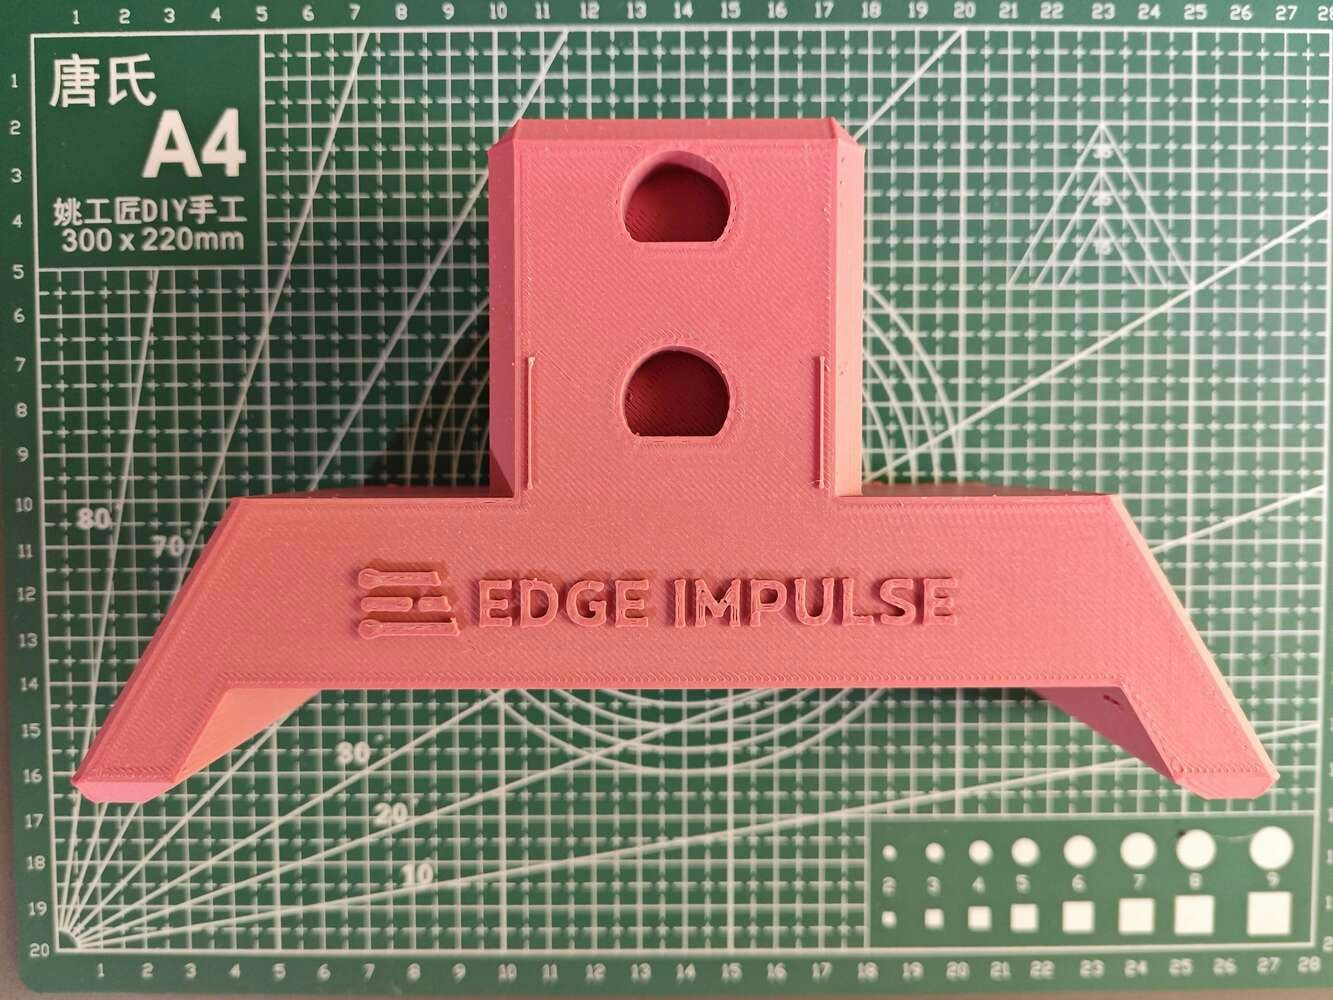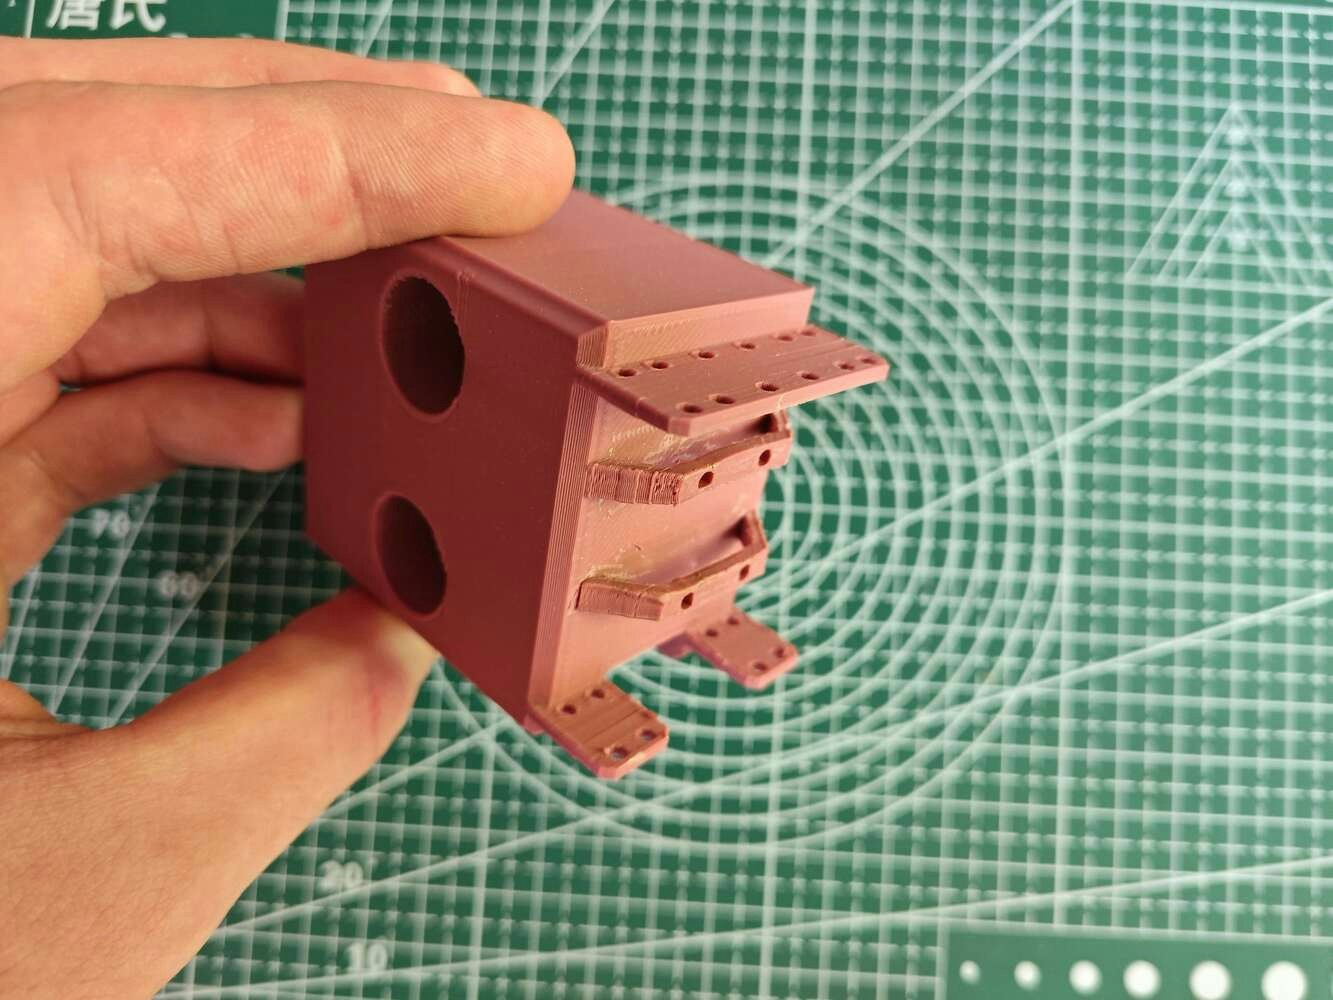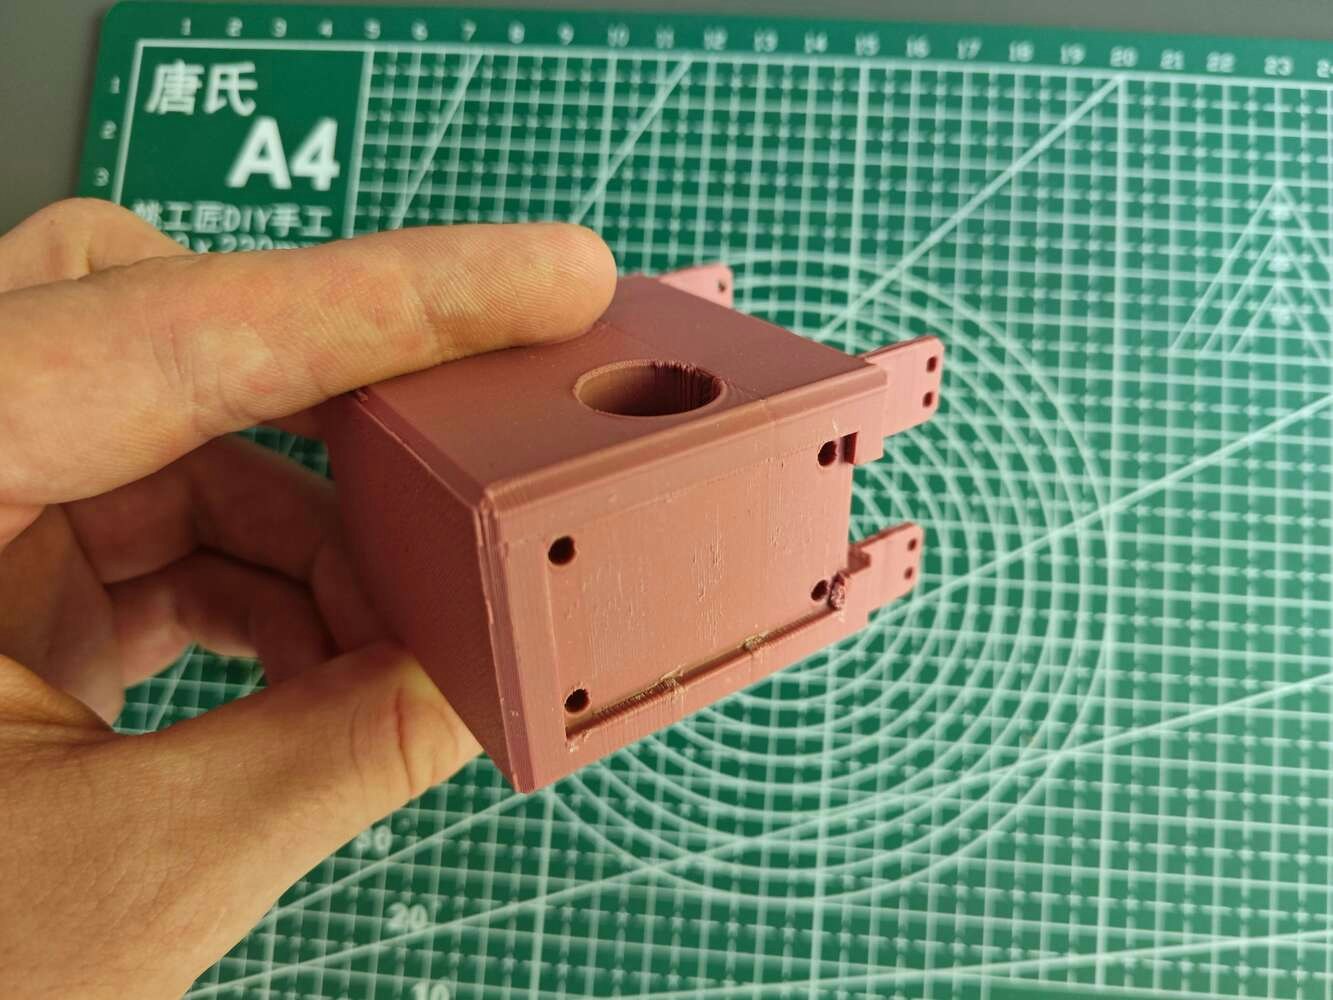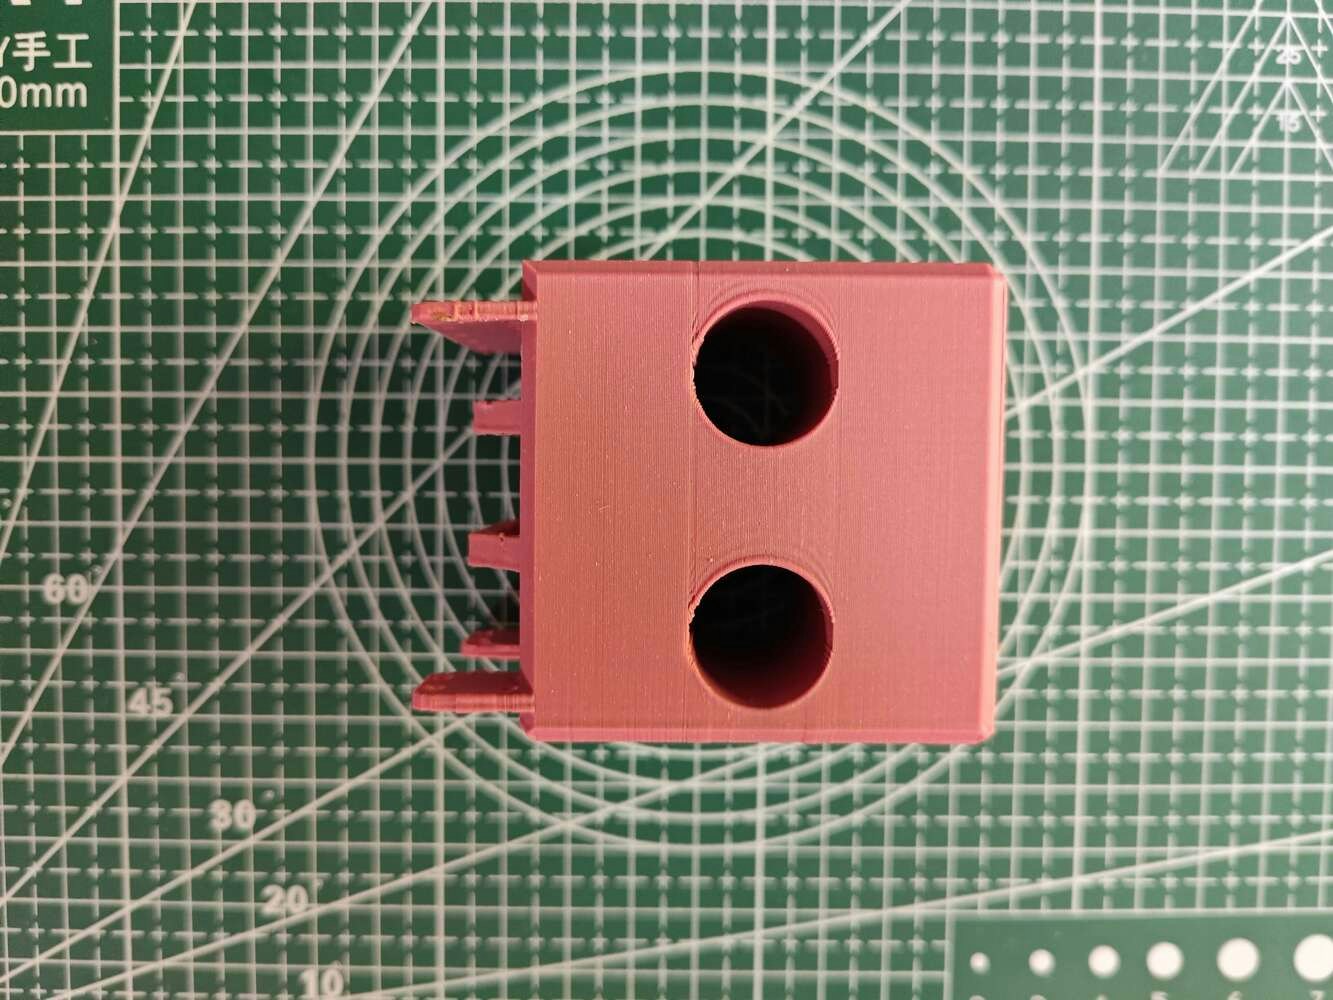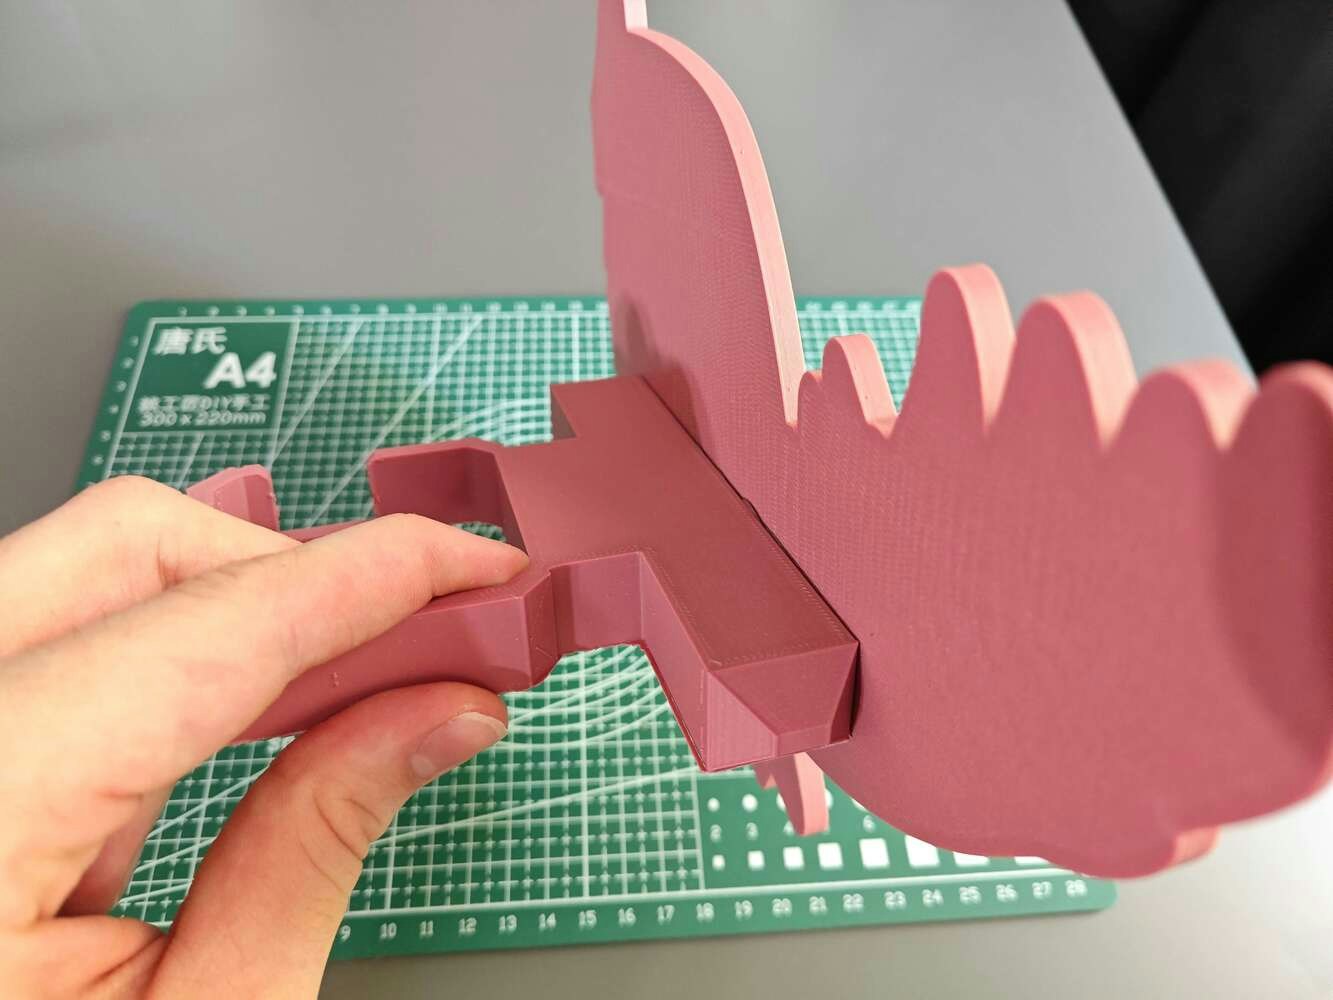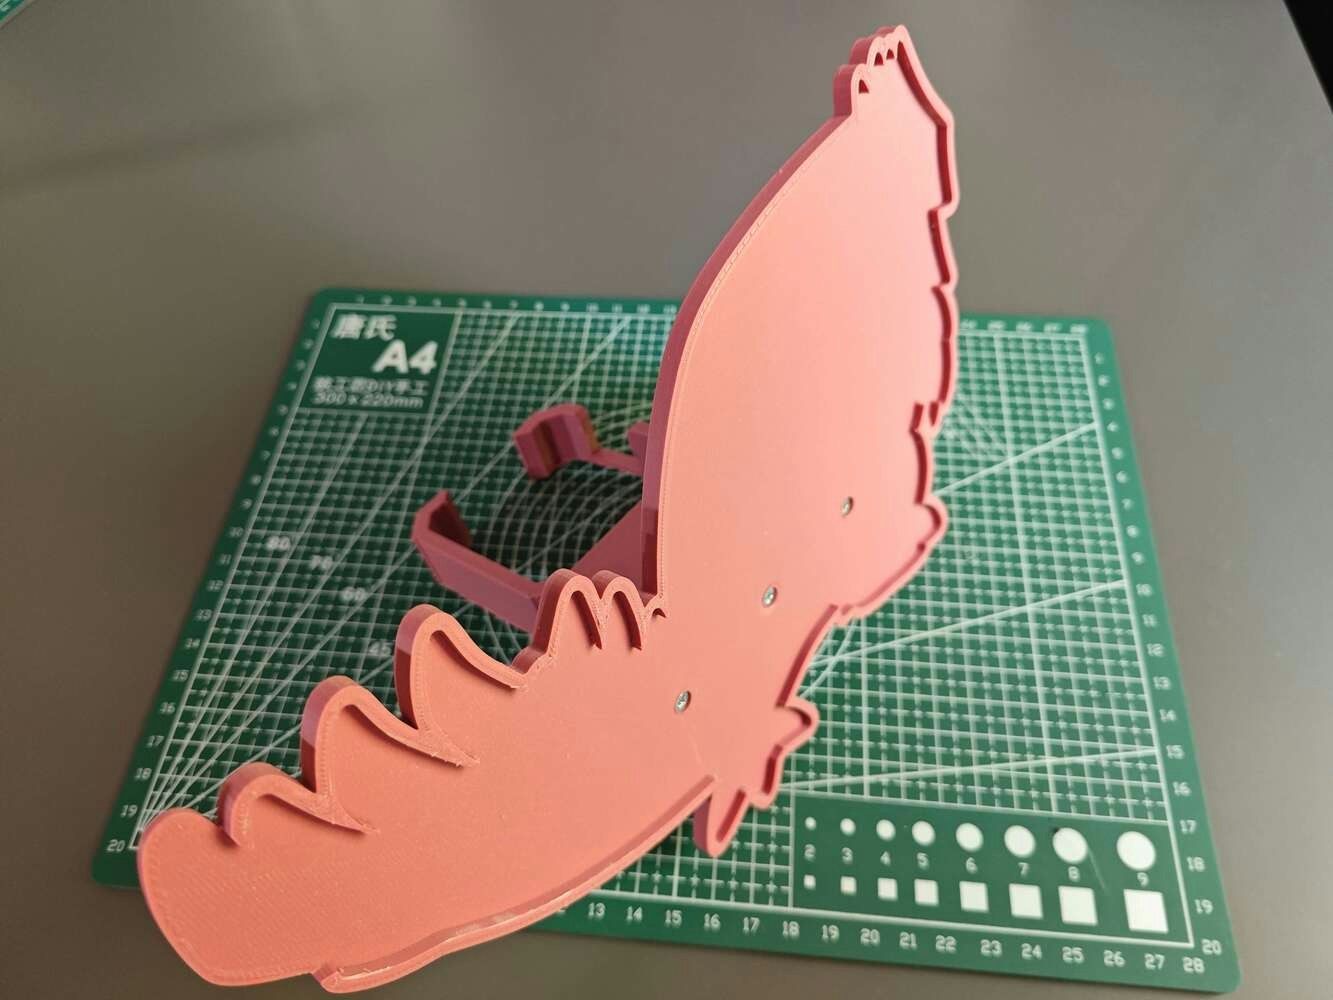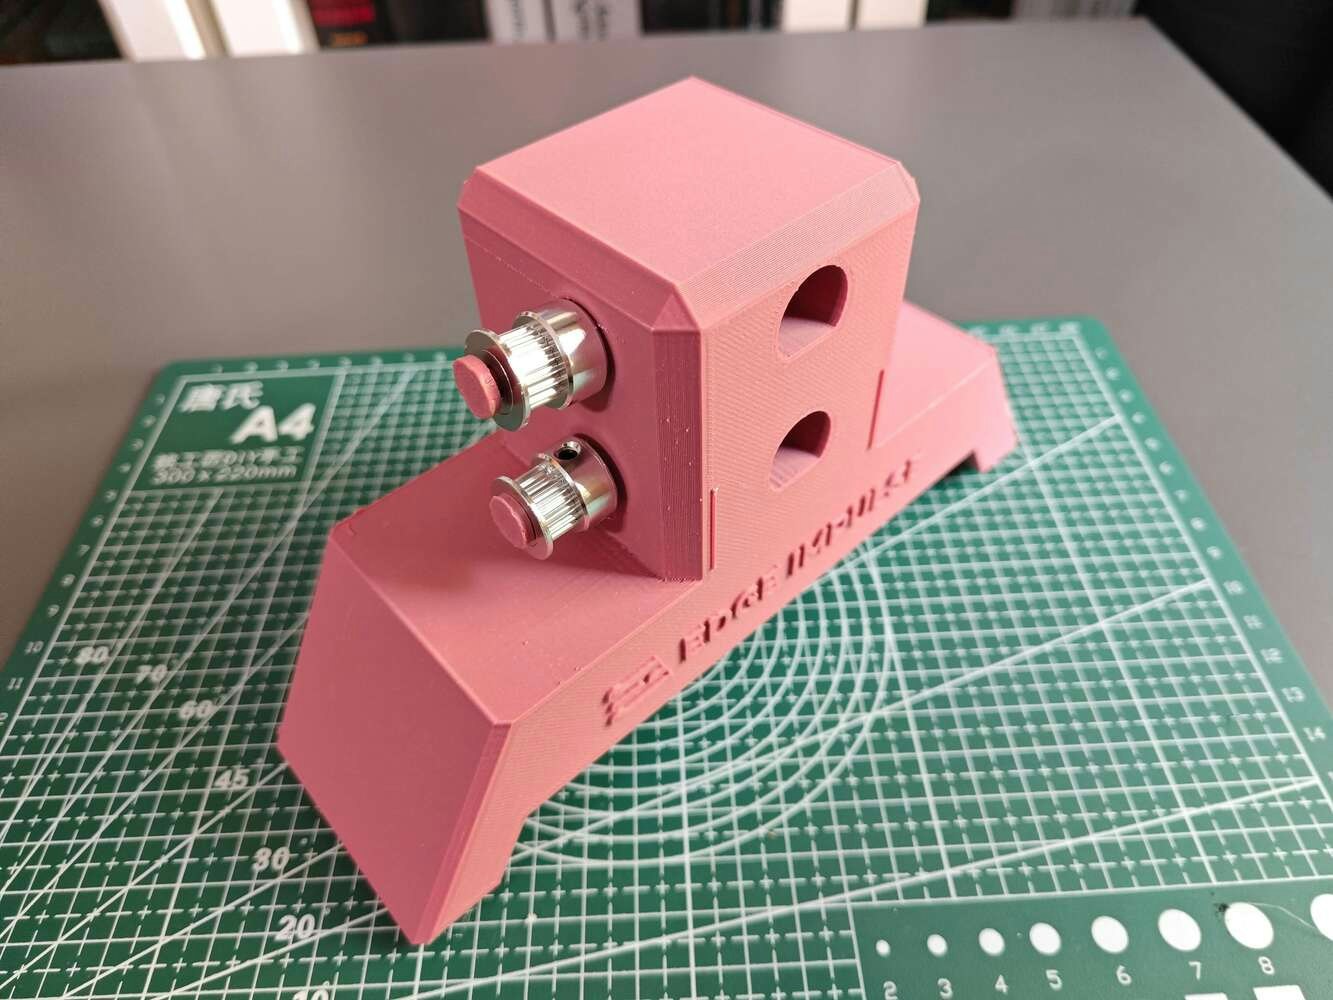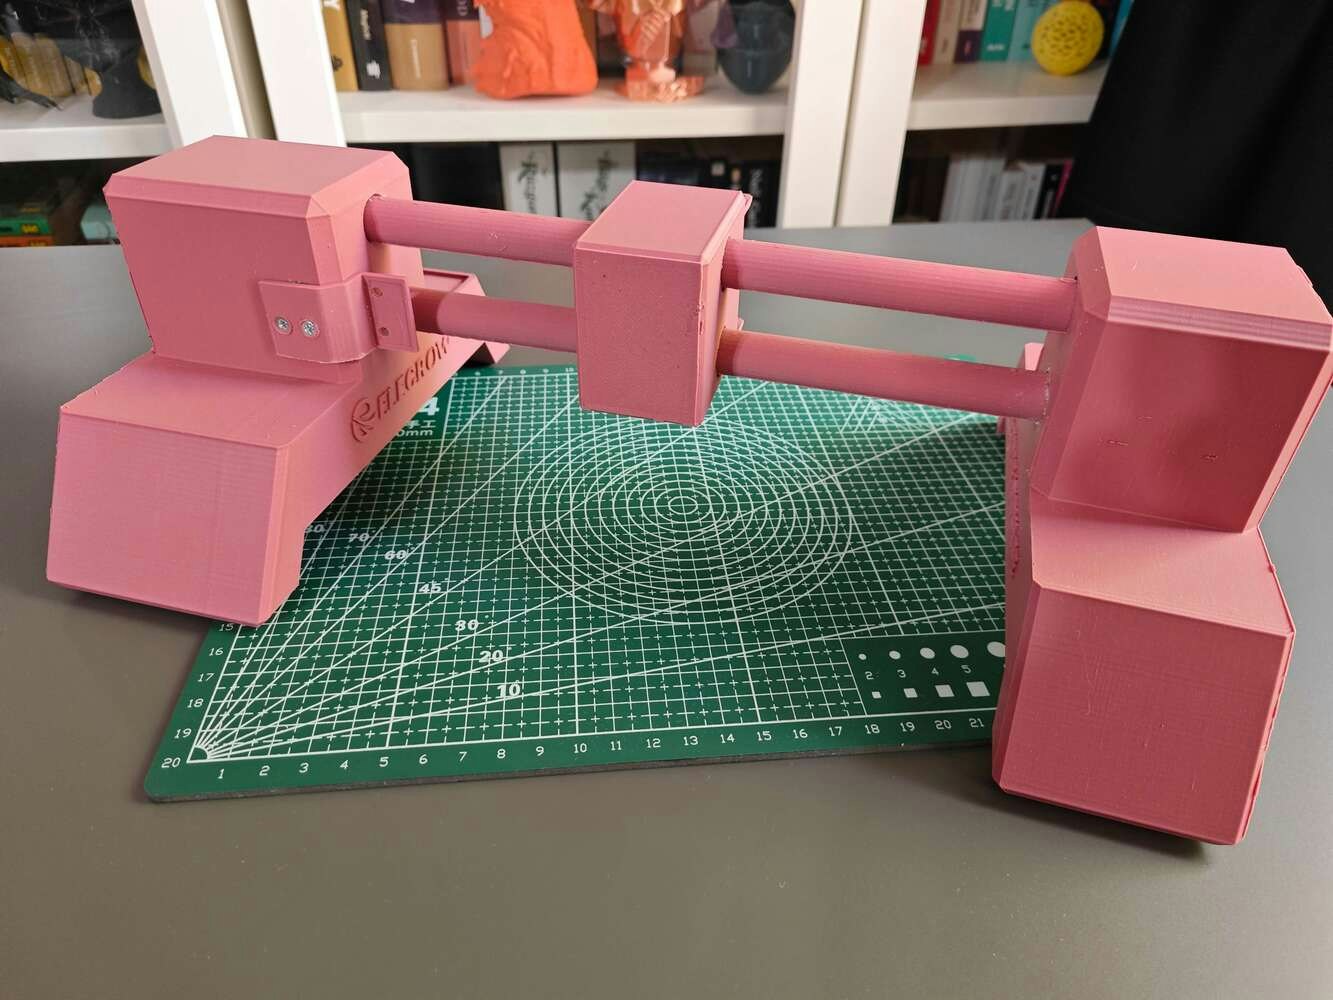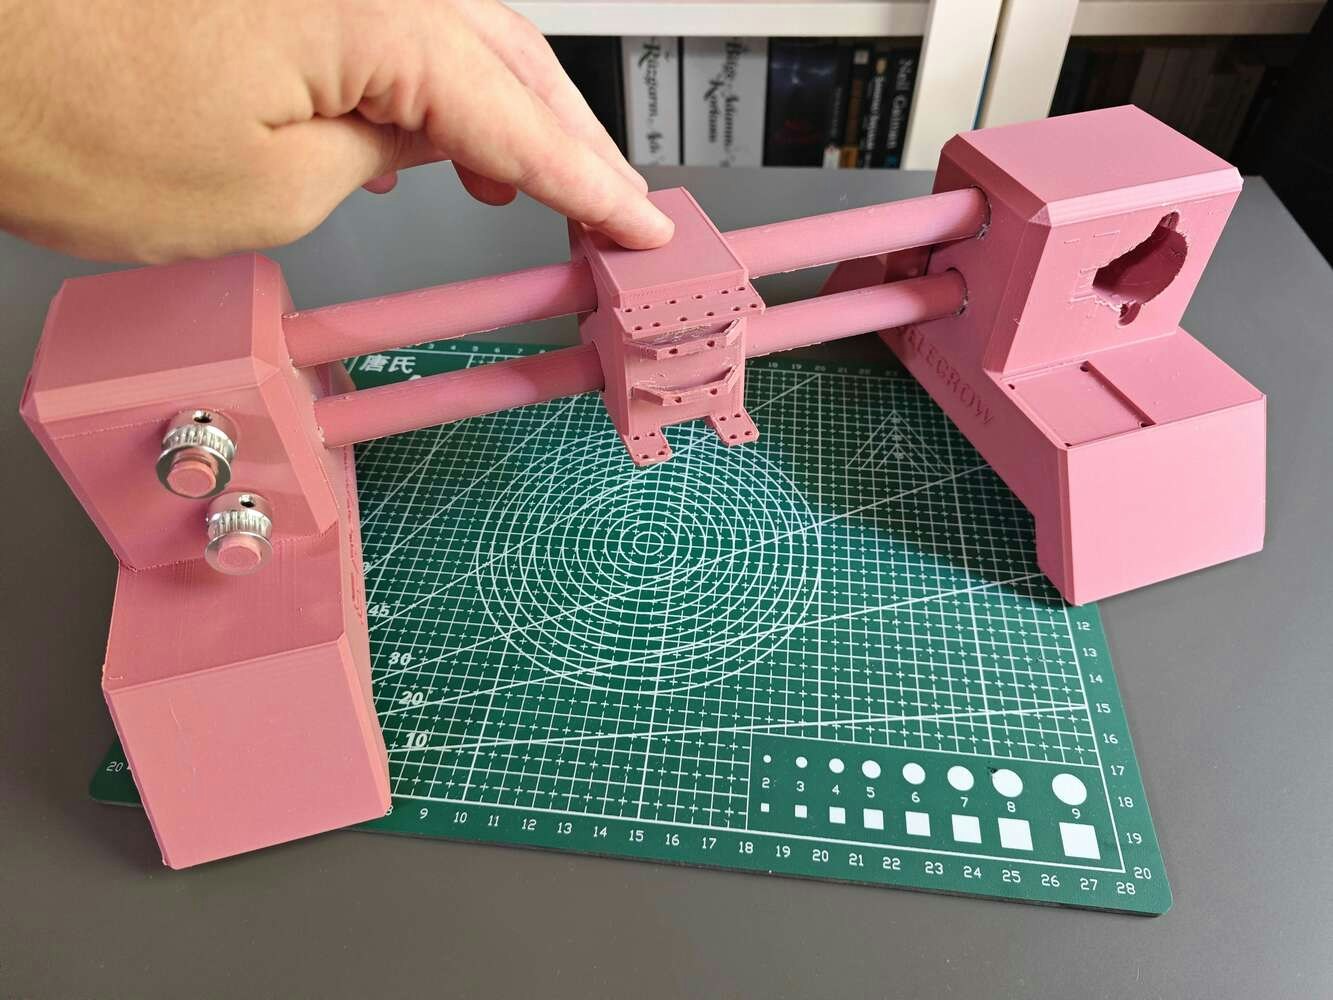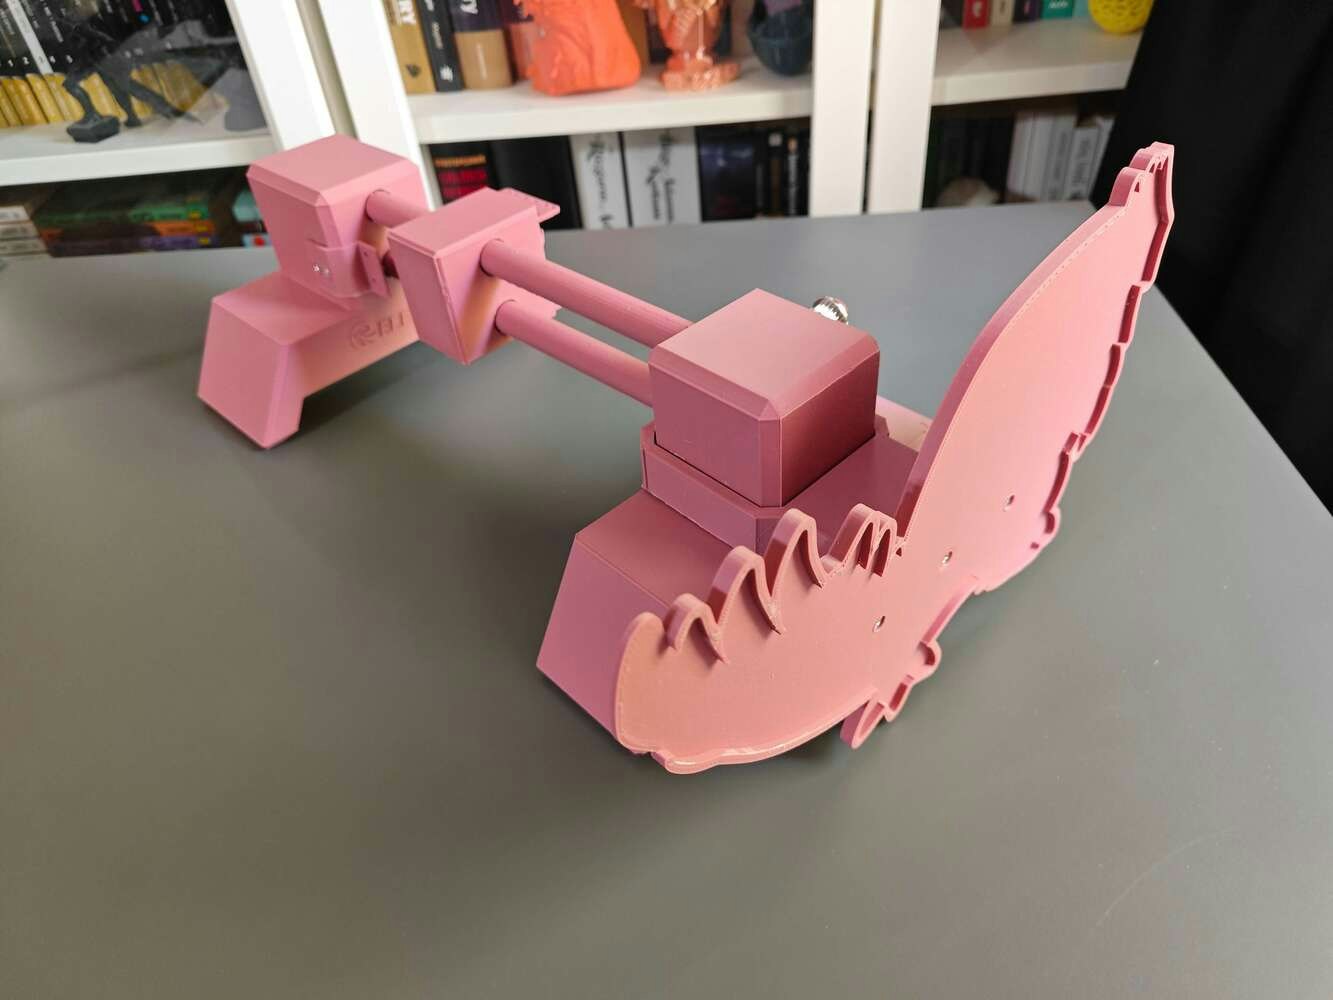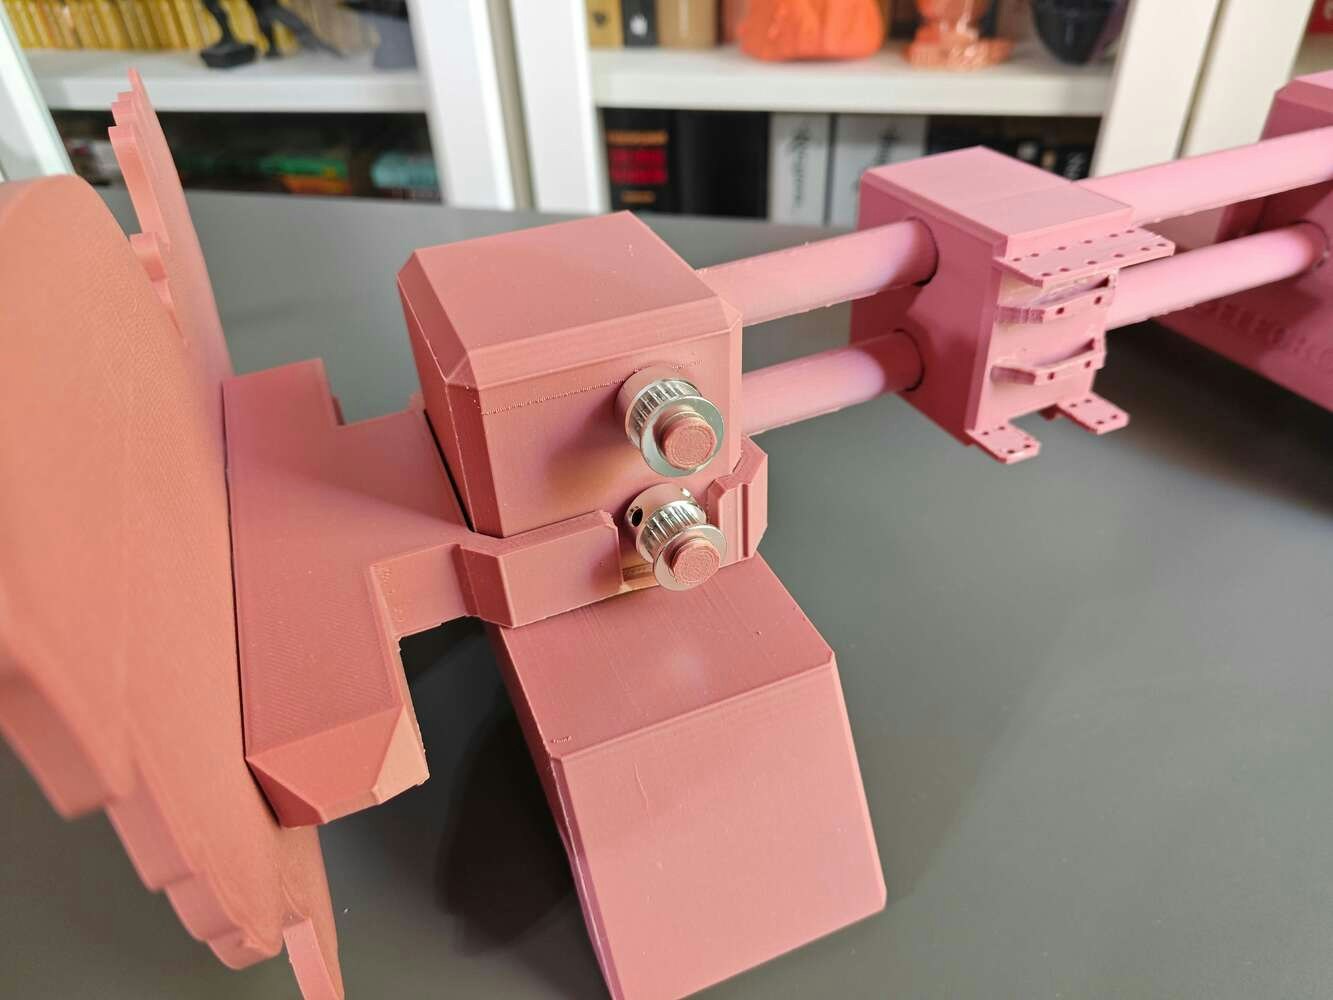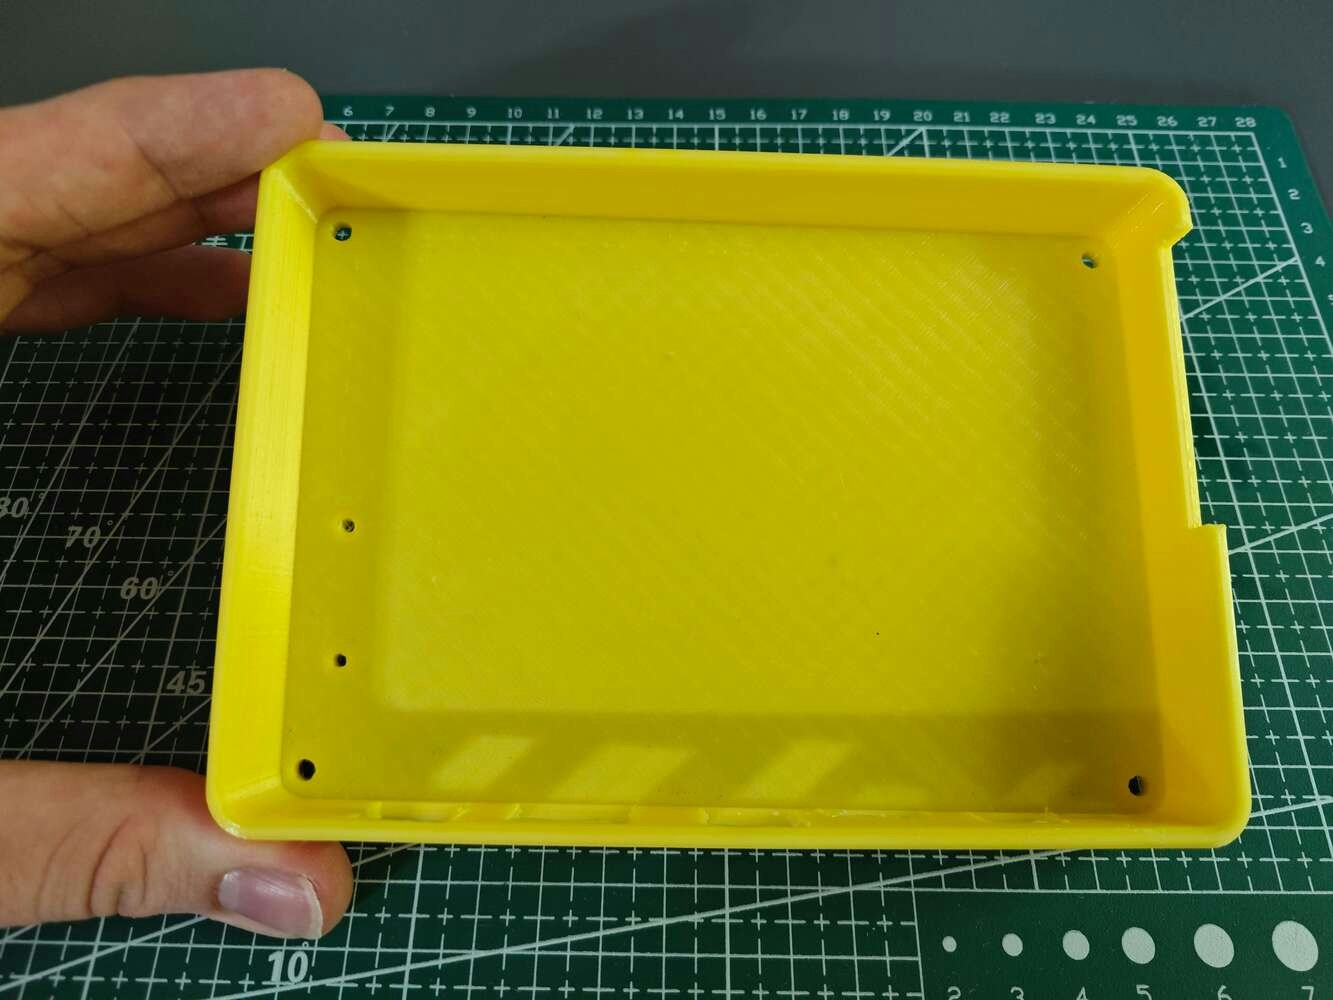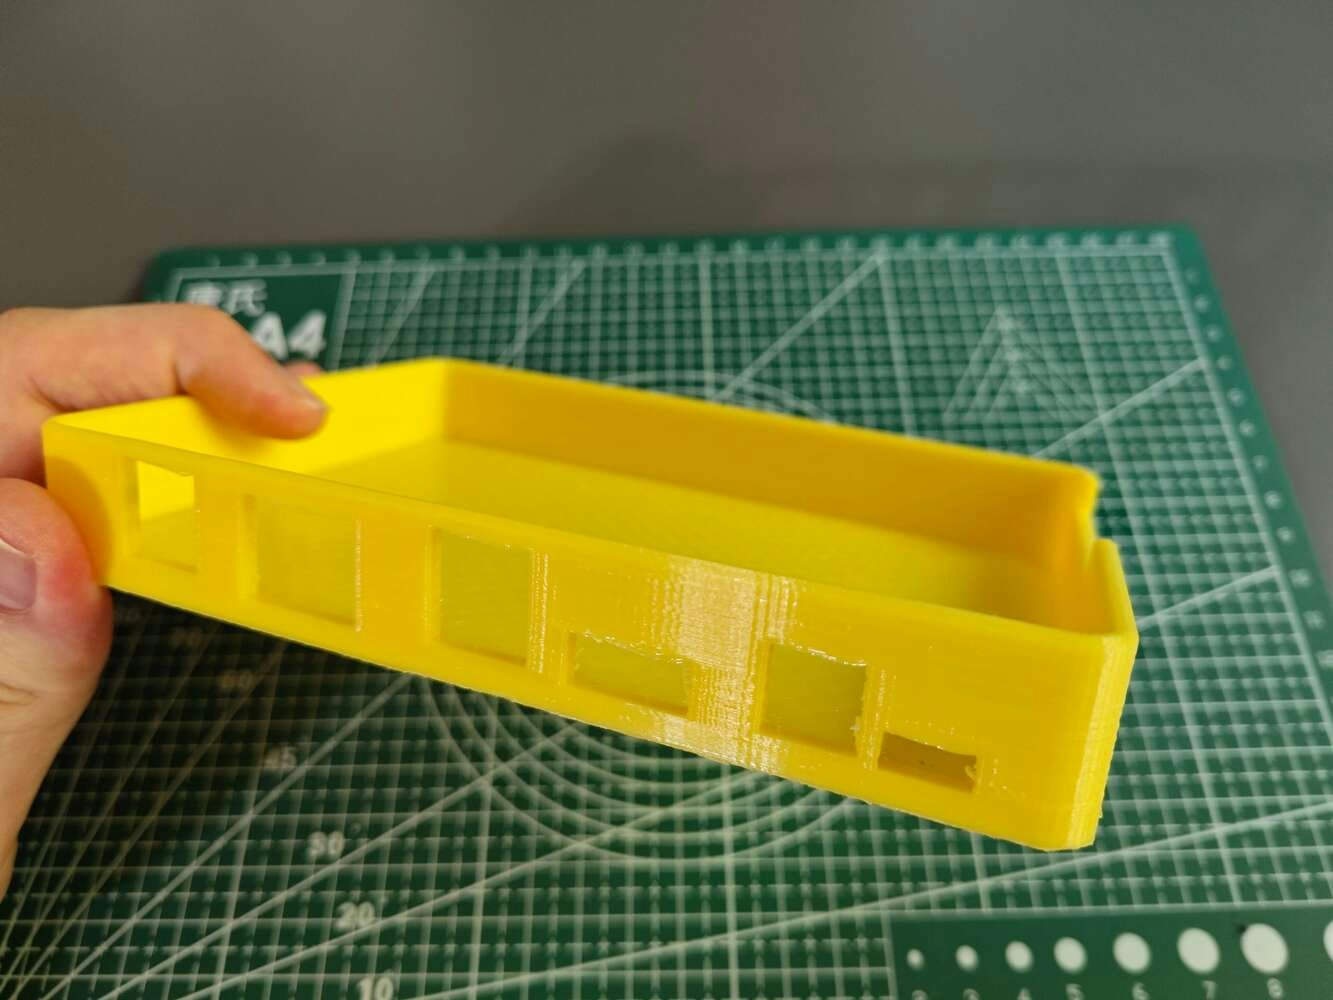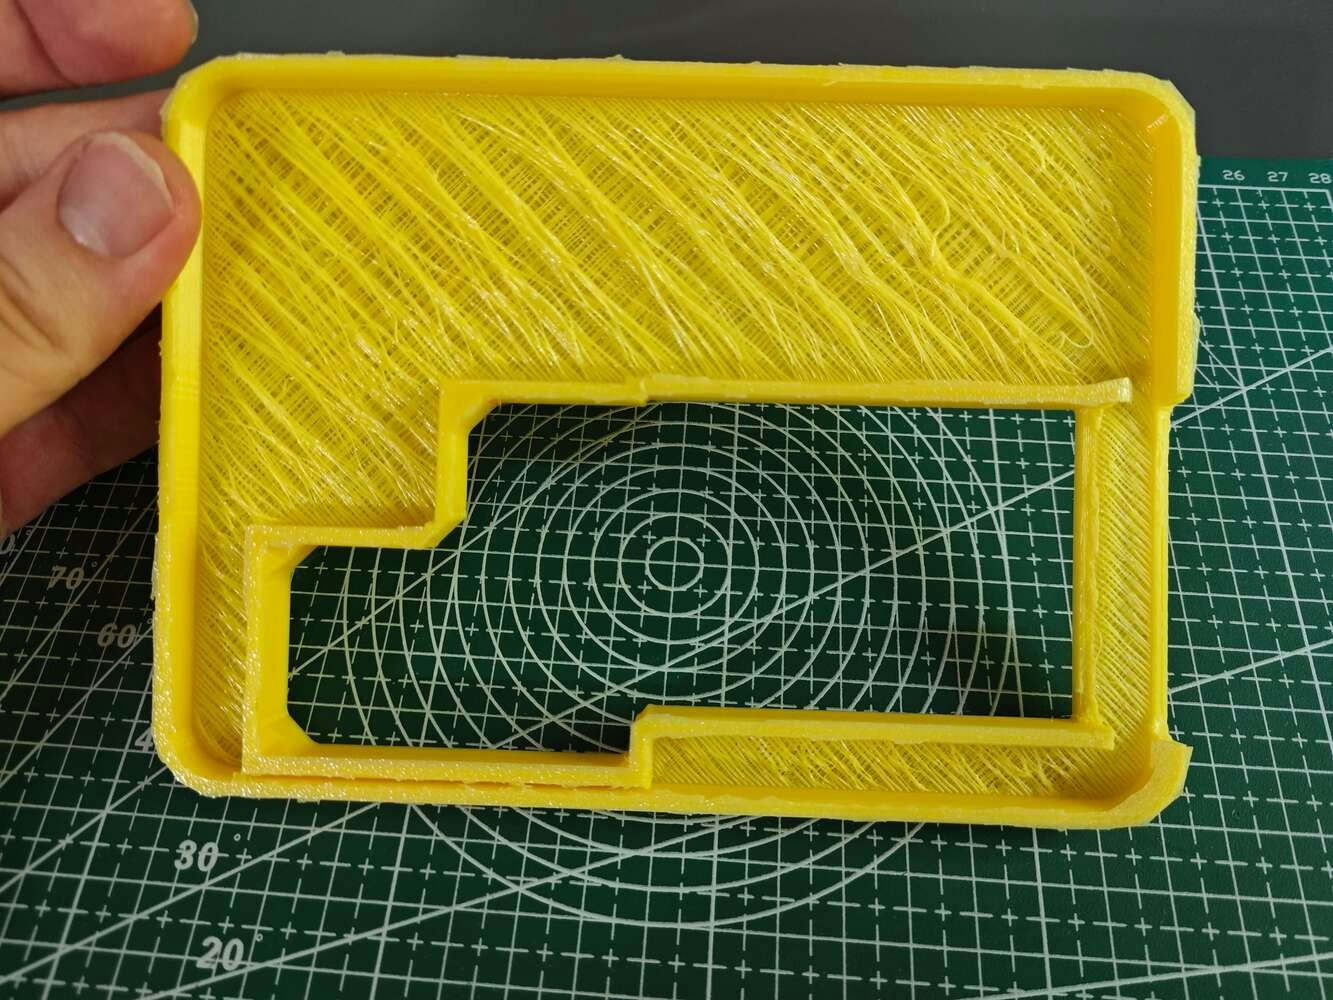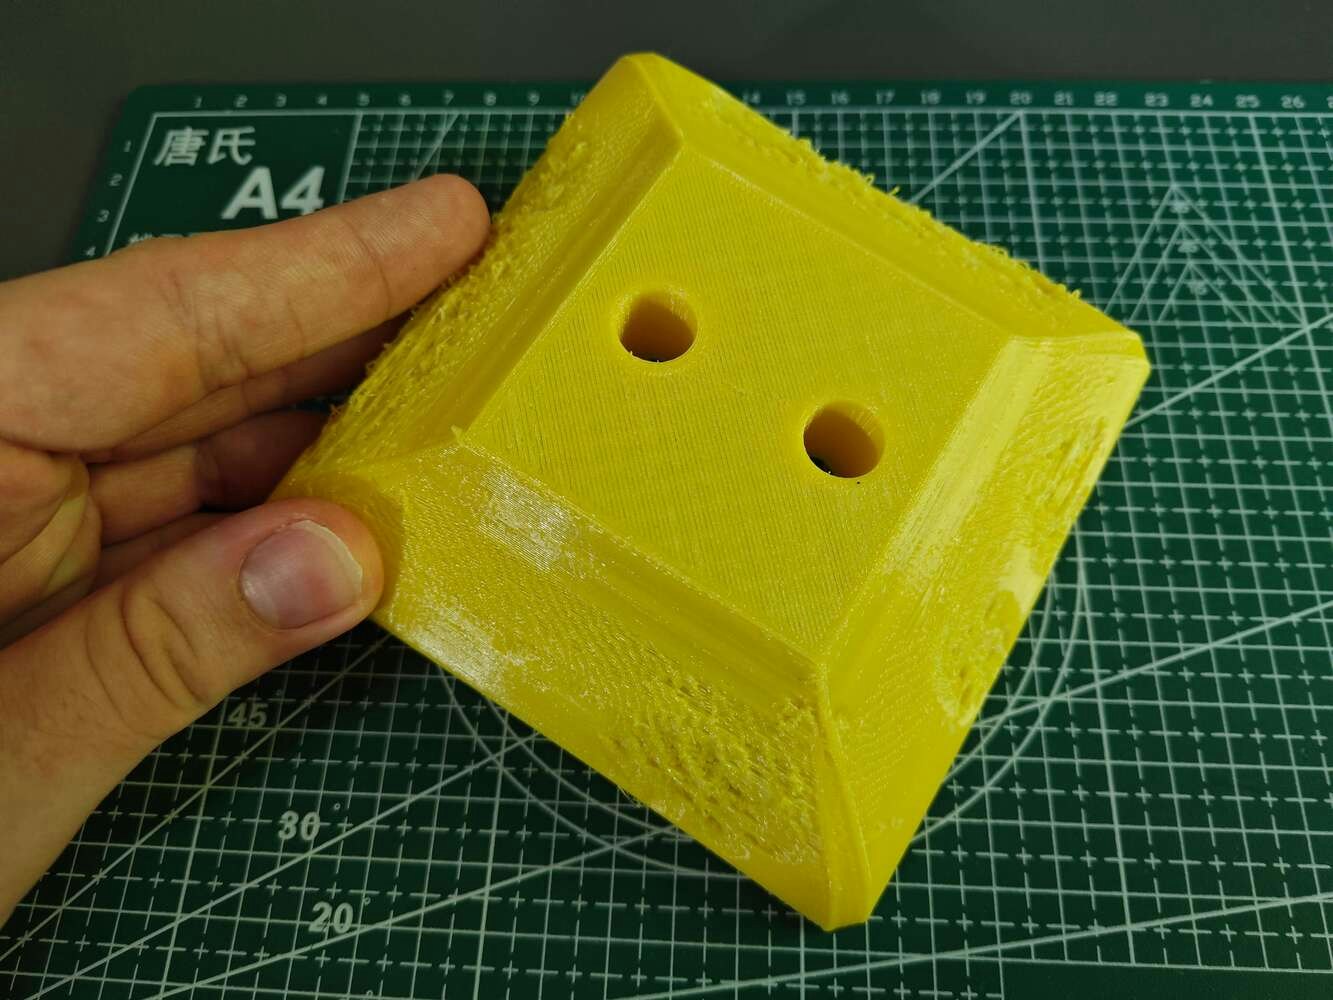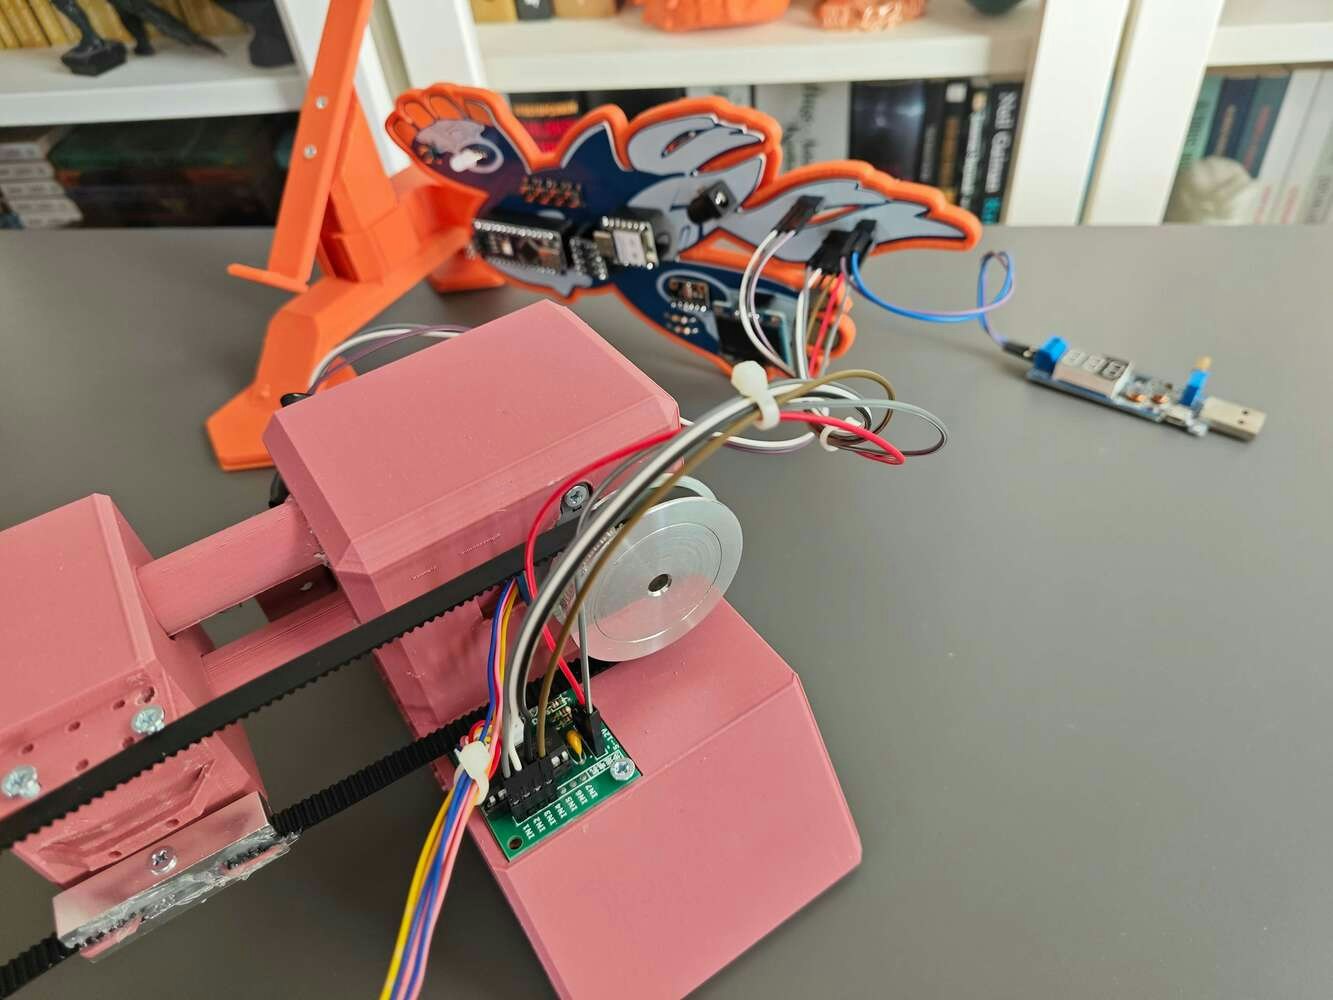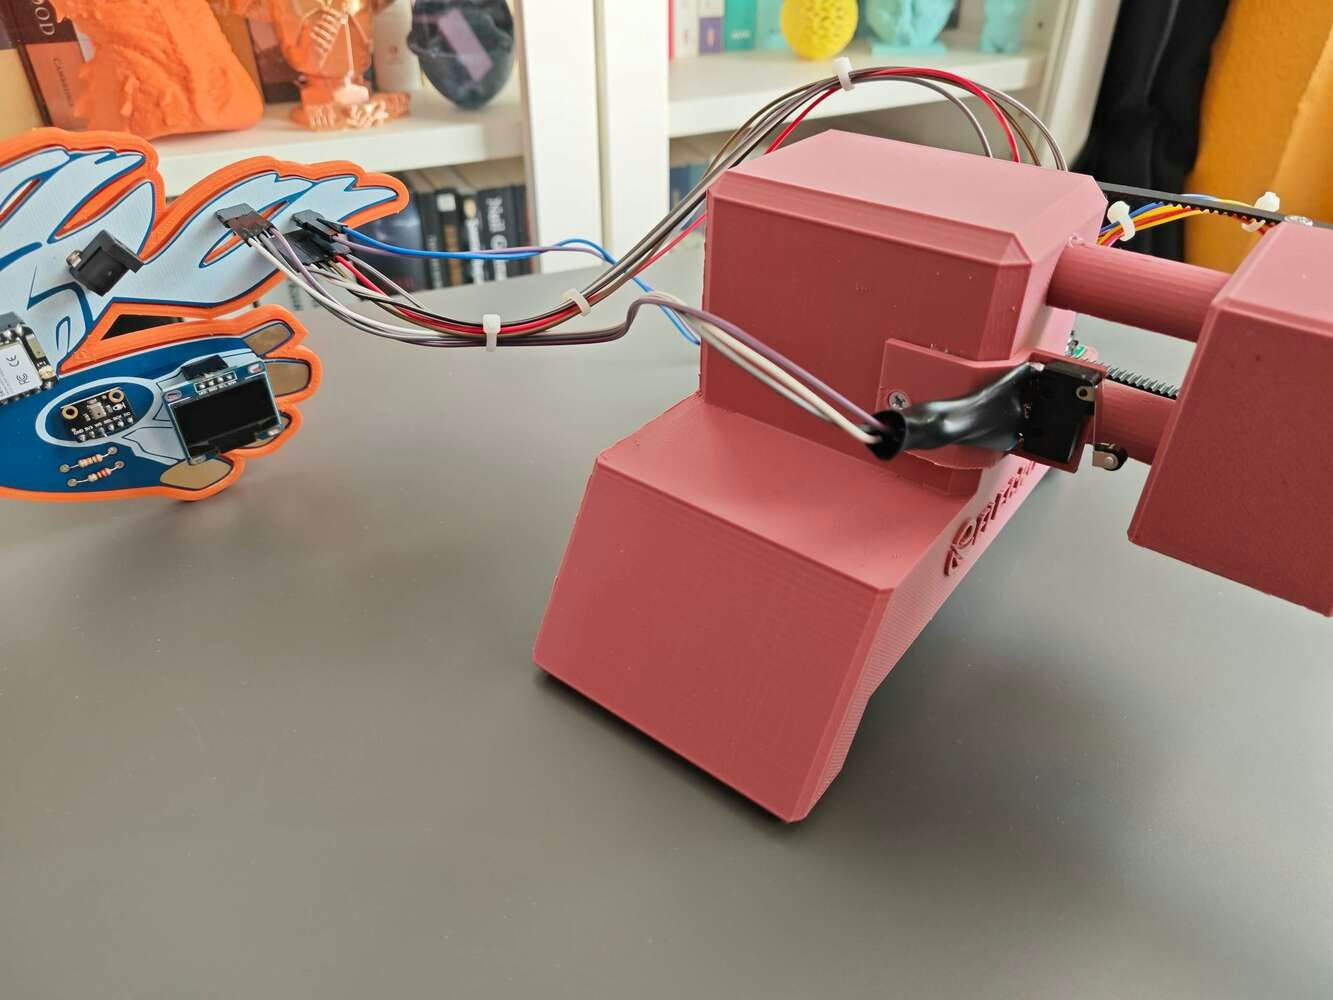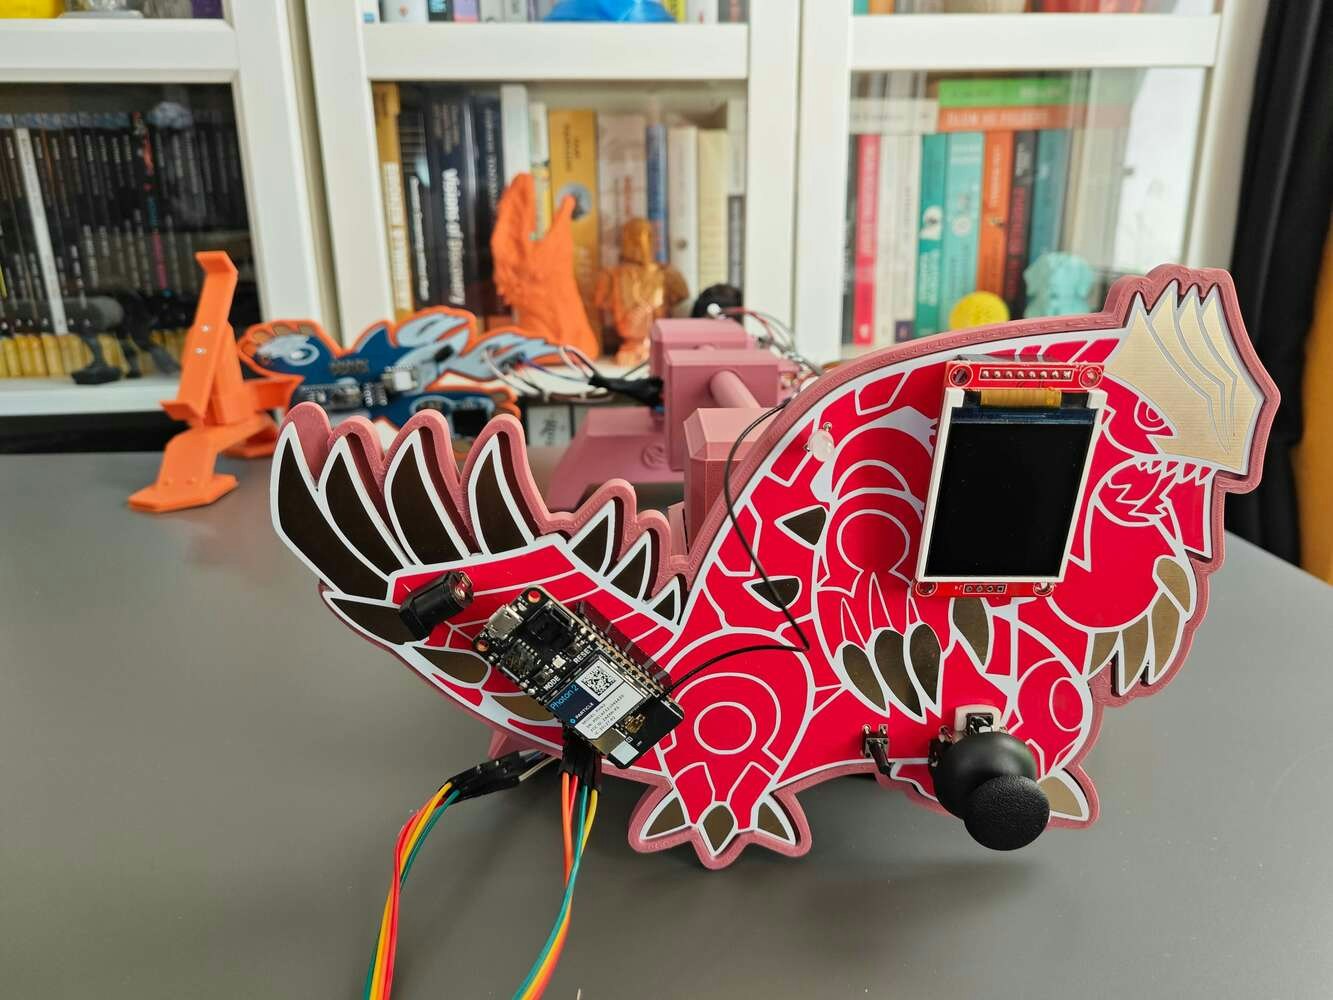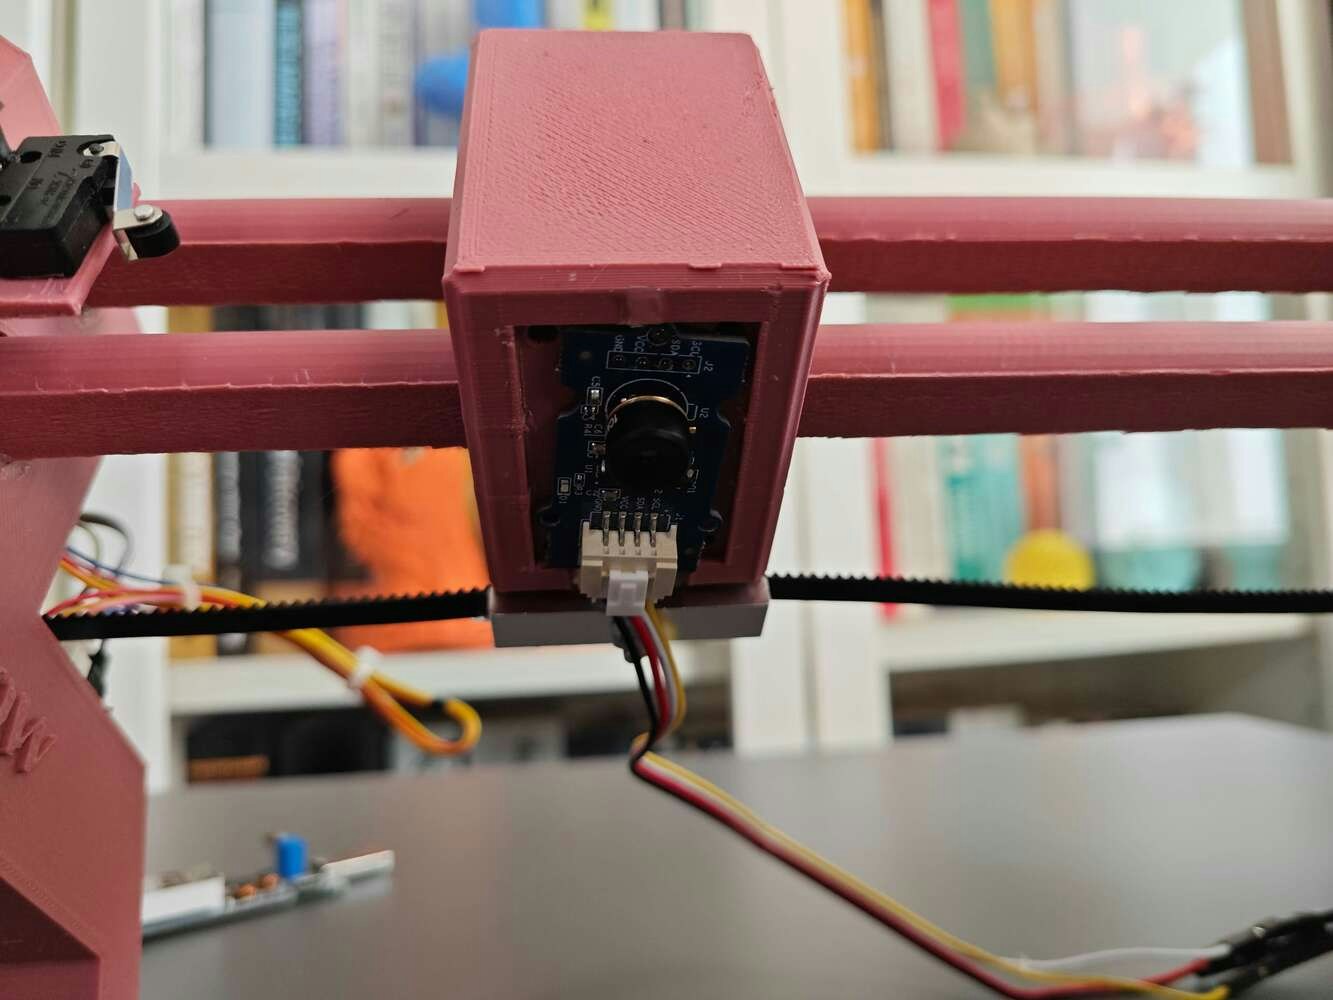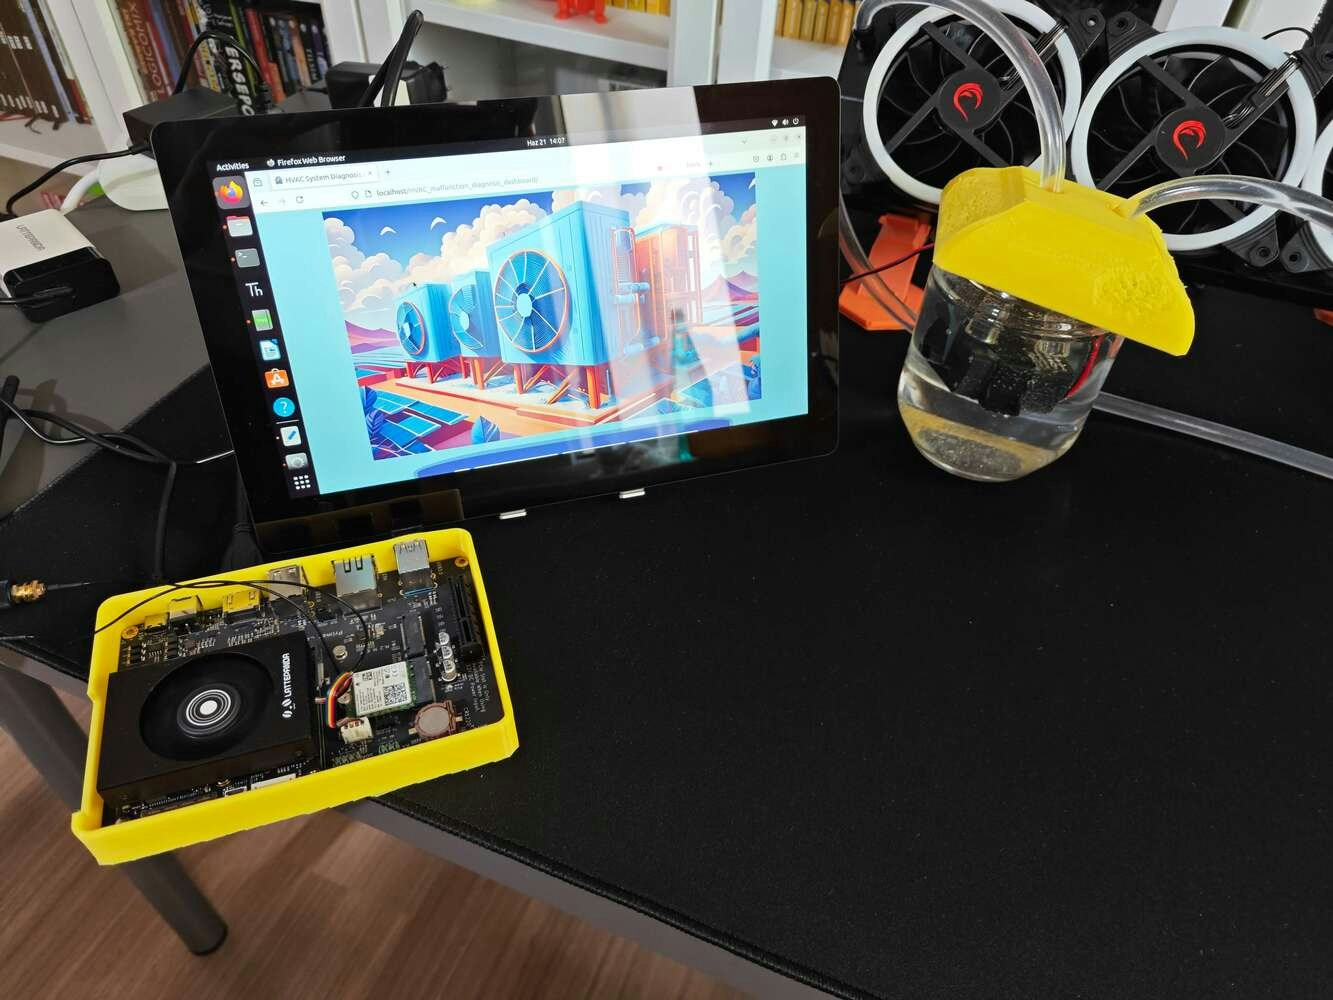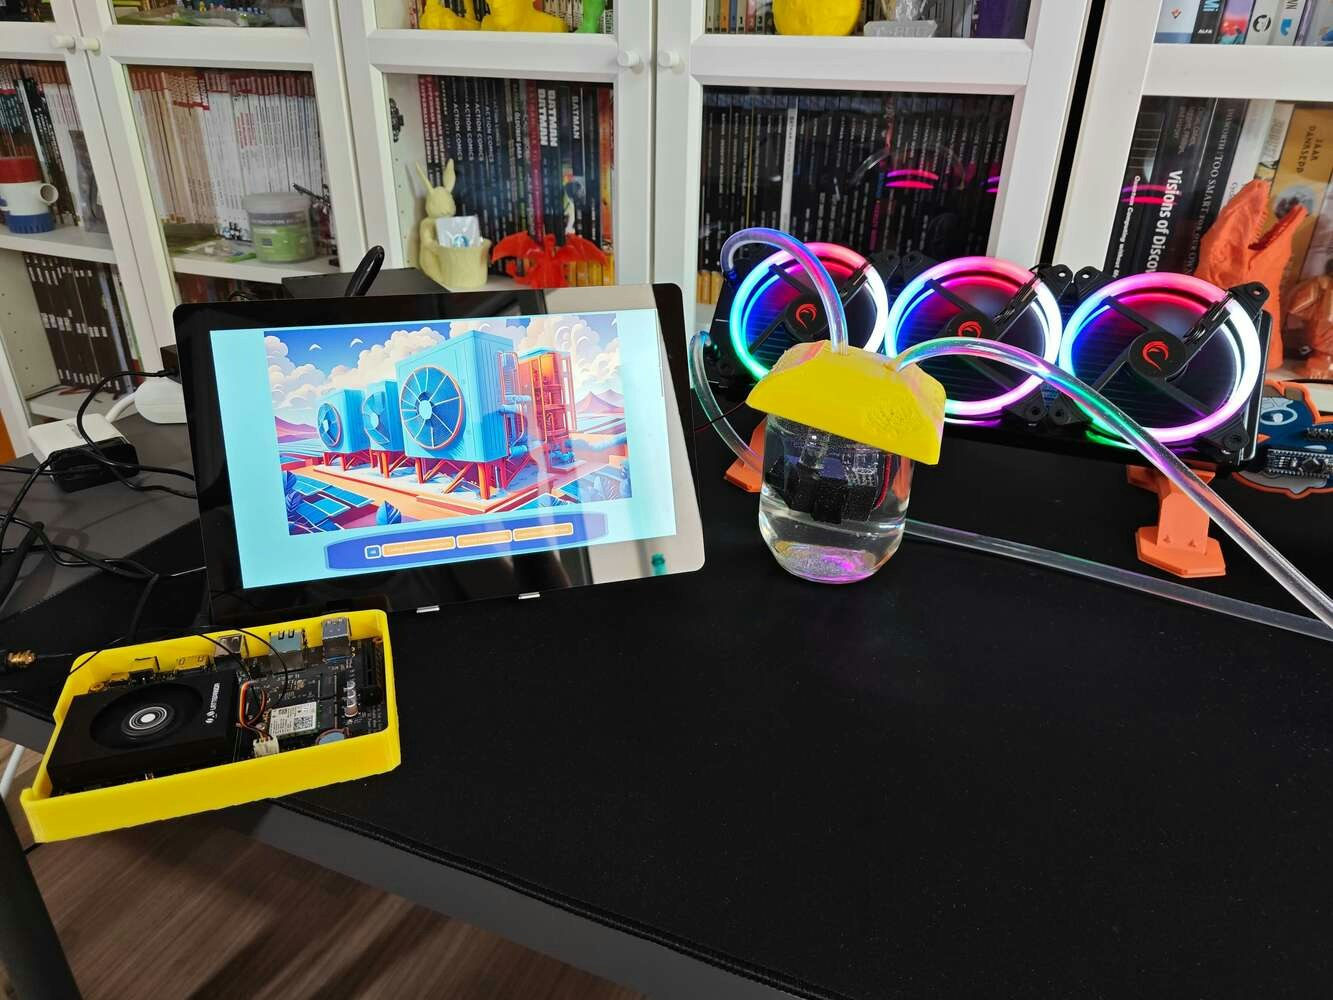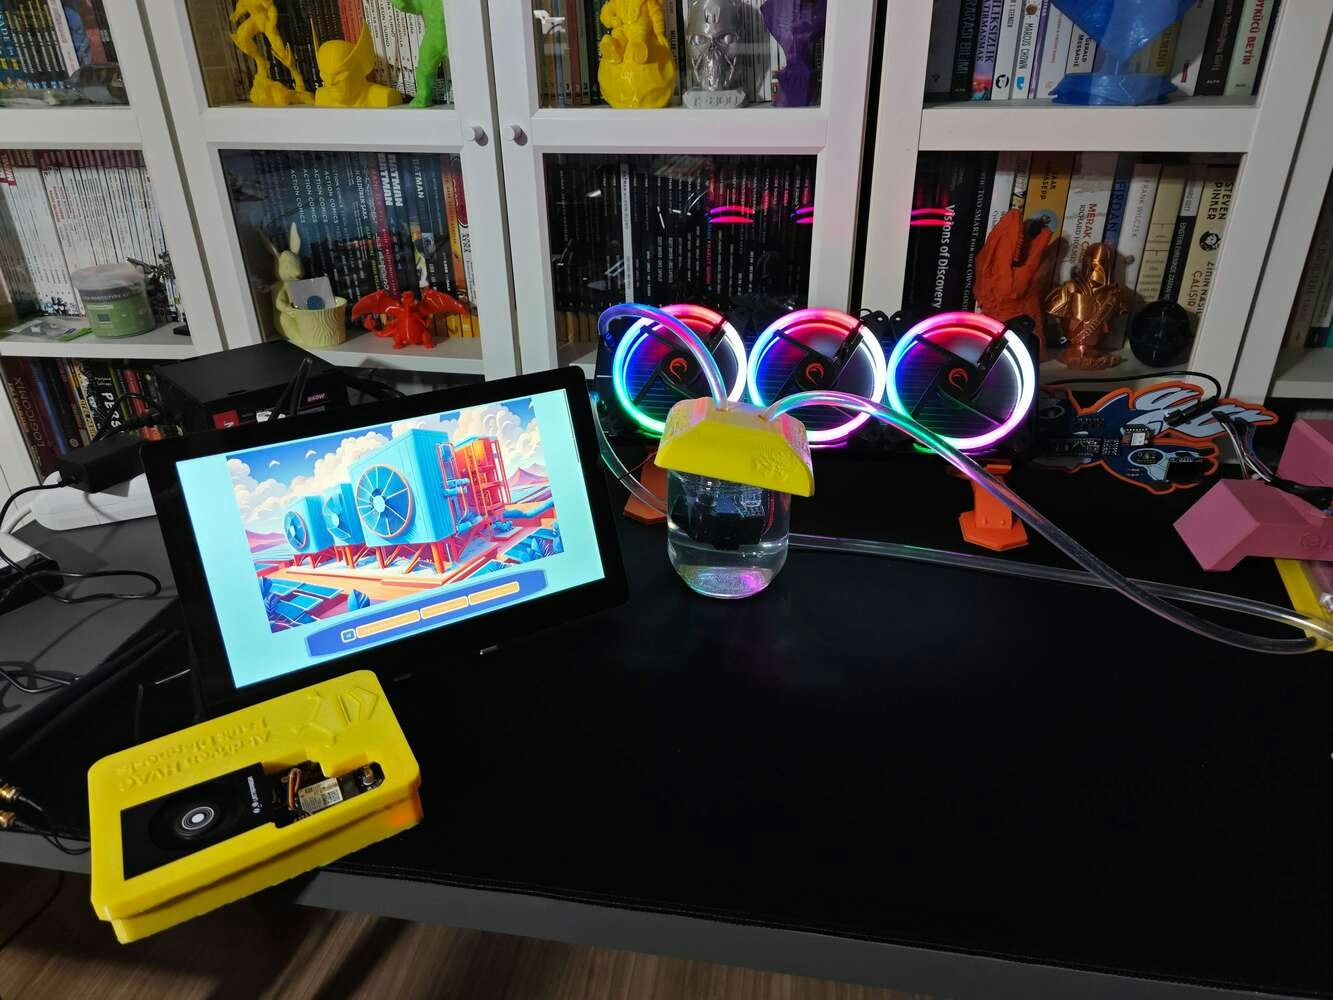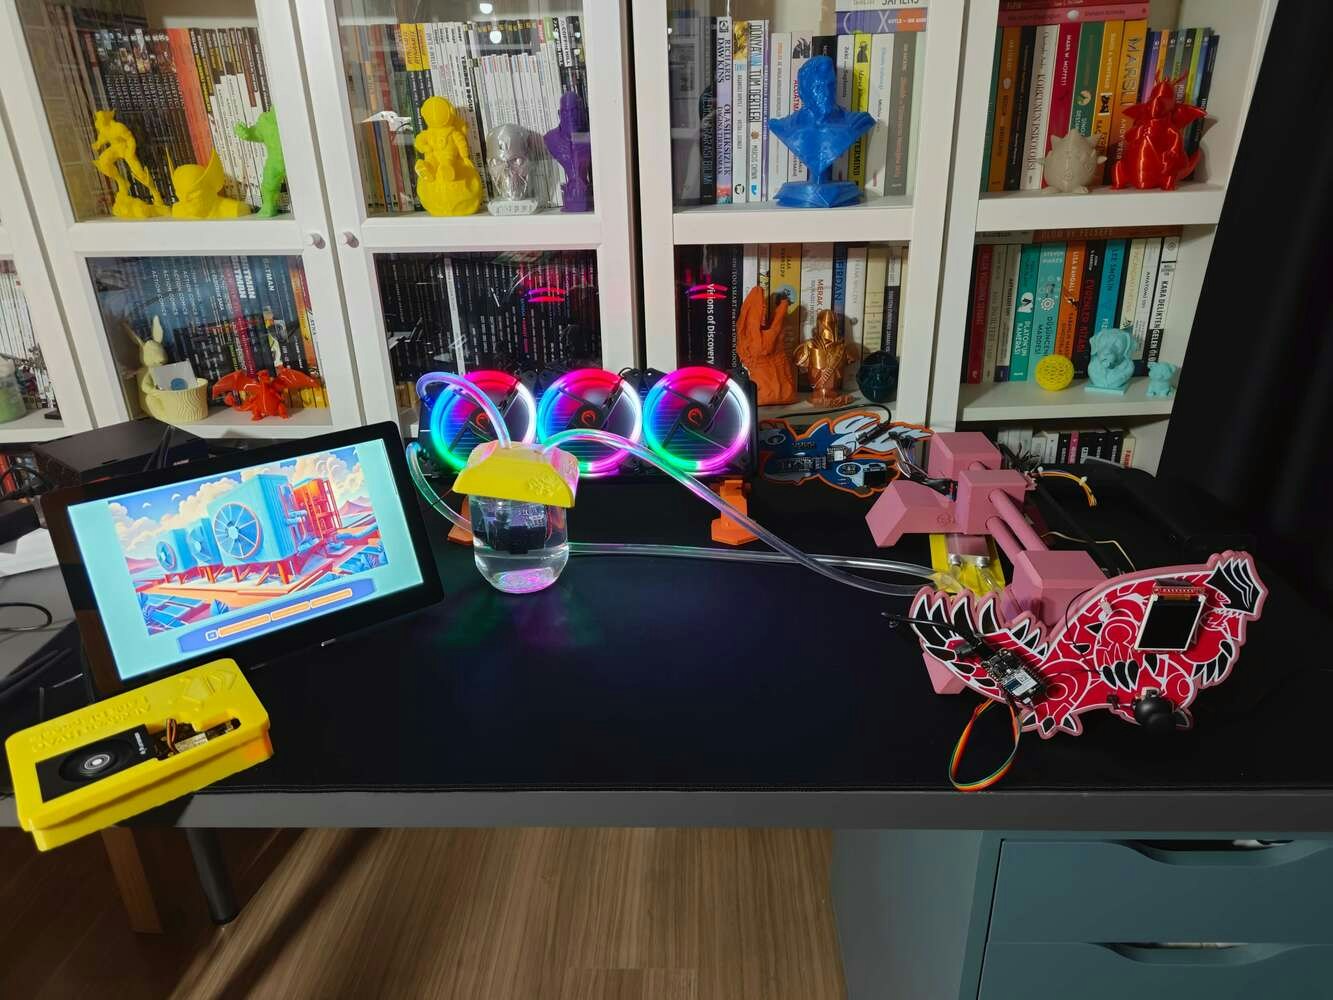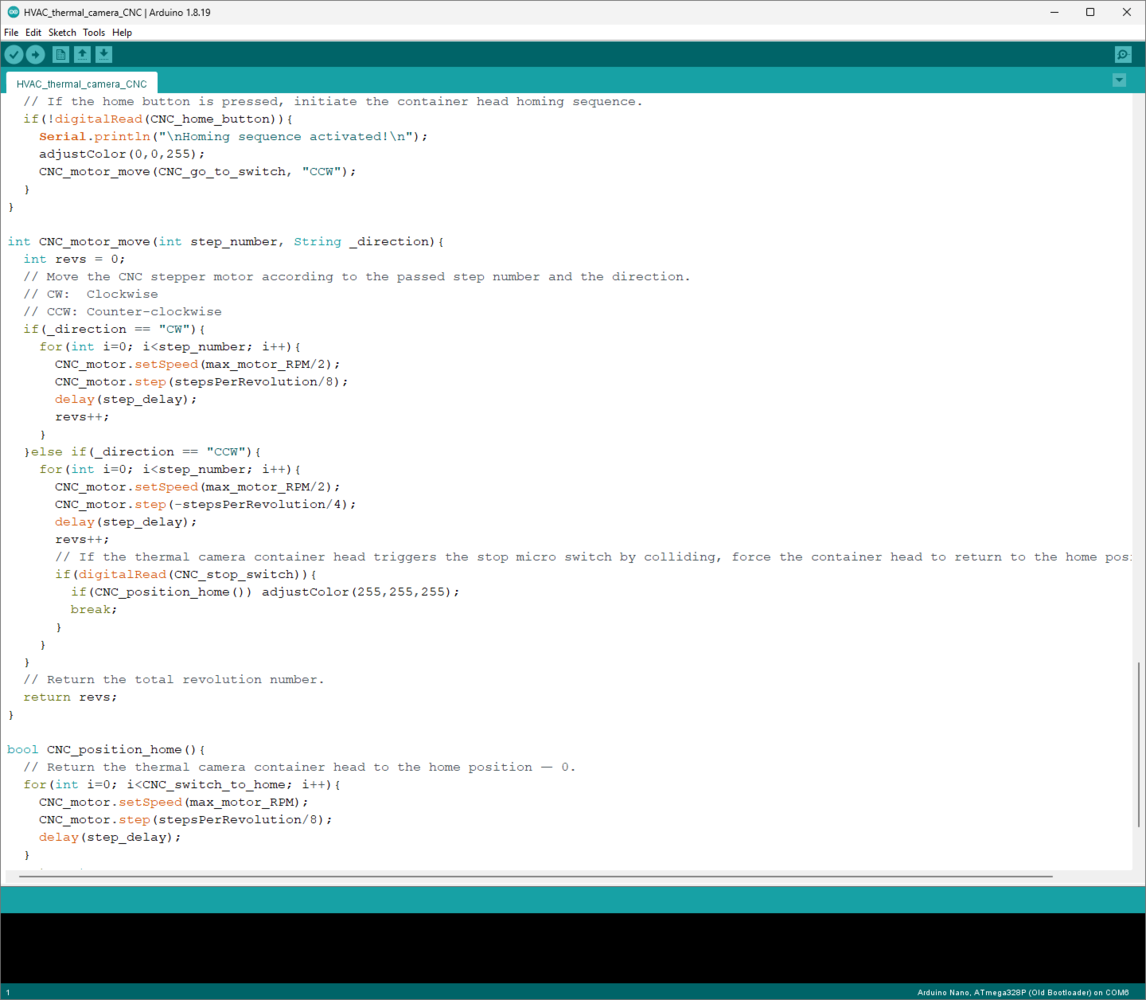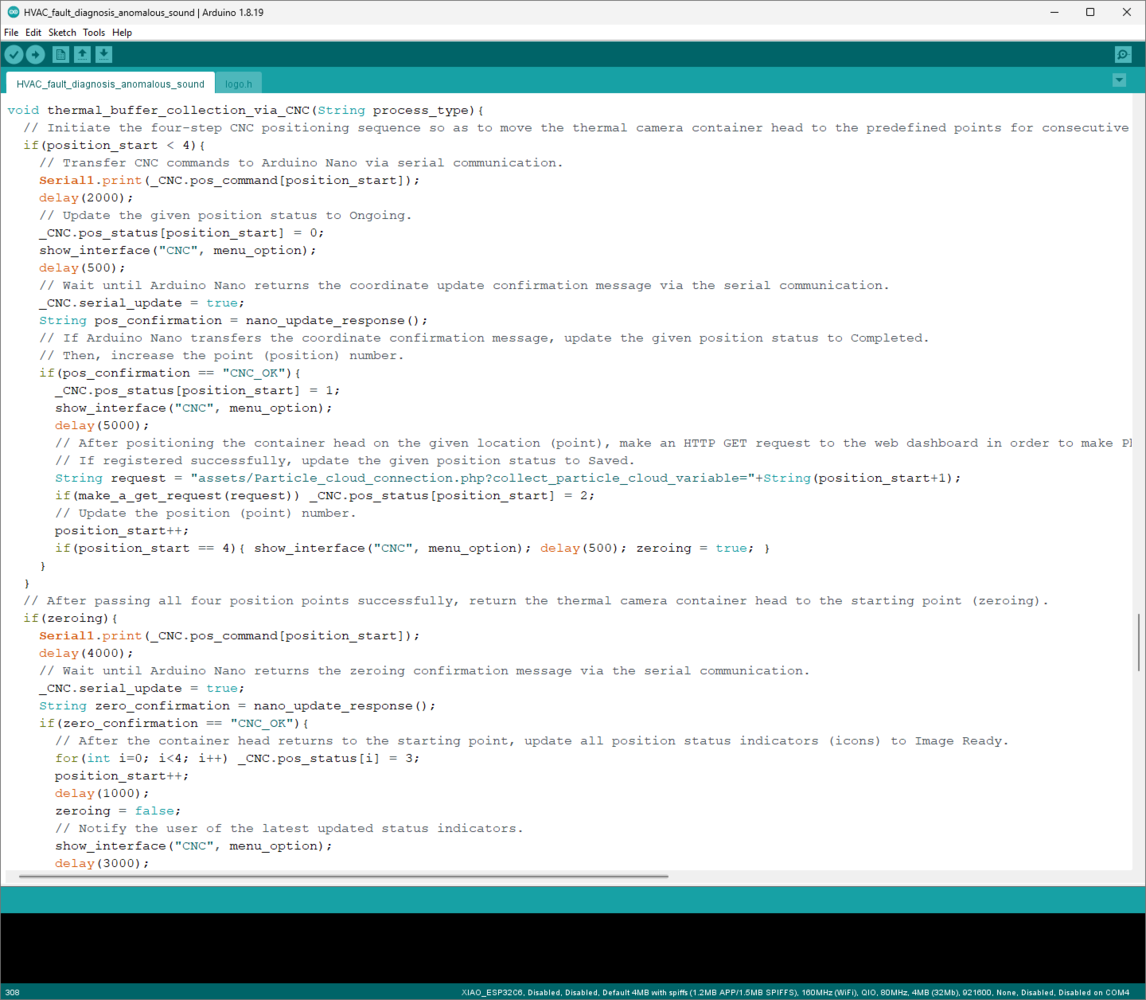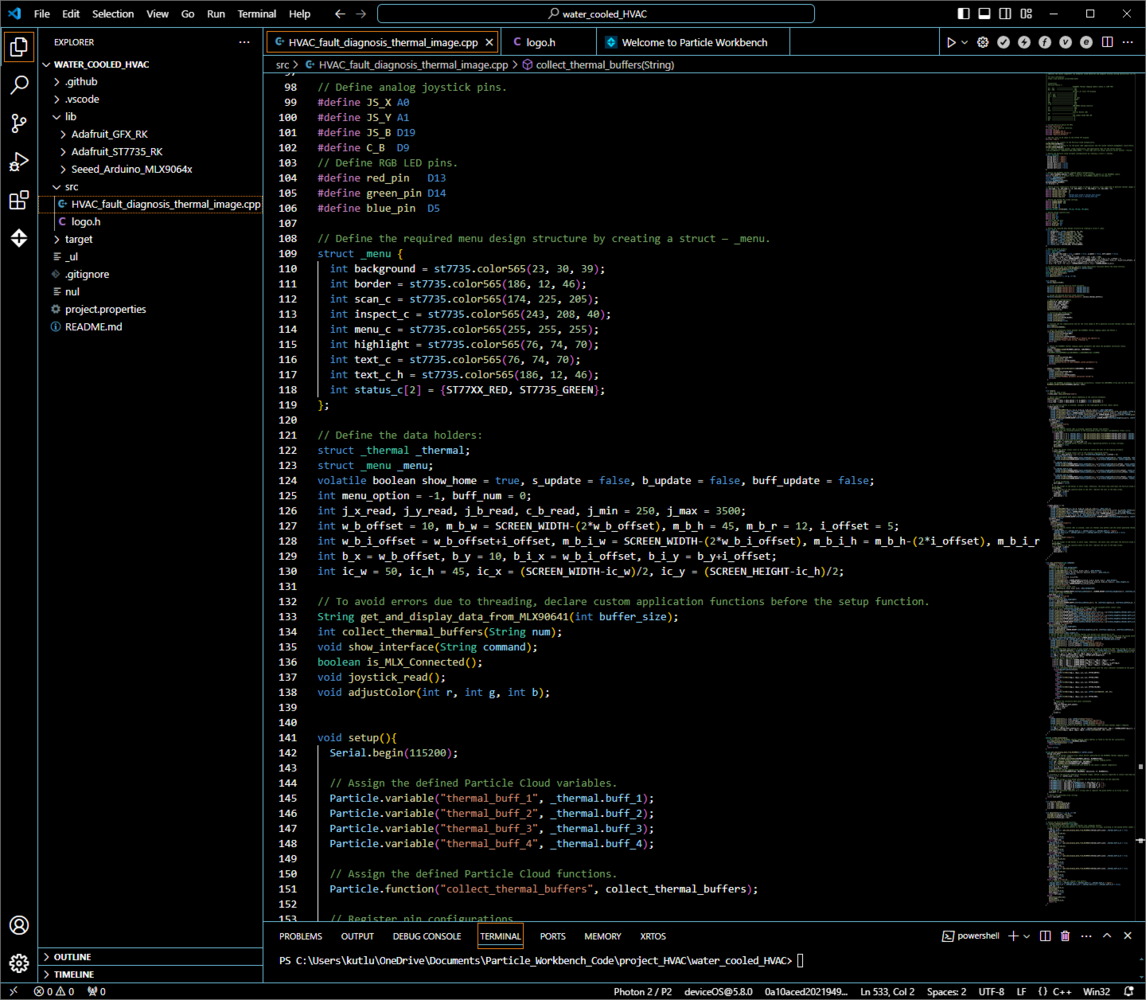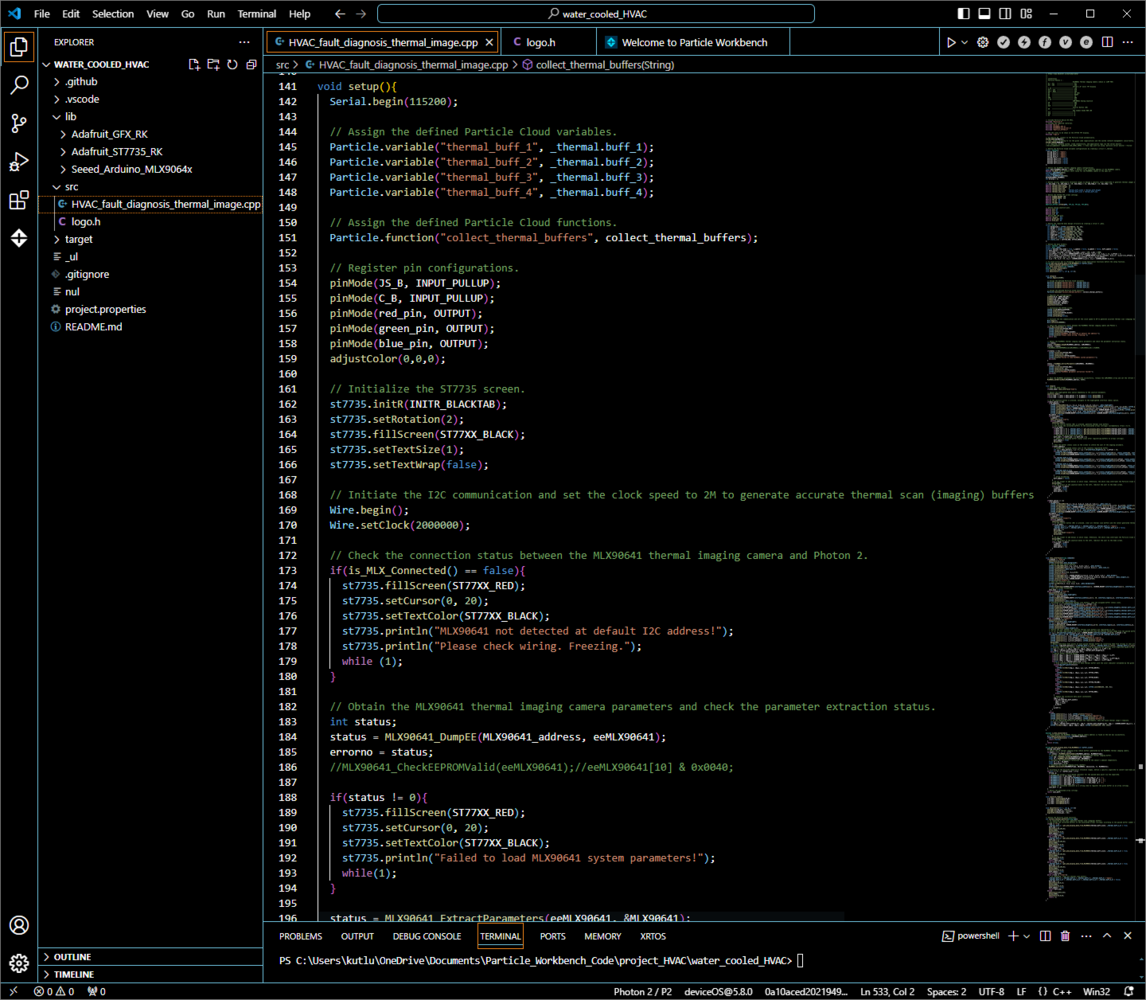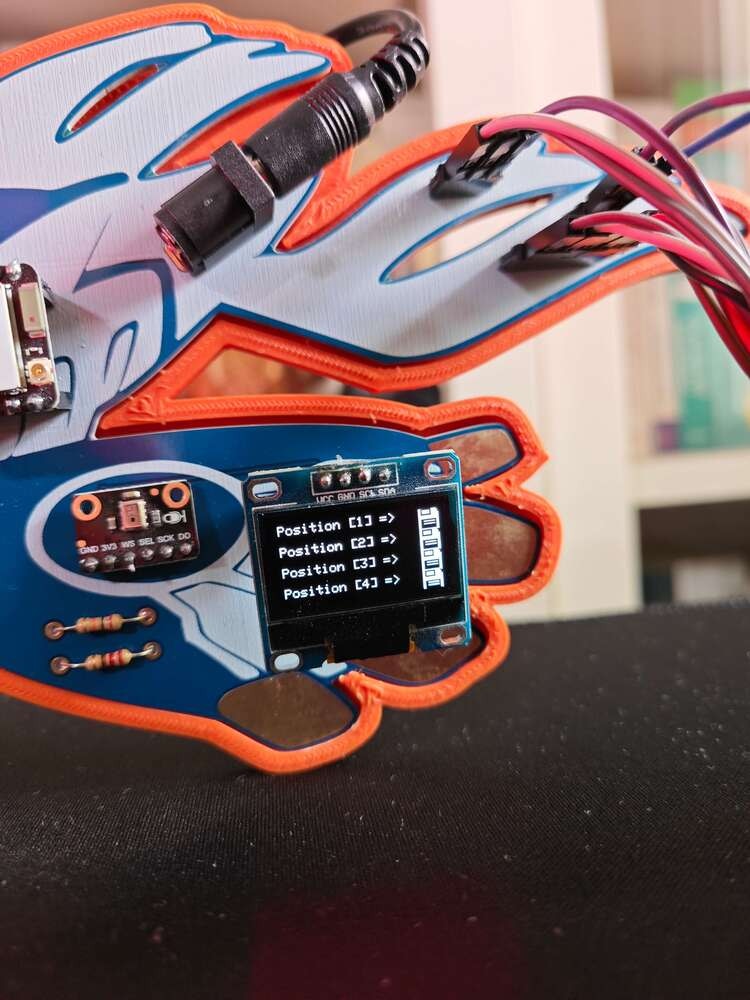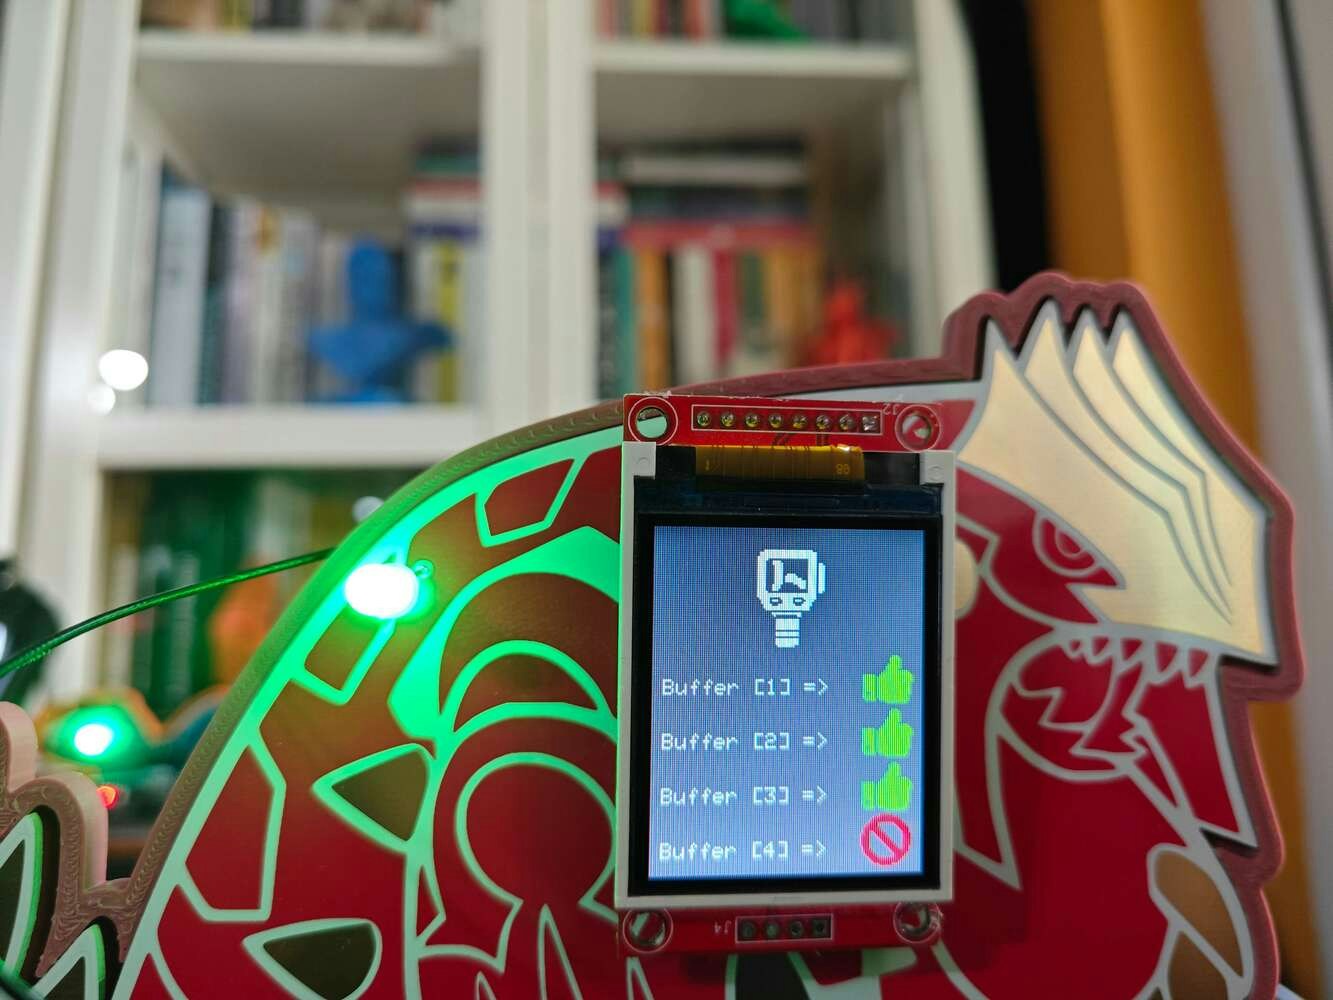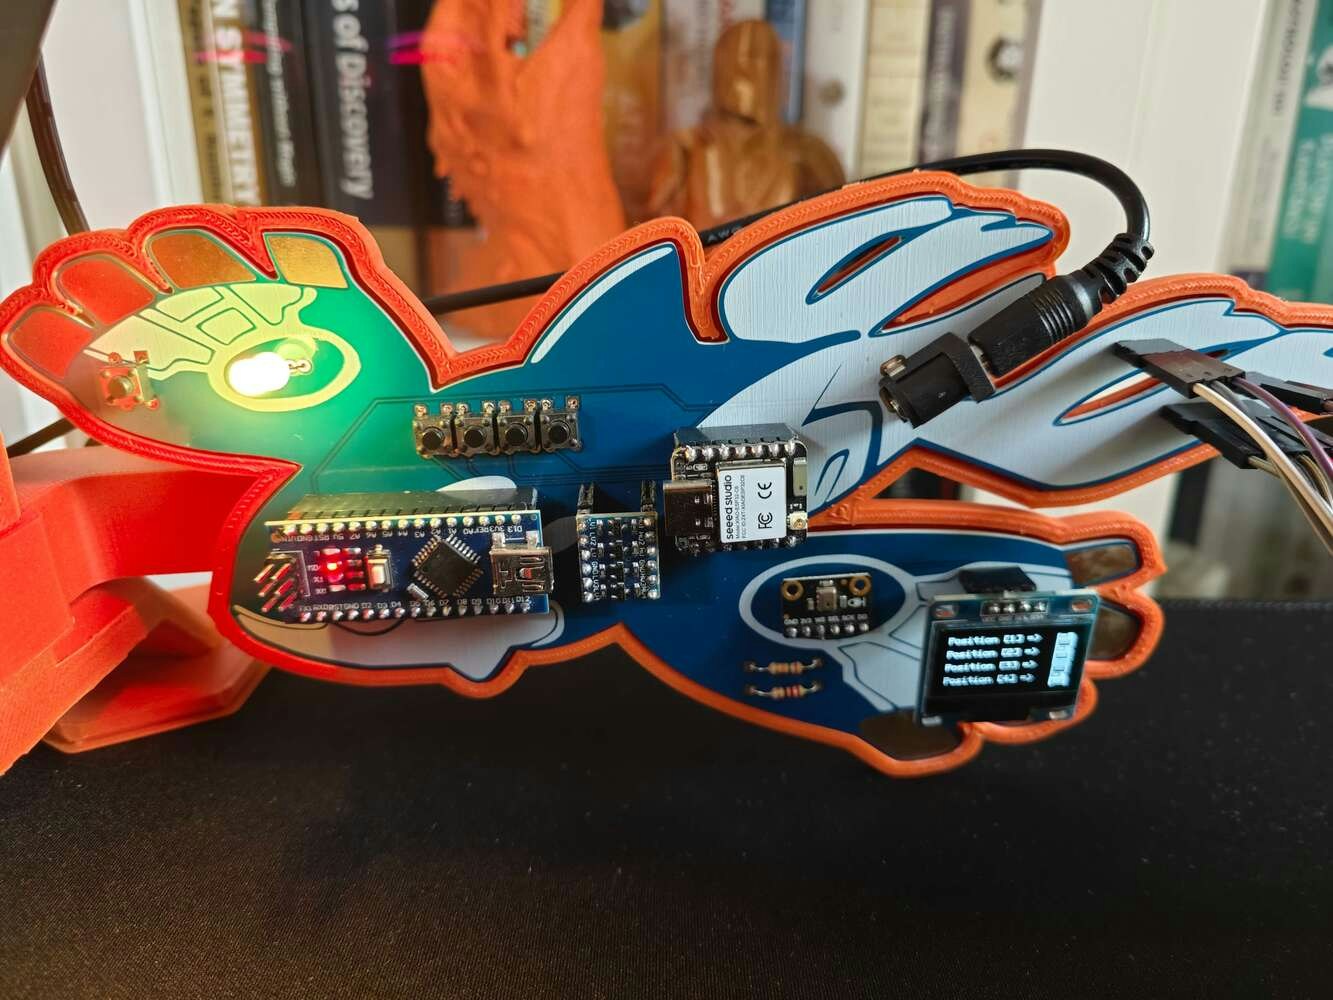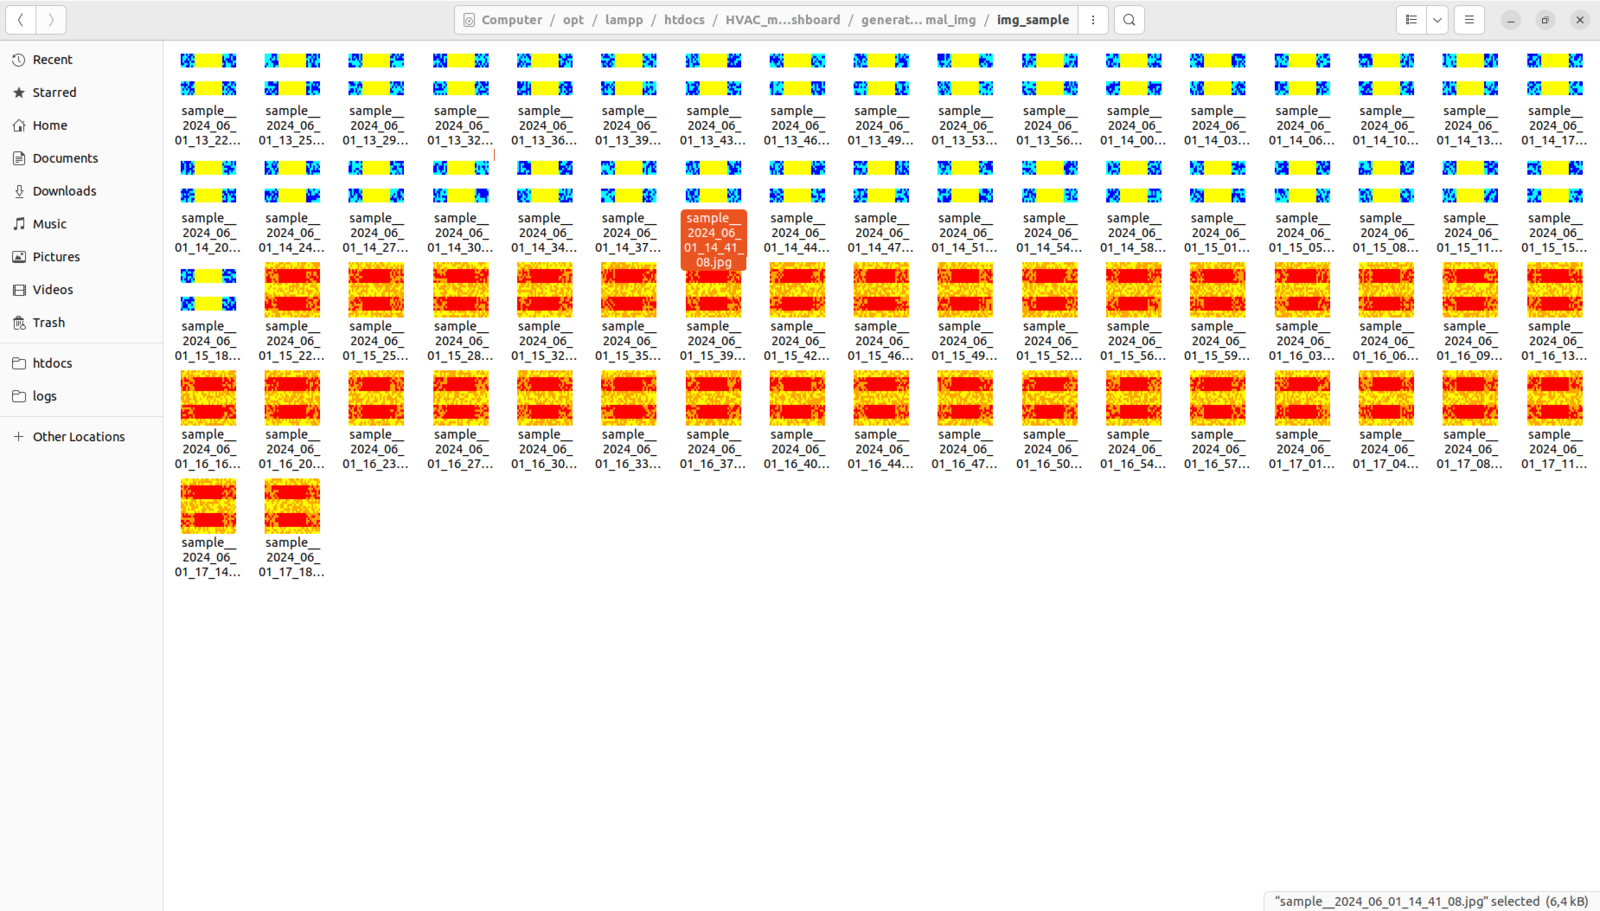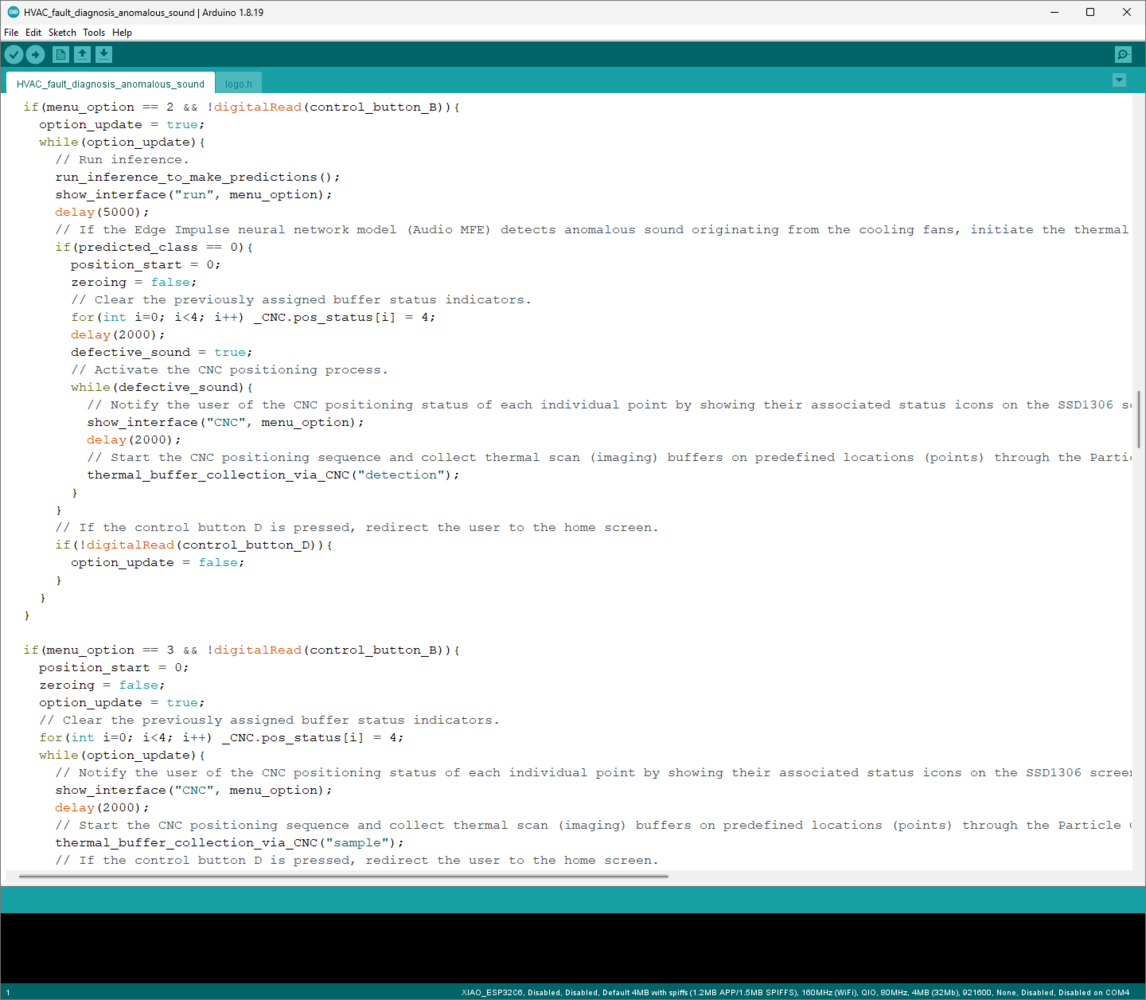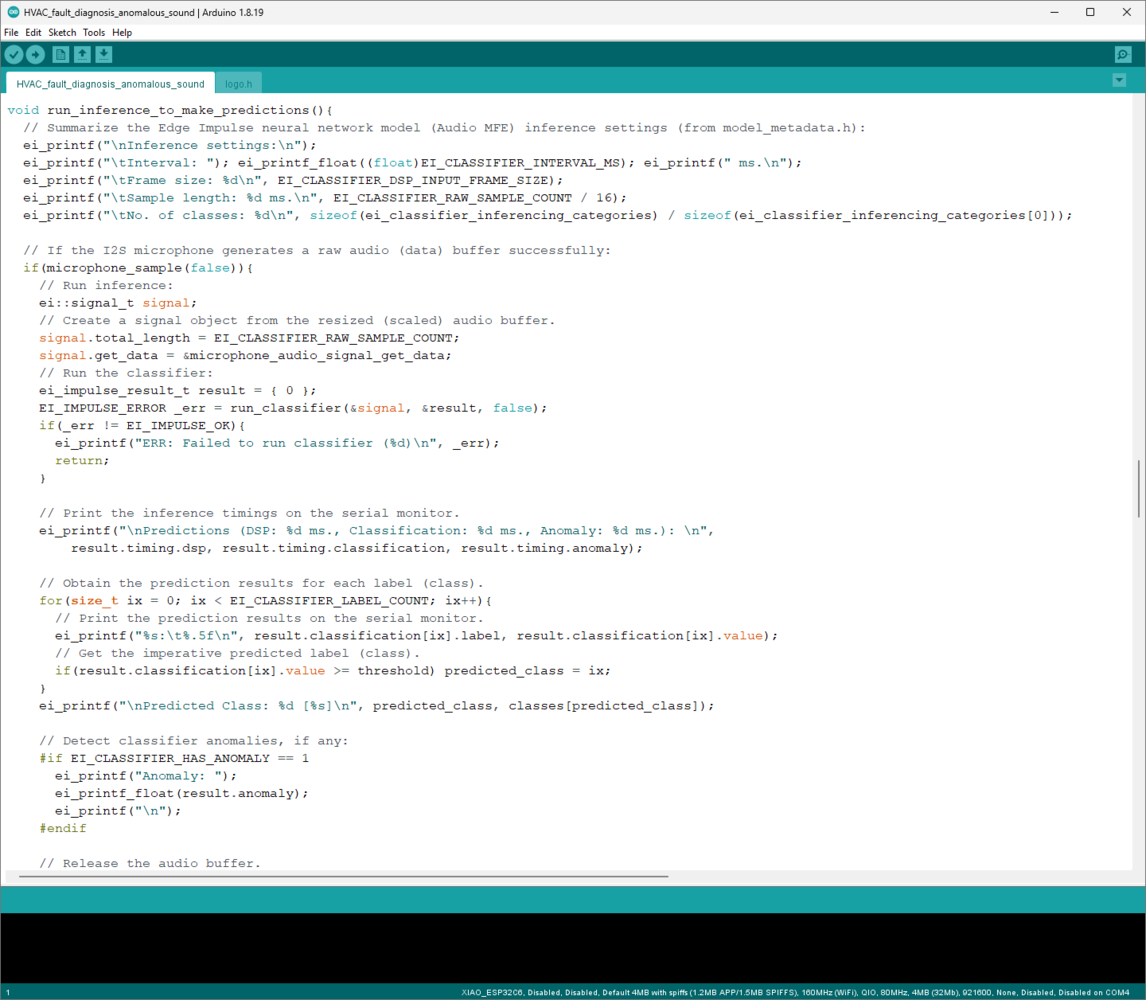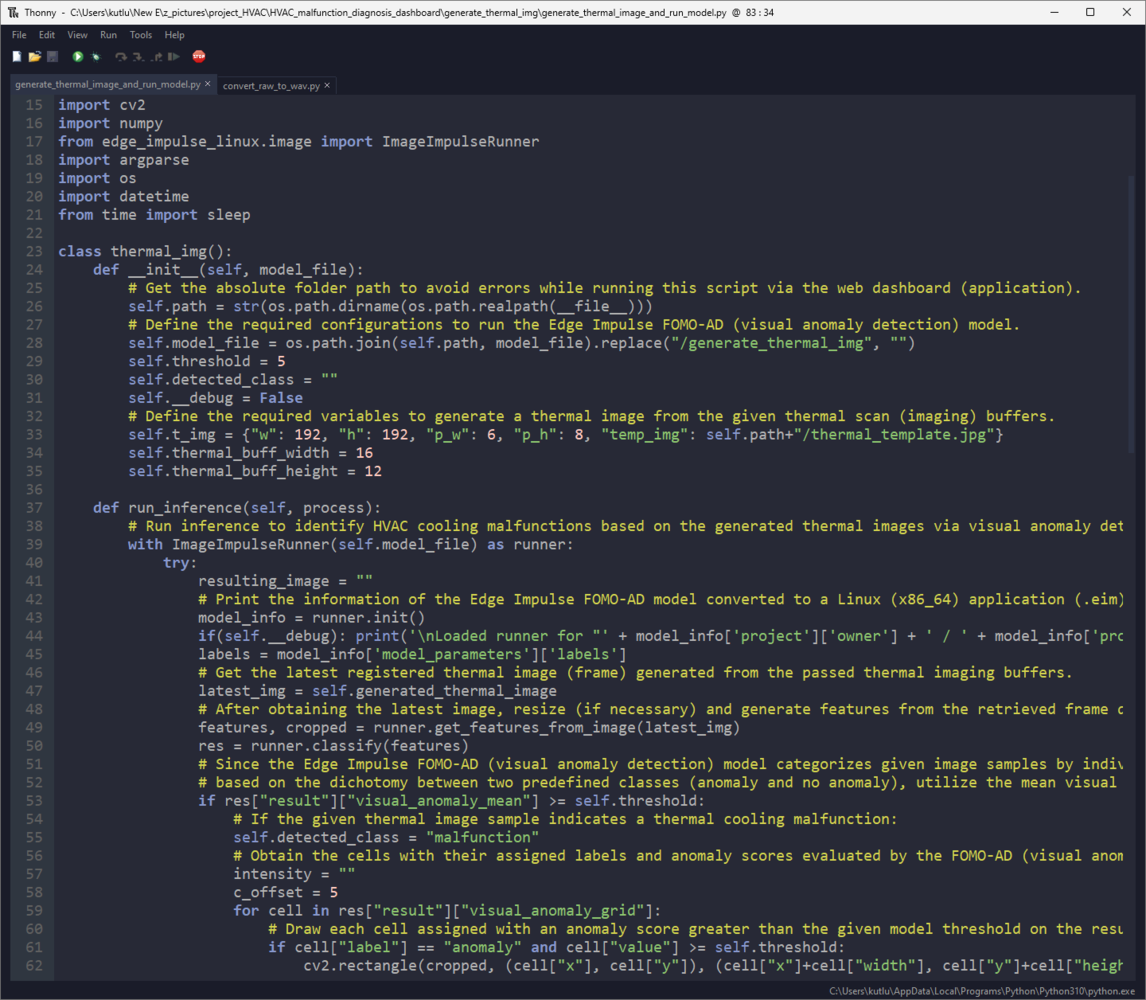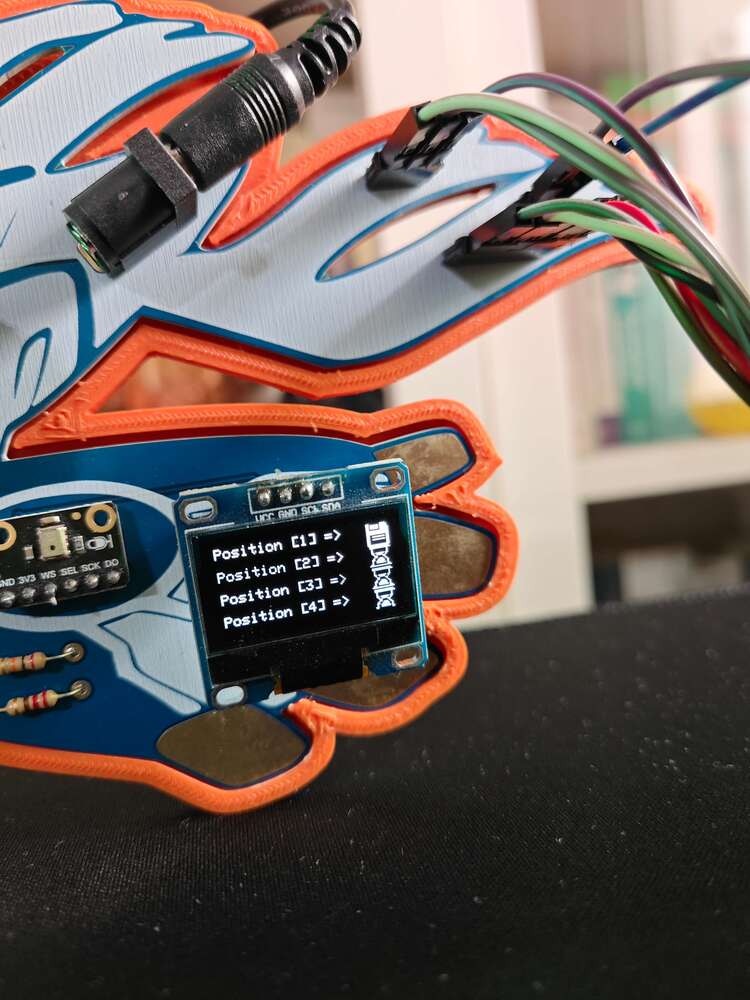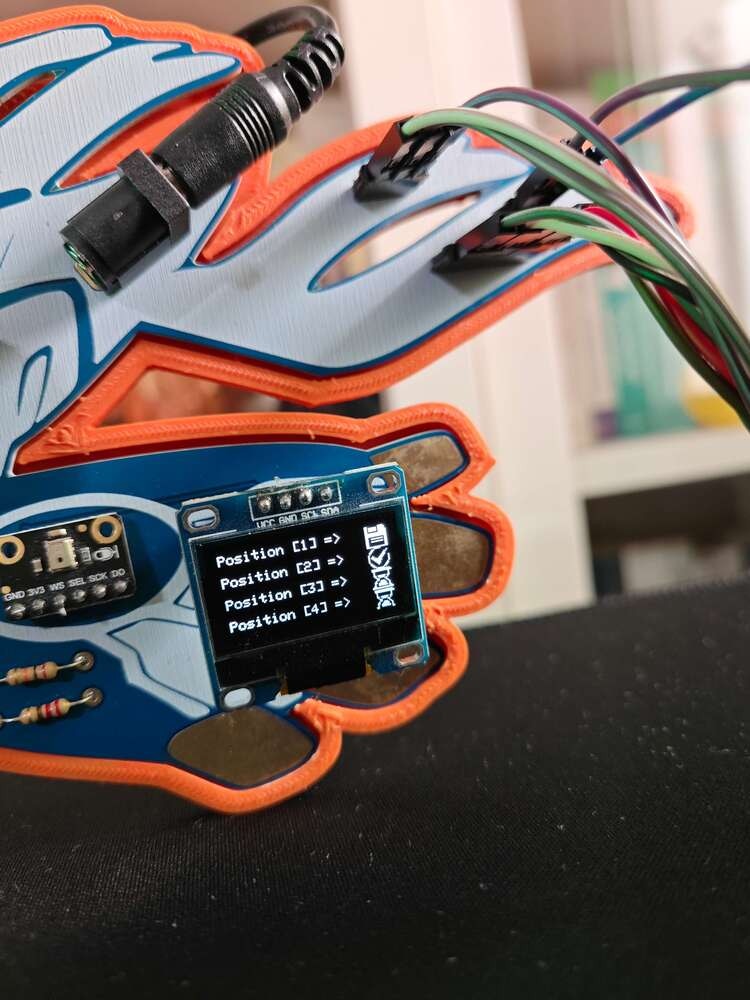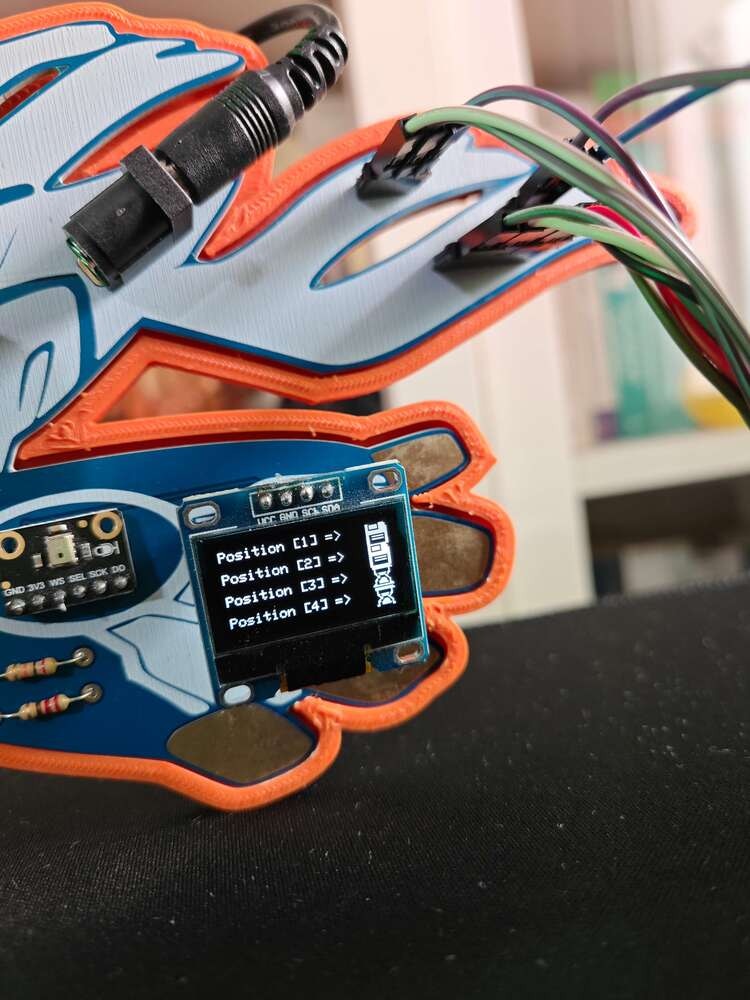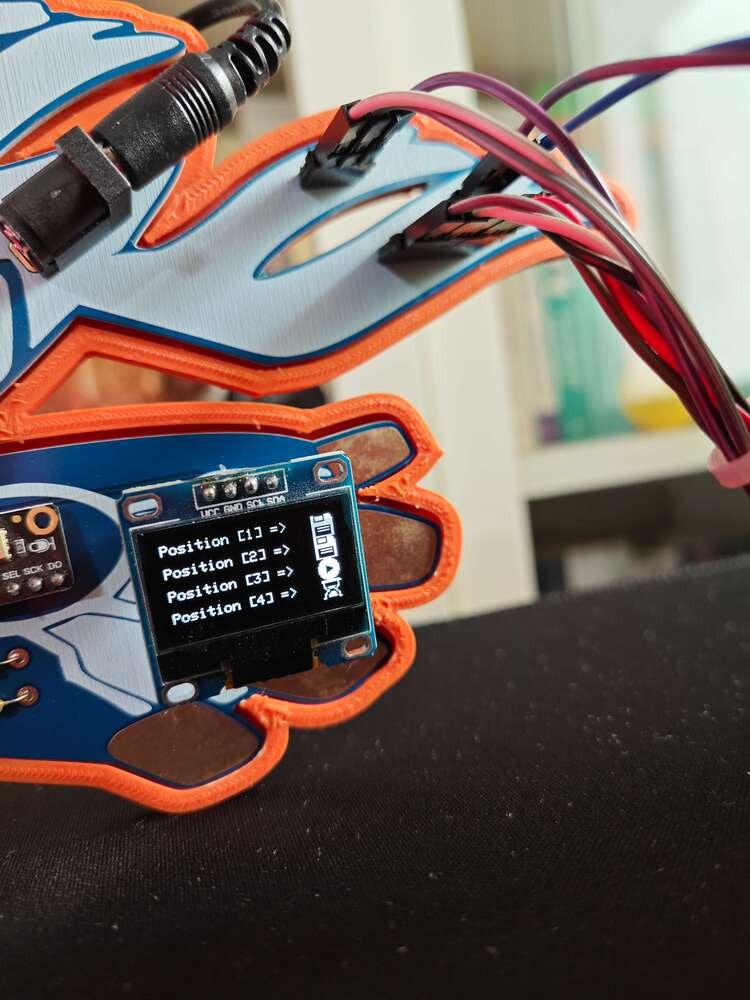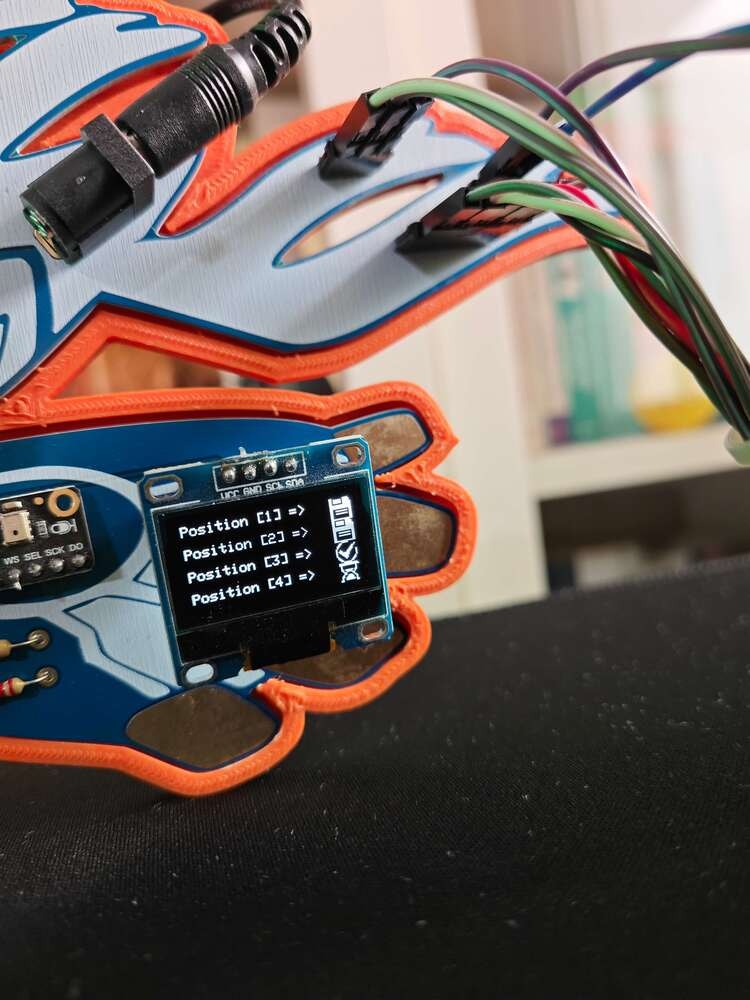
Created By: Kutluhan Aktar Public Project Link: https://studio.edgeimpulse.com/public/418121/latest GitHub Repository: https://github.com/KutluhanAktar/AI-driven-Sound-Thermal-Image-based-HVAC-Fault-Diagnosis/
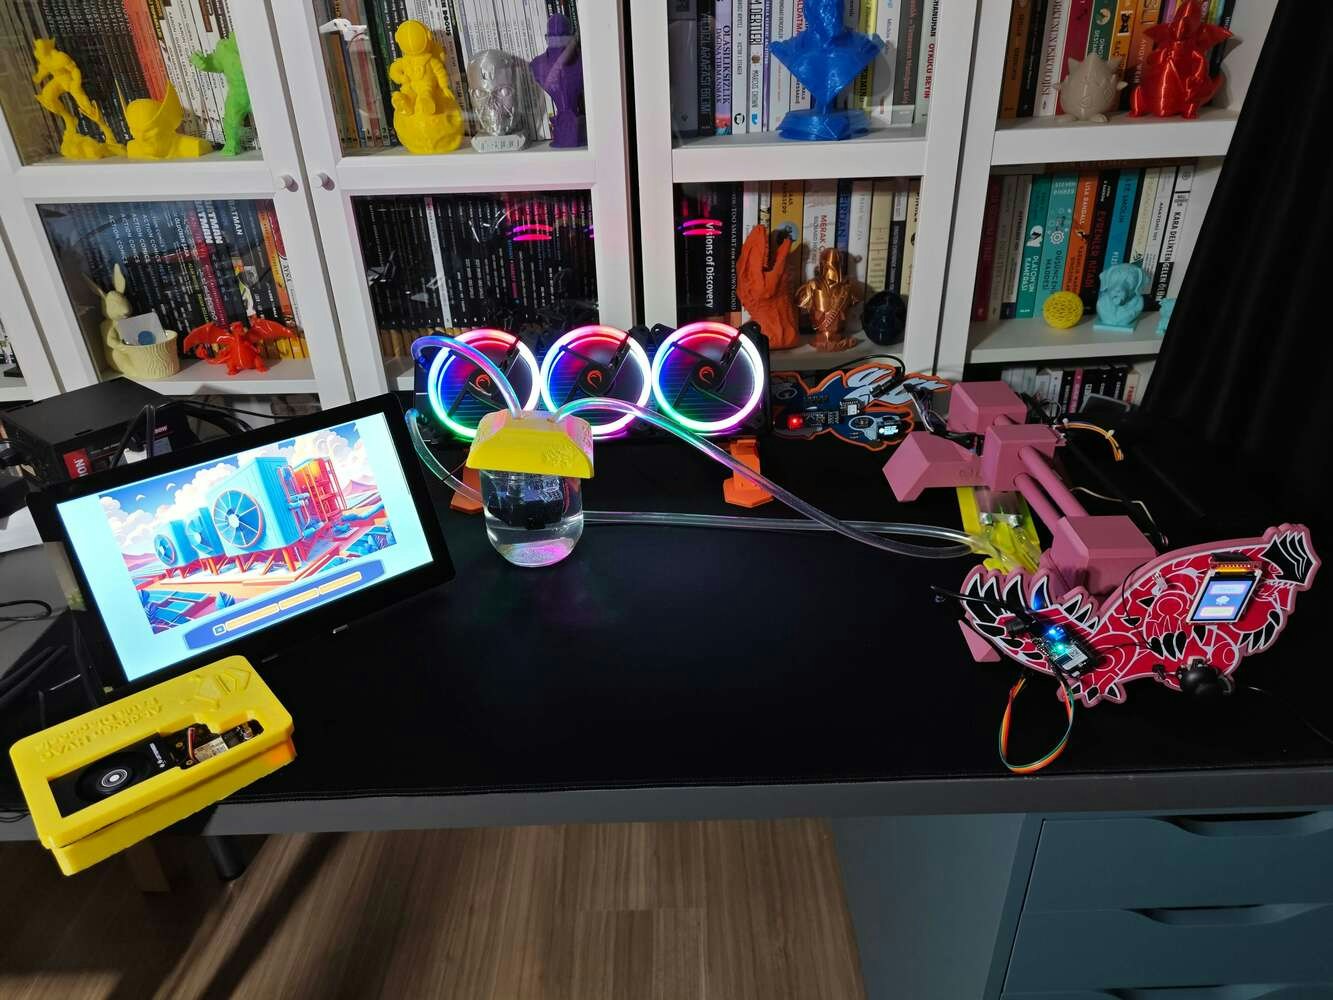
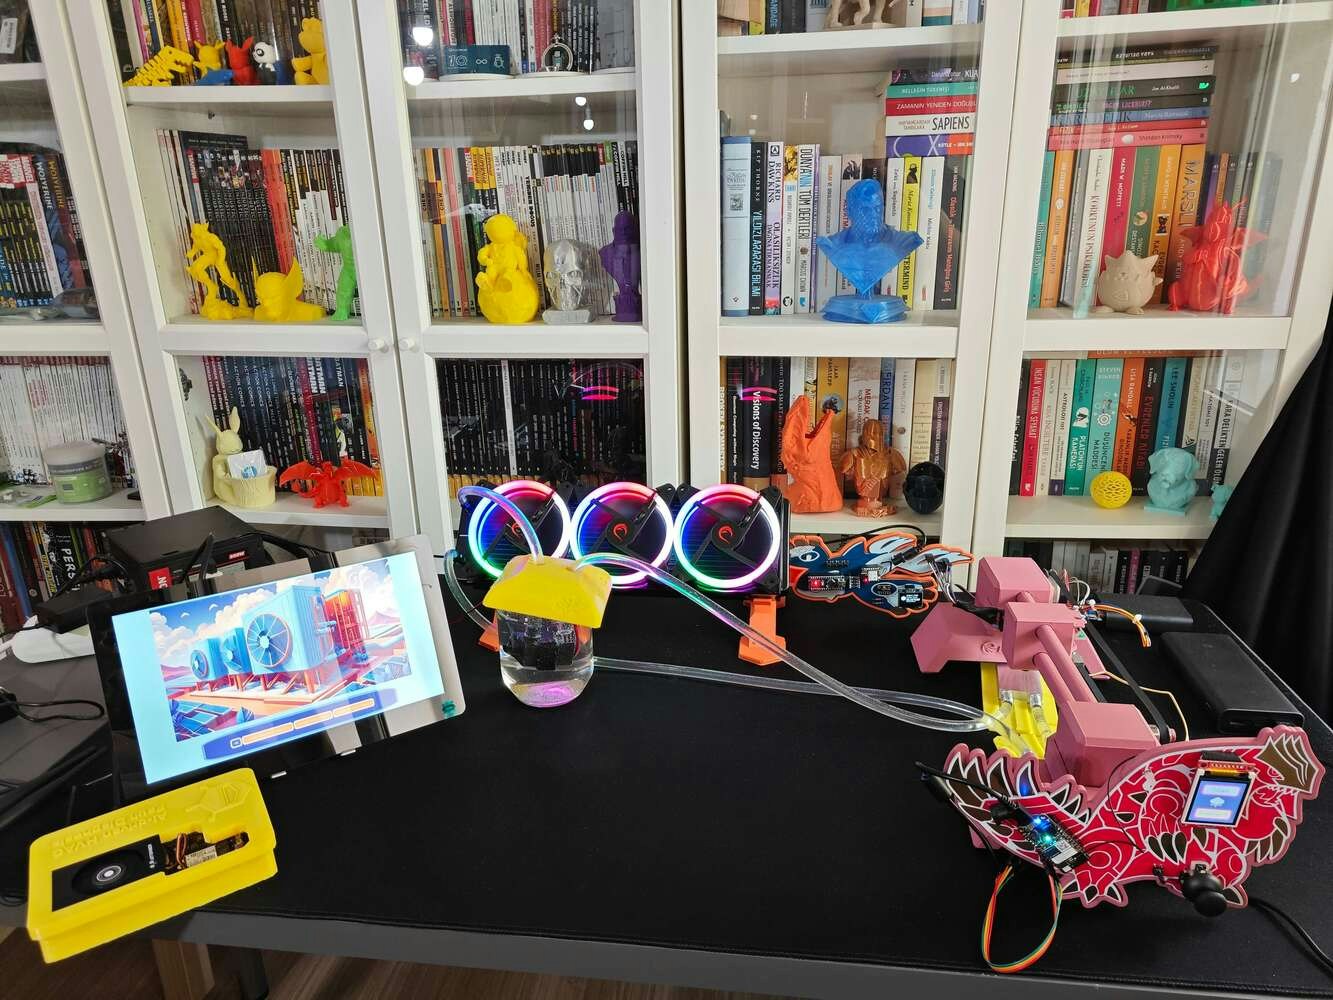
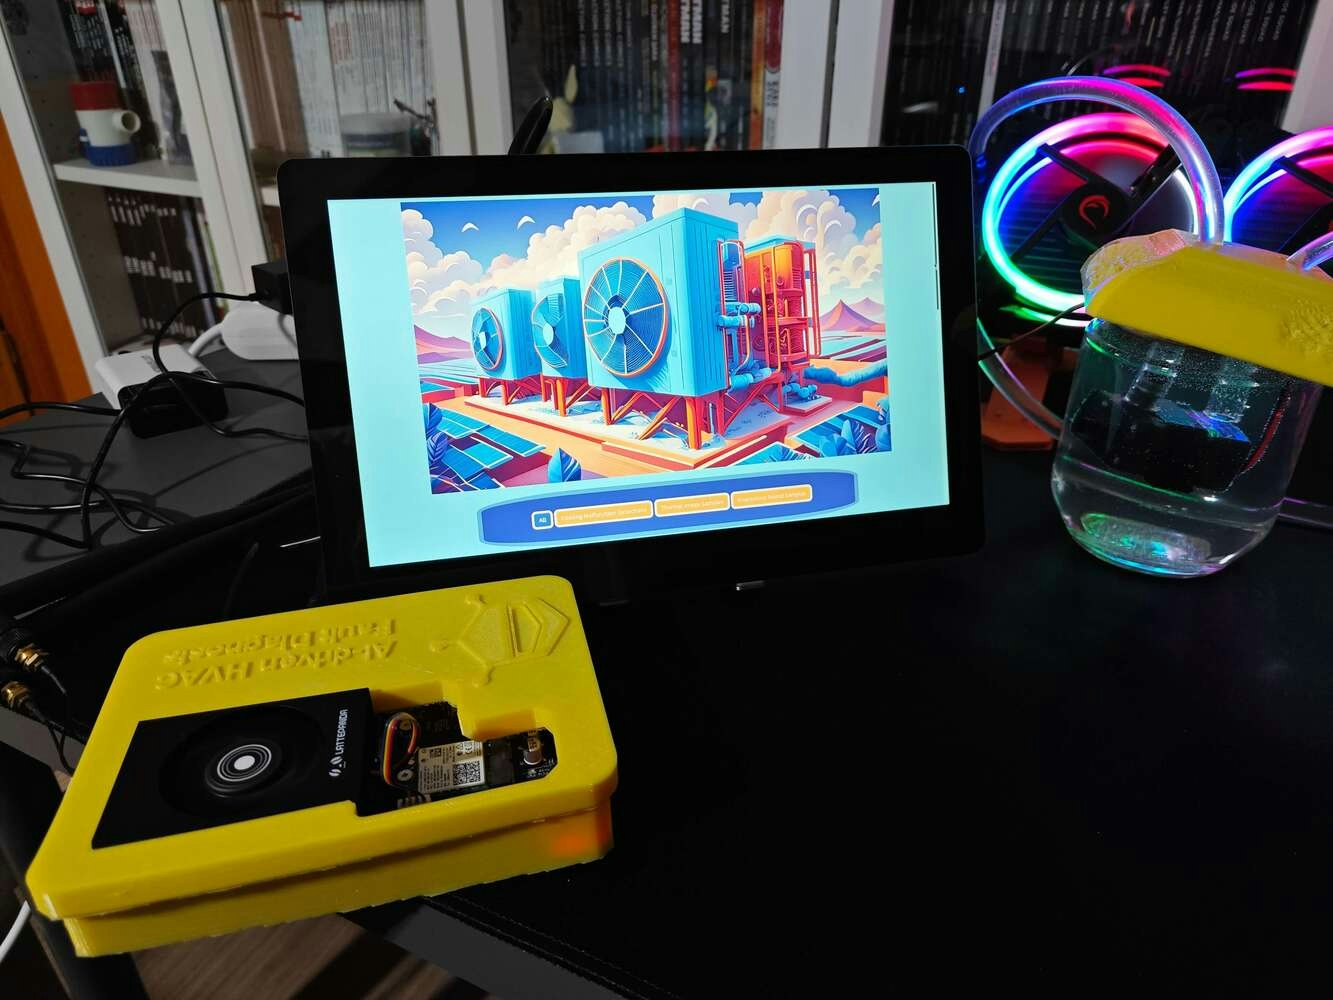
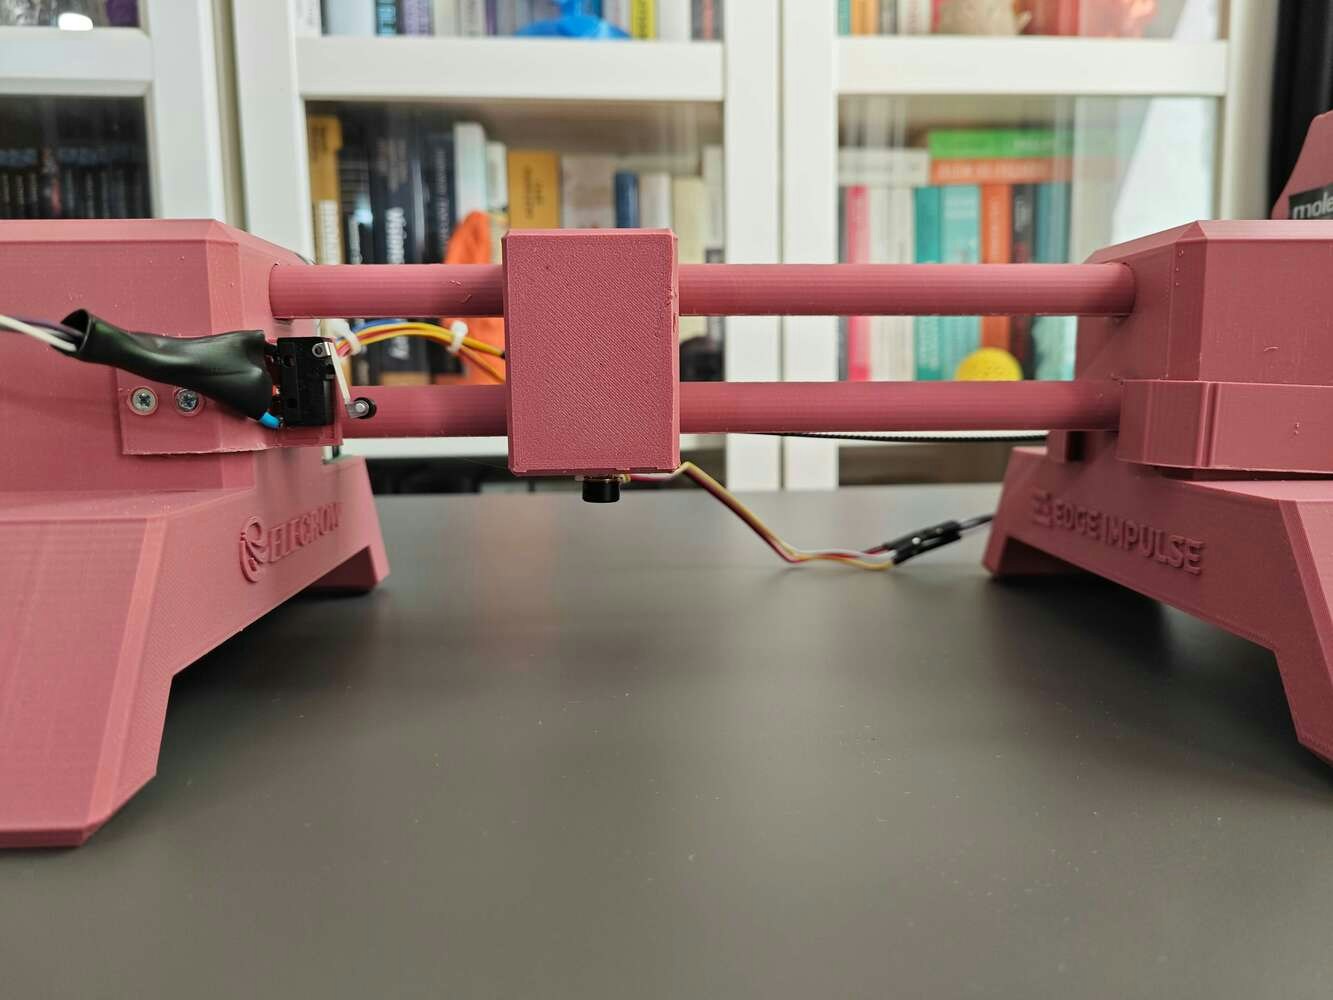
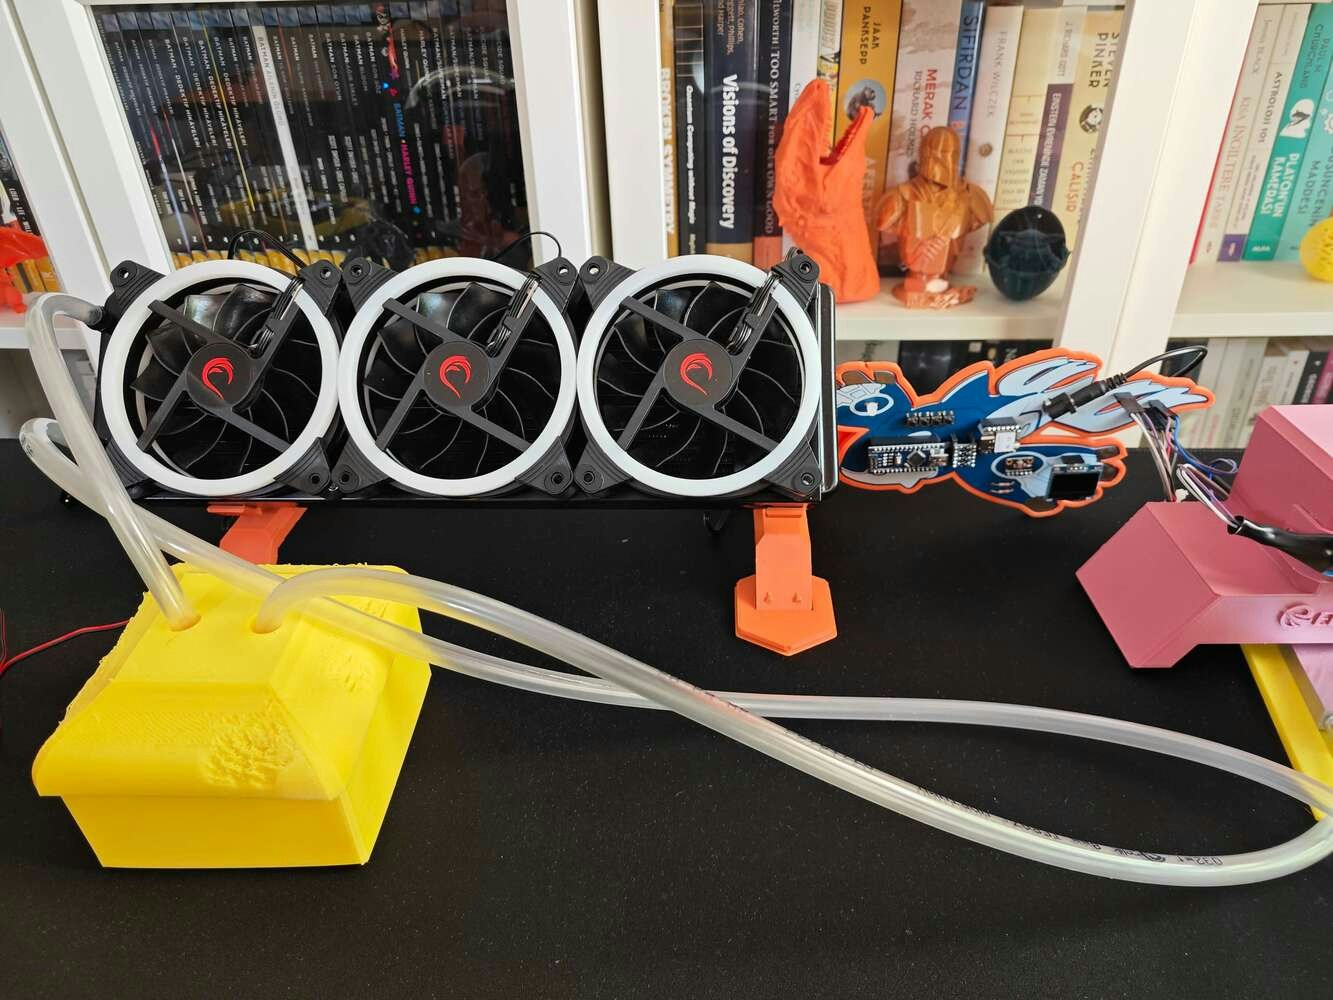
Full HVAC monitoring system assembly step 15, checking parts in a fit-check view with the radiator, reservoir, CNC rig, and dashboard

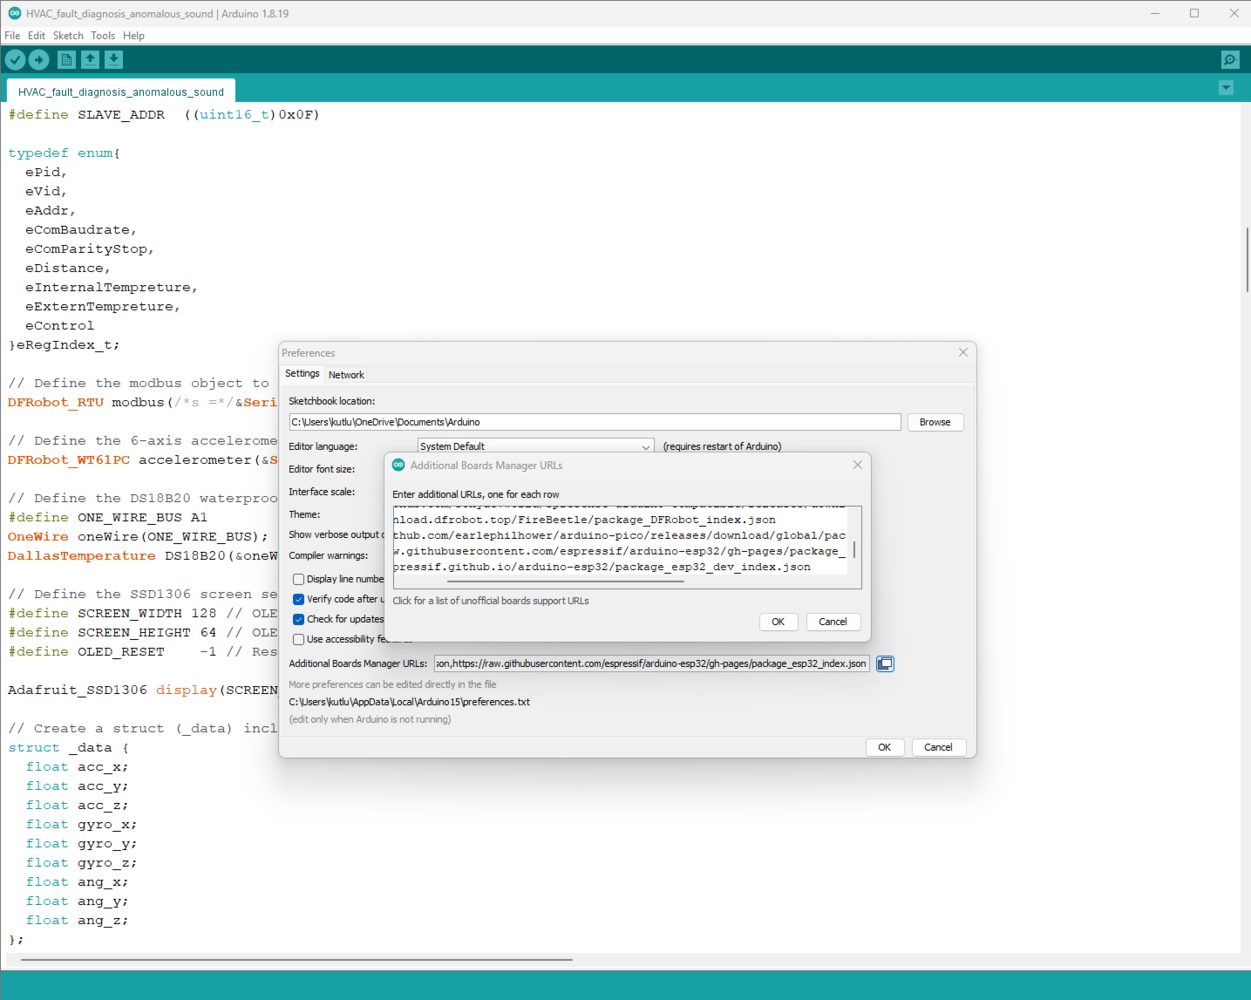
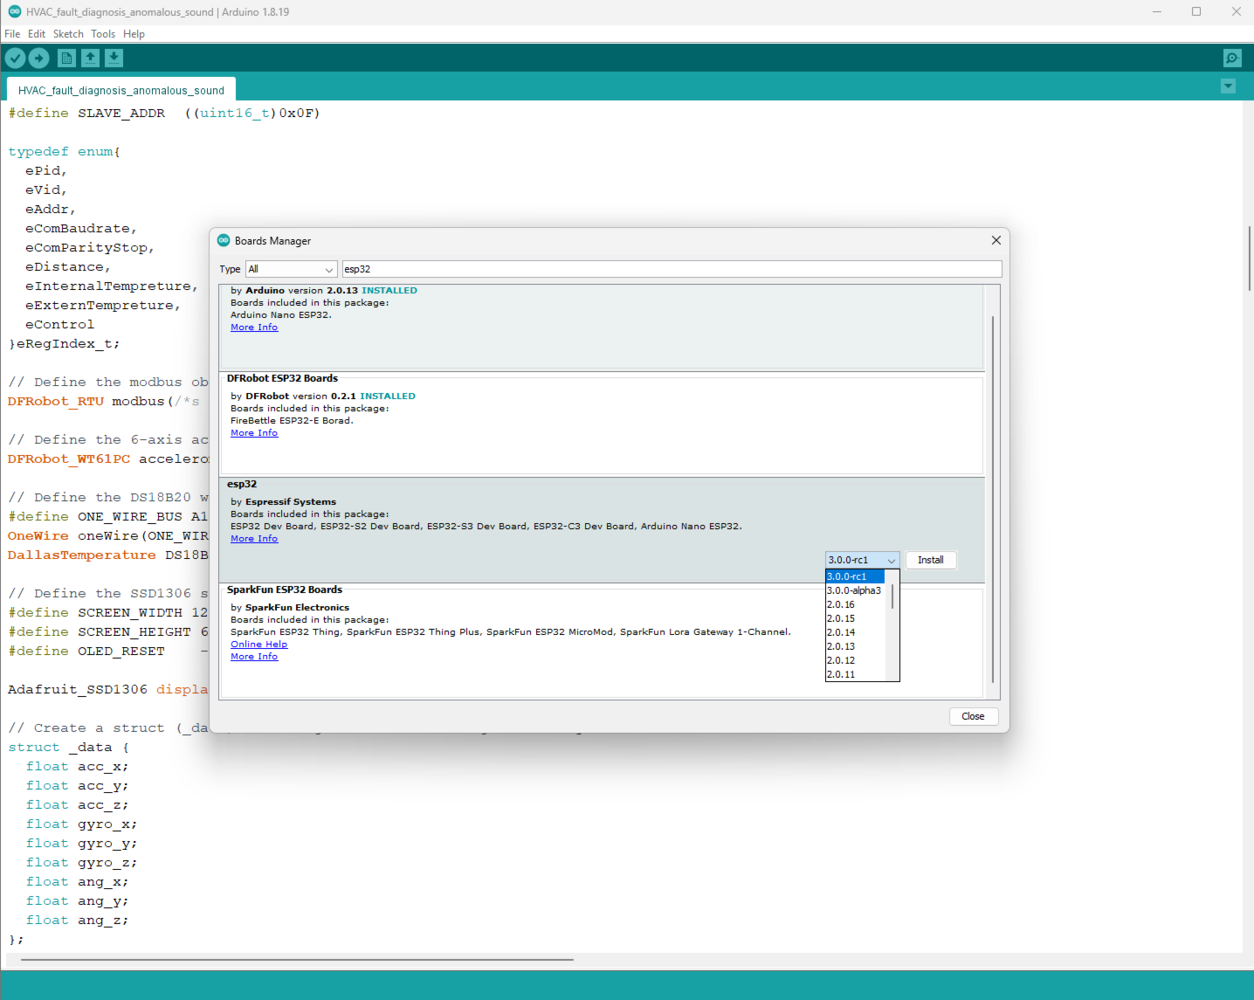
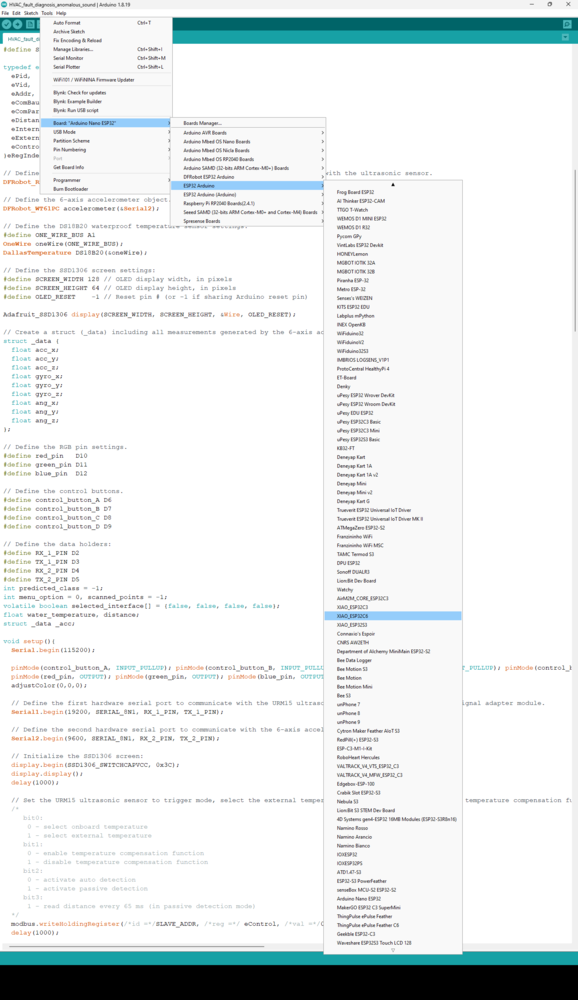
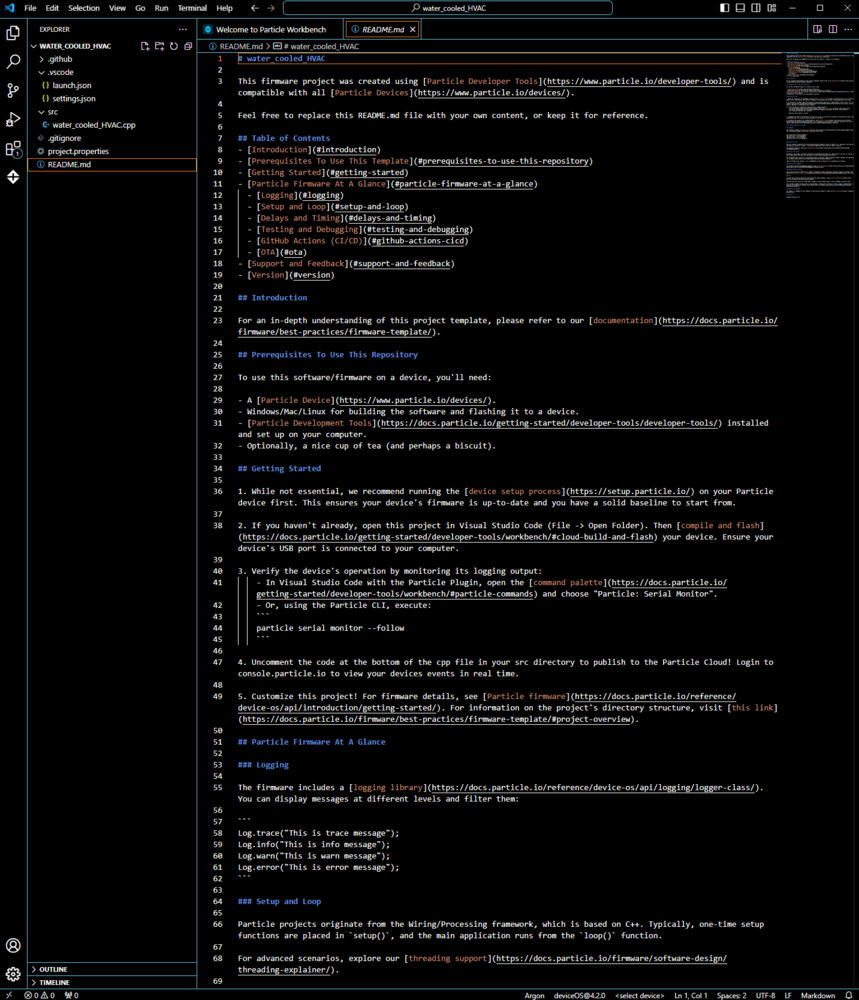
Description

One of the most prominent hurdles in operating manufacturing plants is to regulate the enervating heat produced by industrial processes. Therefore, an efficient industrial cooling system is the fulcrum of managing a profitable, sustainable, and robust industrial facility. There are various cooling system designs and structures to provide versatile heat regulation for different business requirements. For instance, natural draft cooling benefits the density discrepancy between the produced hot air and ambient fresh air, mechanical draft cooling utilizes sprayed hot water to transfer heat from a condenser to dry air, and water cooling uses cold water directly to reduce the targeted component temperature. When all cooling requirements are considered, water cooling options are still the most popular and budget-friendly cooling systems applicable to various cooling scenarios, including but not limited to condominiums, office buildings, and industrial facilities. Water cooling systems, also known as hydronic cooling systems, are mainly considered as the most adaptable and advantageous HVAC (heating, ventilation, and air conditioning) systems utilizing water to transfer heat from one location to another[^1]. Since hydronic HVAC systems use water to absorb and transfer heat, they are more energy efficient as compared to air-based systems since water has a higher thermal capacity. According to the applied heat transfer method and water source, water-based cooling systems provide design flexibility with low-maintenance. Nonetheless, despite the advantages of relying on water as a coolant, water-based HVAC systems still require regular inspection and maintenance to retain peak condition and avert pernicious cooling aberrations deteriorating heat regulation for industrial facilities, office buildings, or houses. Since water-based cooling equipment is a part of various demanding industrial applications[^2], including but not limited to chemicals or petrochemicals, welding, medical, pharmaceutical, automotive, data centers, and metalworking, maintaining consistent and reliable heat transfer is essential to sustain profitable business growth. Thus, to reduce production costs and increase manufacturing efficiency, mechanics should examine each cooling component painstakingly and regularly. Since hydronic HVAC systems can be intricate and multifaceted depending on the application requirements, there are plentiful malfunctions that can affect cooling efficiency and heat transfer capacity, resulting in catastrophic production downtime for industrial processes. For instance, chillers using metal tubes (copper or carbon steel) to circulate water are susceptible to corrosion and abrasion, leading to leaks and component failures. Accumulating sediment or particulates in the complex tubing systems can corrode or clog pipes, leading to inadequate heat transfer. Or, perforce, neglected electronic components can degrade and fail due to prolonged wear and tear, leading to inconsistent cooling results. Unfortunately, these HVAC system malfunctions not only deteriorate industrial process sustainability but also engender hazardous environmental impacts due to high energy loss. Water-based or not, an installed HVAC system accounts for up to 50% of the total energy consumption of an establishment, surpassing the total energy consumption of lighting, elevators, and office equipment[^3]. Thus, an unnoticed abnormality can multiply energy consumption while the HVAC system tries to compensate for the heat transfer loss. Furthermore, since HVAC systems are tightly coupled systems and operate with protracted lag and inertia, they are vulnerable even to minuscule abnormalities due to the ripple effect of a single equipment failure, whether a capacitor, pipe, or gasket. Relevant data indicates that the amount of energy waste caused by a malfunctioning cooling system and faulty control accounts for about 15%–30% of the total energy consumption of studied facilities. Thus, by running a malfunctioning cooling system, buildings became profligate energy consumers, resulting in harsh energy production demands causing excess carbon and methane emitted into the atmosphere. Therefore, applying real-time (automated) malfunction diagnosis to HVAC systems can abate excessive energy consumption and improve energy efficiency leading to savings ranging from 5% to 30% [^3]. In addition to preventing energy loss, automated HVAC fault detection can extend equipment lifespan, avoid profit loss, and provide stable heat transfer during industrial processes. In that regard, automated malfunction detection also obviates exorbitant overhaul processes due to prolonged negligence, leading to a nosedive in production quality. After perusing recent research papers on detecting component failures to automate HVAC maintenance, I noticed that there are no practical applications focusing on identifying component abnormalities of intricate water-based HVAC systems to diagnose consecutive thermal cooling malfunctions before instigating hazardous effects on both production quality and the environment. Hence, I decided to build a versatile multi-model AIoT device to detect anomalous sound emanating from cooling fans via a neural network model and to diagnose consecutive thermal cooling malfunctions based on specifically produced thermal images via a visual anomaly detection model. In addition to AI-driven features, I decided to develop a capable and feature-rich web application (dashboard) to improve user experience and make data transfer easier between development boards. As I started to work on developing my AI-powered device features, I realized that no available open-source data sets were fulfilling the purpose of multi-model HVAC malfunction diagnosis. Thus, since I did not have the resources to collect data from an industrial-level HVAC system, I decided to build a simplified HVAC system simulating the required component failures for data collection and in-field model testing. I got heavily inspired by PC (computer) water cooling systems while designing my simplified HVAC system. Similar to a closed-loop PC water cooling design, I built my system by utilizing a water pump, plastic tubing, an aluminum radiator, and aluminum blocks. As for the coolant reservoir, I decided to design a custom one and print the parts with my 3D printer. Nonetheless, since I decided to produce a precise thermal image by scanning cooling components, I still needed an additional mechanism to move a thermal camera on the targeted components, the aluminum blocks. Thus, I decided to design a fully 3D-printable CNC router with the thermal camera container head to position the thermal camera, providing an automatic homing sequence. My custom CNC router is controlled by Arduino Nano and consists of a 28BYJ-48 stepper motor, GT2 pulleys, a timing belt, and gear clamps. While producing thermal images and running the visual anomaly detection model, I simply added an aquarium heater to the closed-water loop in order to instantiate aluminum block cooling malfunctions. As mentioned earlier, to provide full-fledged AIoT features with seamless integration and simplify complex data transfer procedures between development boards while constructing separate data sets and running multiple models, I decided to develop a versatile web application (dashboard) from scratch. To briefly summarize, the web dashboard can receive audio buffers via HTTP POST requests, save audio samples by given classes, communicate with the Particle Cloud to obtain variables or make Particle boards register them, produce thermal images from thermal imaging buffers to store image samples, and run the visual anomaly detection model on the generated thermal images. In the following tutorial, you can inspect all web dashboard features in detail. Since this is a multi-model AI-oriented project, I needed to construct two different data sets and train two separate machine learning models in order to build a capable device. First, I focused on constructing a valid audio data set for detecting anomalous sound originating from cooling fans. Since XIAO ESP32C6 is a compact and high-performance IoT development board providing 512KB SRAM and 4 MB Flash, I decided to utilize XIAO ESP32C6 to collect audio samples and run my neural network model for anomalous sound detection. To generate fast and accurate audio samples (buffers), I decided to use a Fermion I2S MEMS microphone. Also, I connected an SSD1306 OLED display and four control buttons to program a feature-rich on-device user interface. After collecting an audio sample, XIAO ESP32C6 transfers it to the web dashboard for data collection. As mentioned earlier, I designed my custom CNC router based on Arduino Nano due to its operating voltage. To provide seamless device operations, XIAO ESP32C6 communicates with Arduino Nano to move the thermal camera container head. After completing constructing my audio data set, I built my neural network model (Audio MFE) with Edge Impulse to detect sound-based cooling fan abnormalities. Audio MFE models employ a non-linear scale in the frequency domain, called Mel-scale, and perform well on audio data, mostly for non-voice recognition. Since Edge Impulse is nearly compatible with all microcontrollers and development boards, I have not encountered any issues while uploading and running my Audio MFE model on XIAO ESP32C6. As labels, I simply differentiated the collected audio samples by the cooling fan failure presence:
  • normal
  • defective
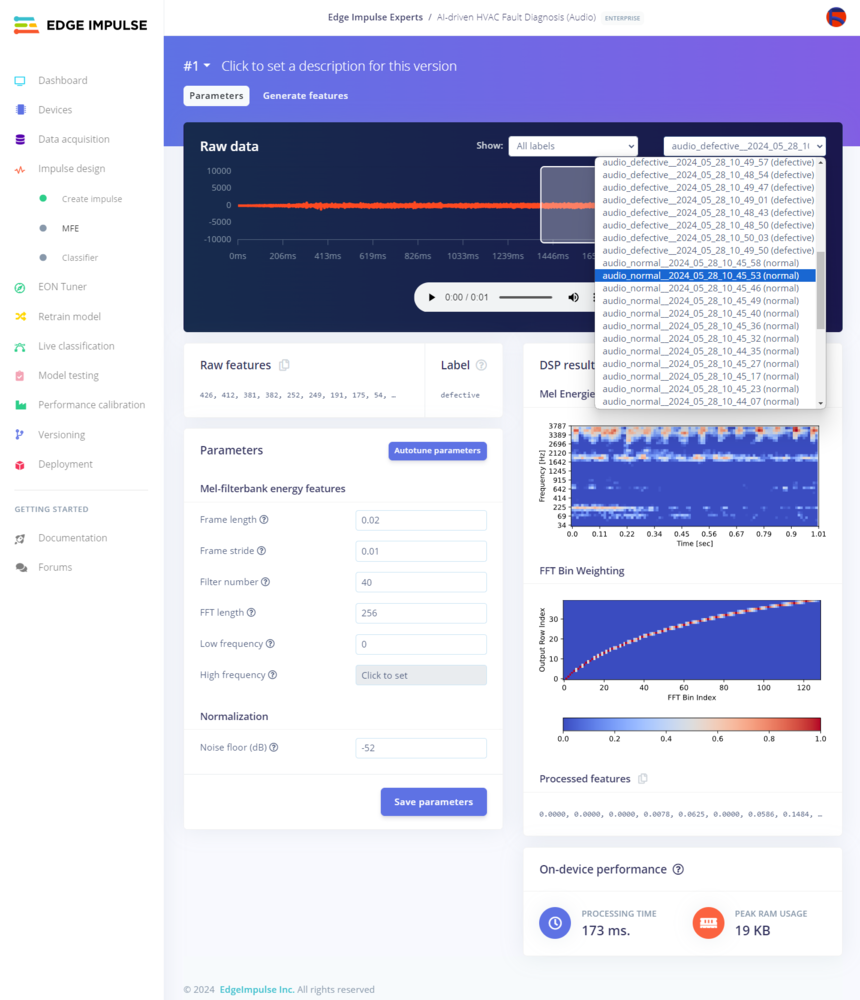
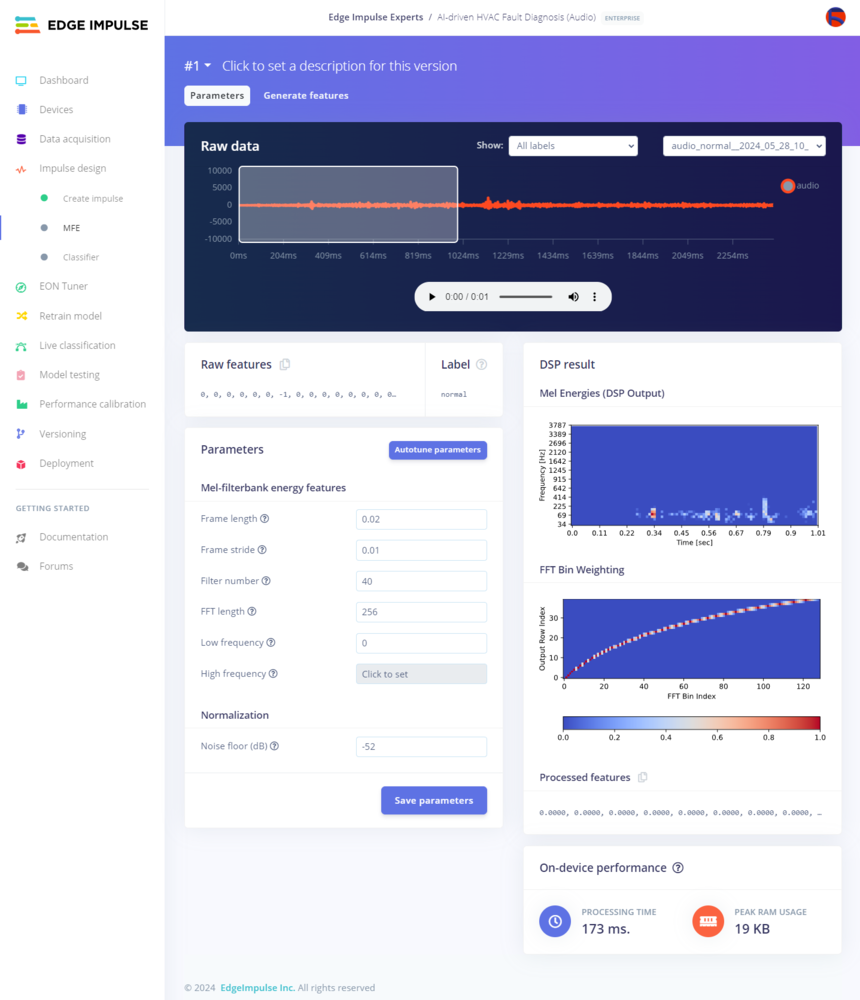
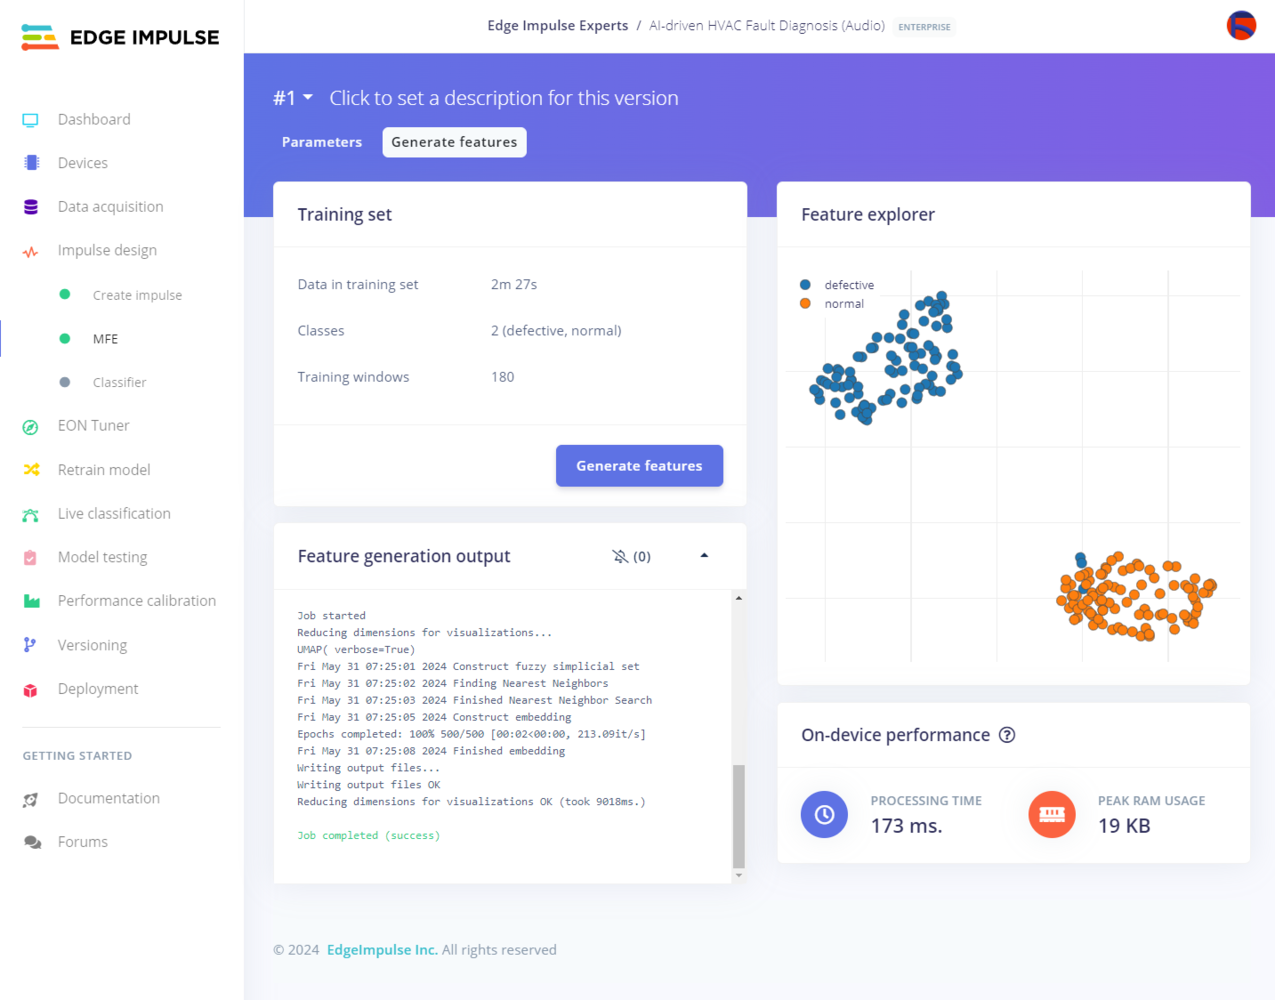
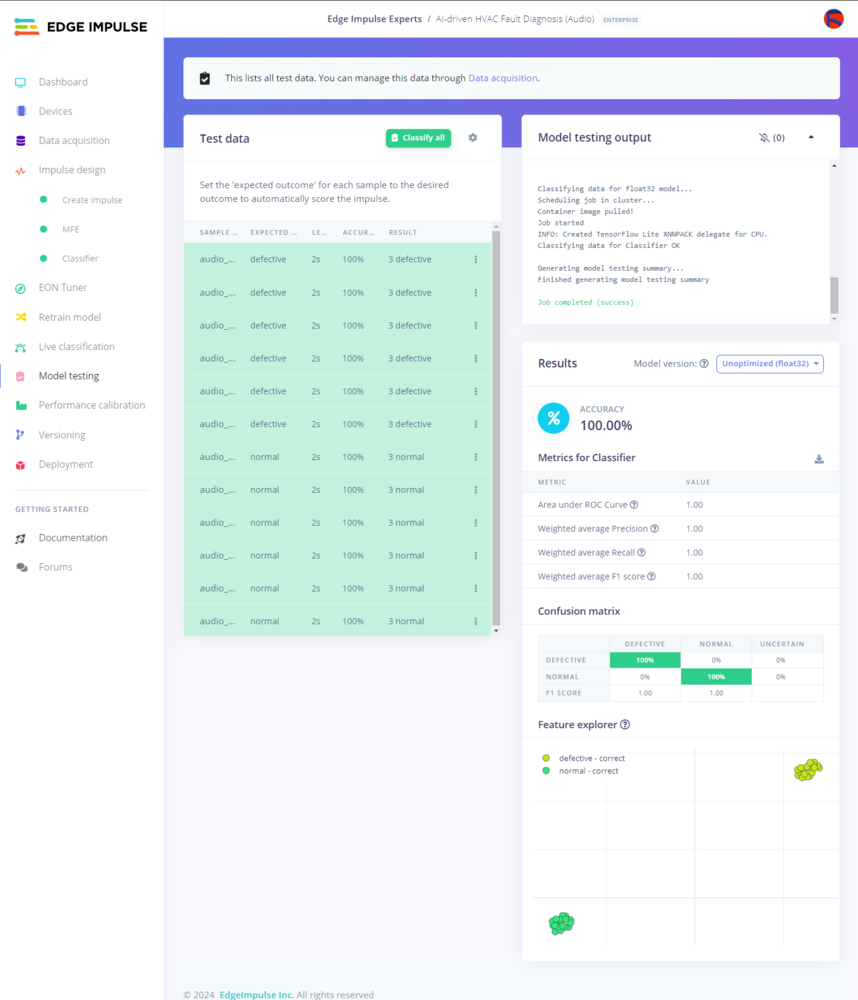
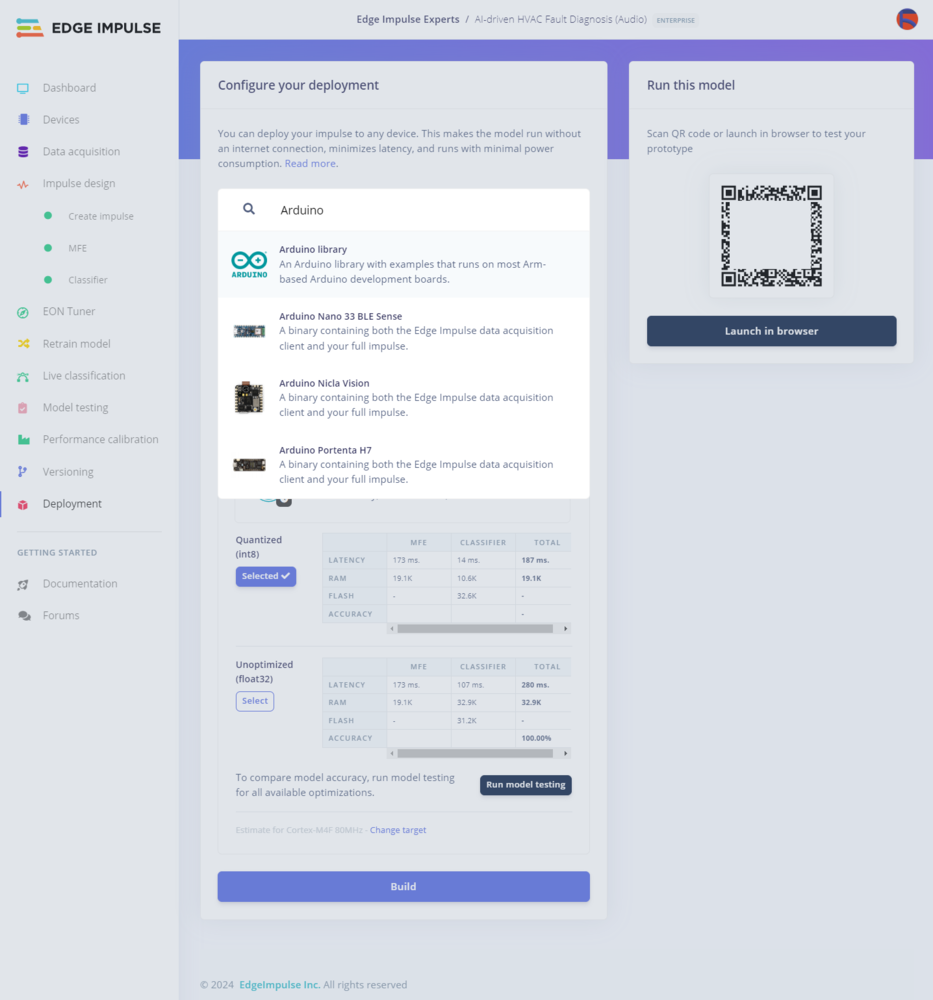
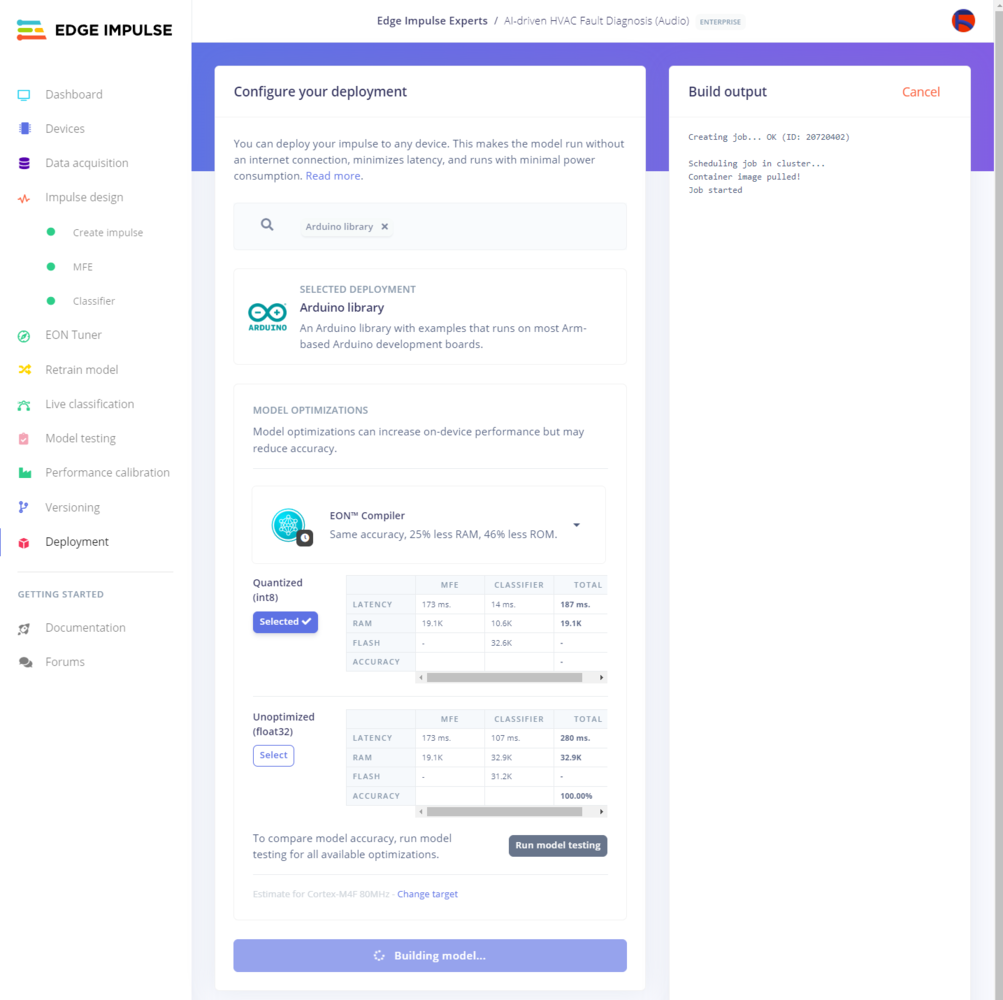
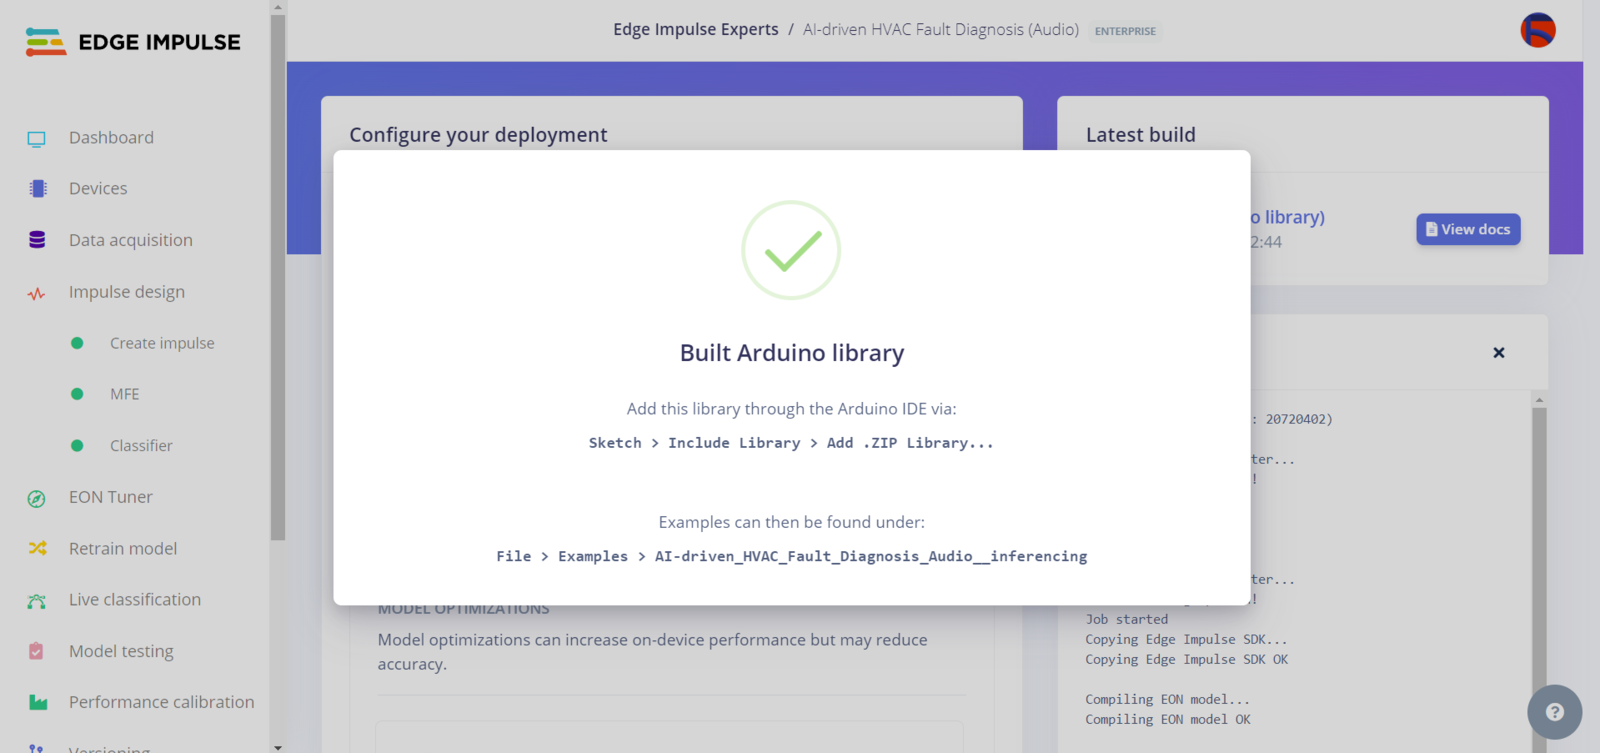
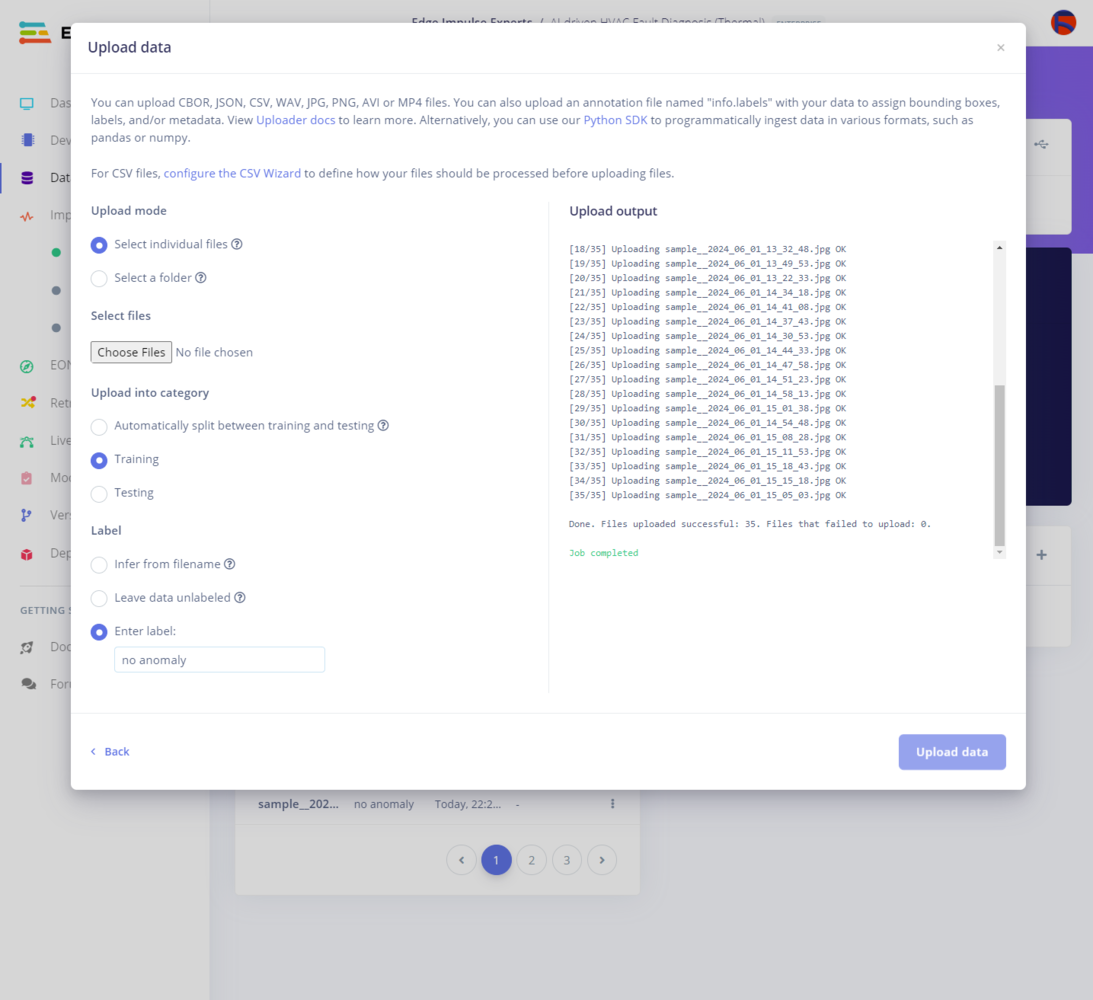
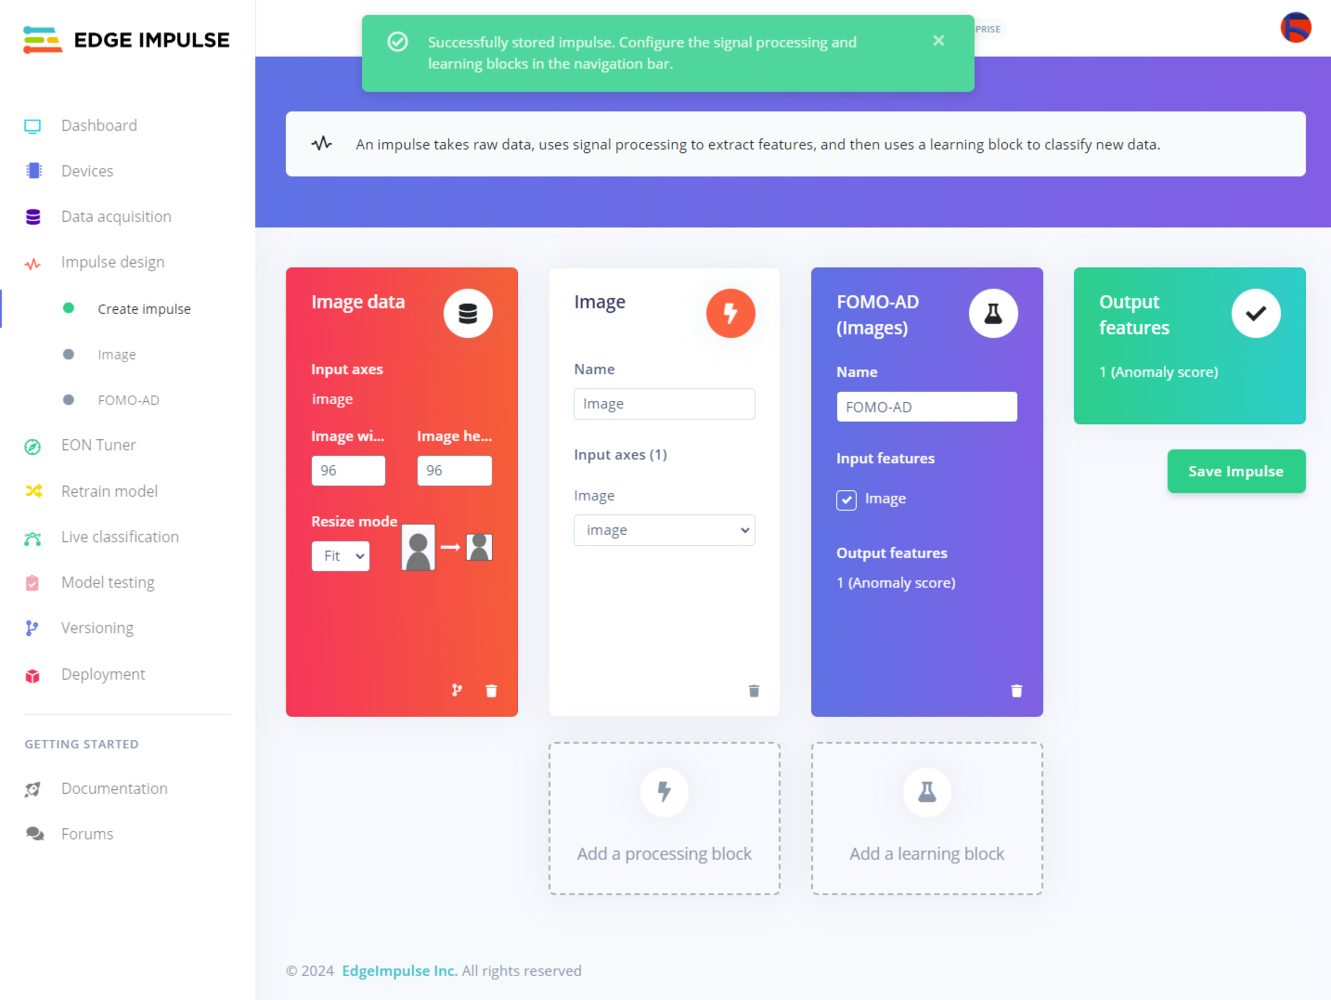
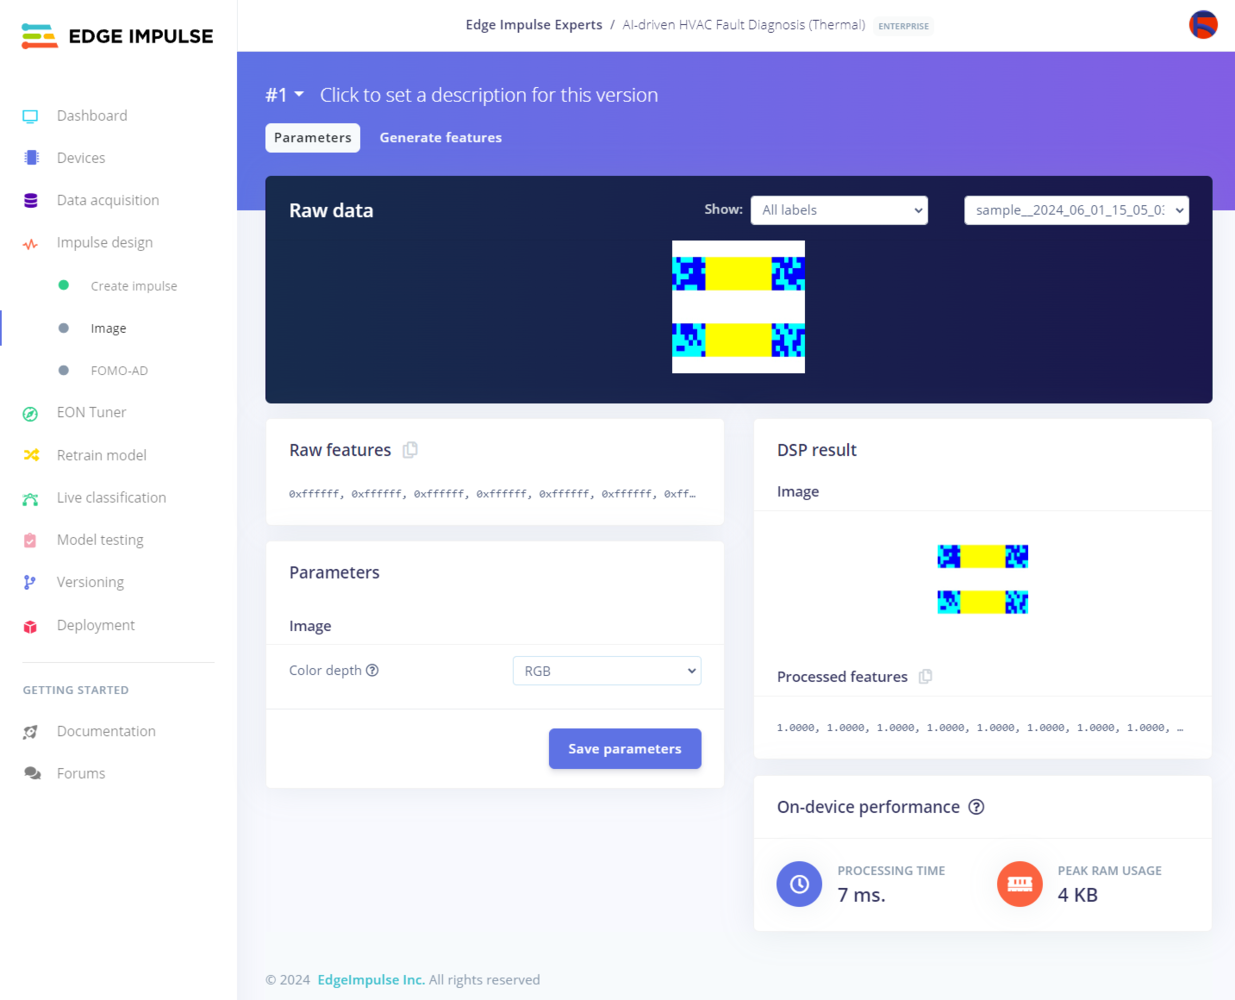
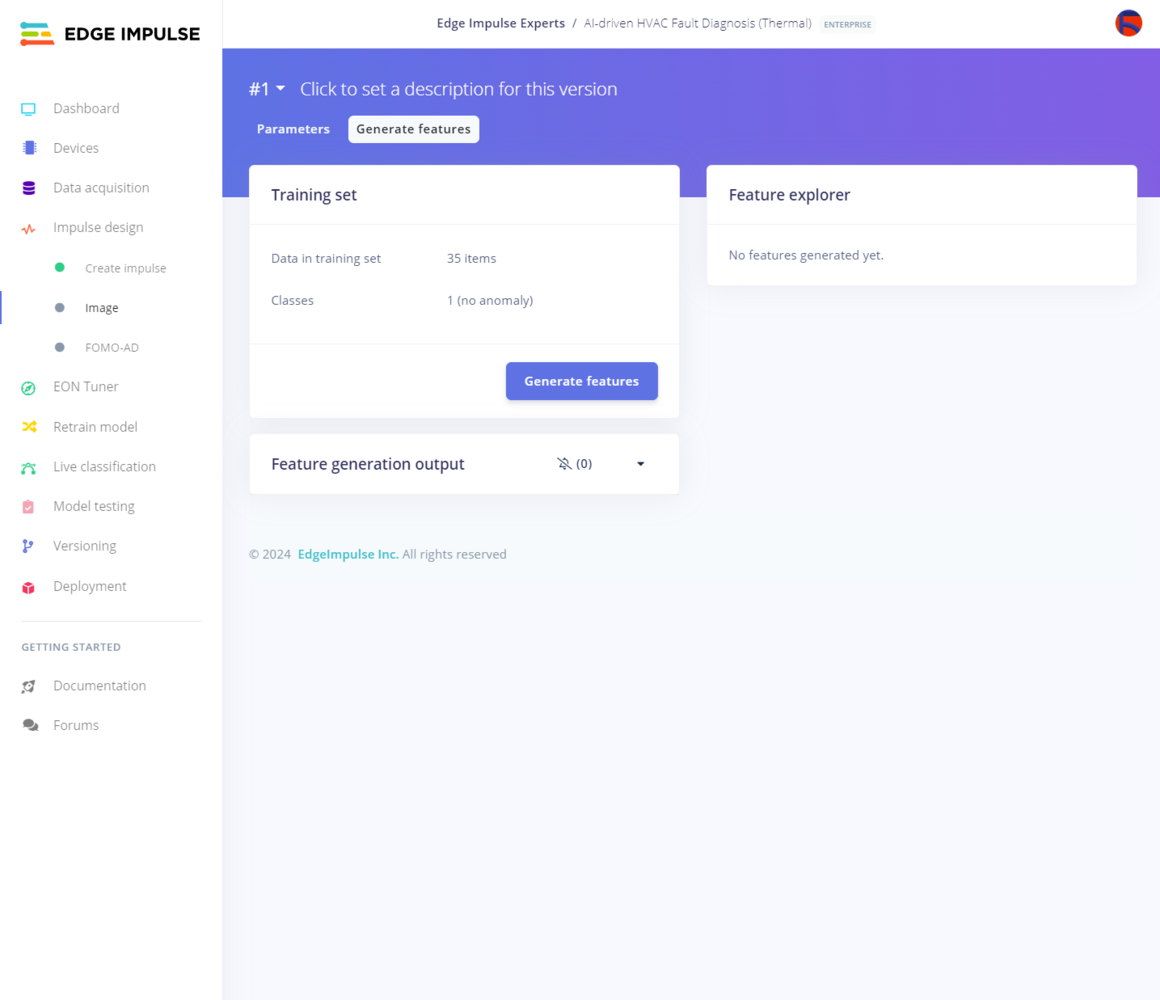
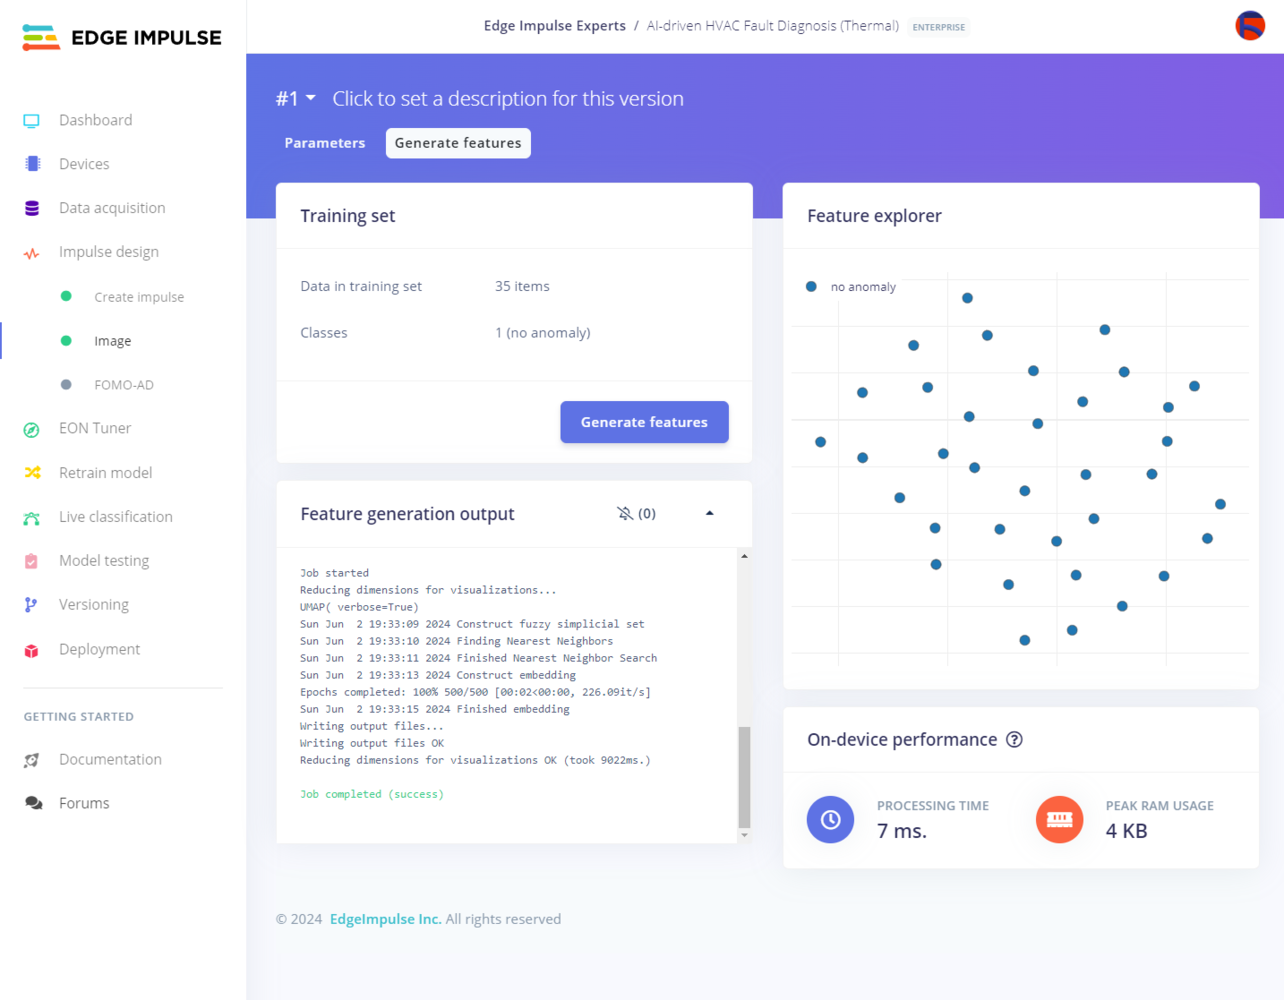
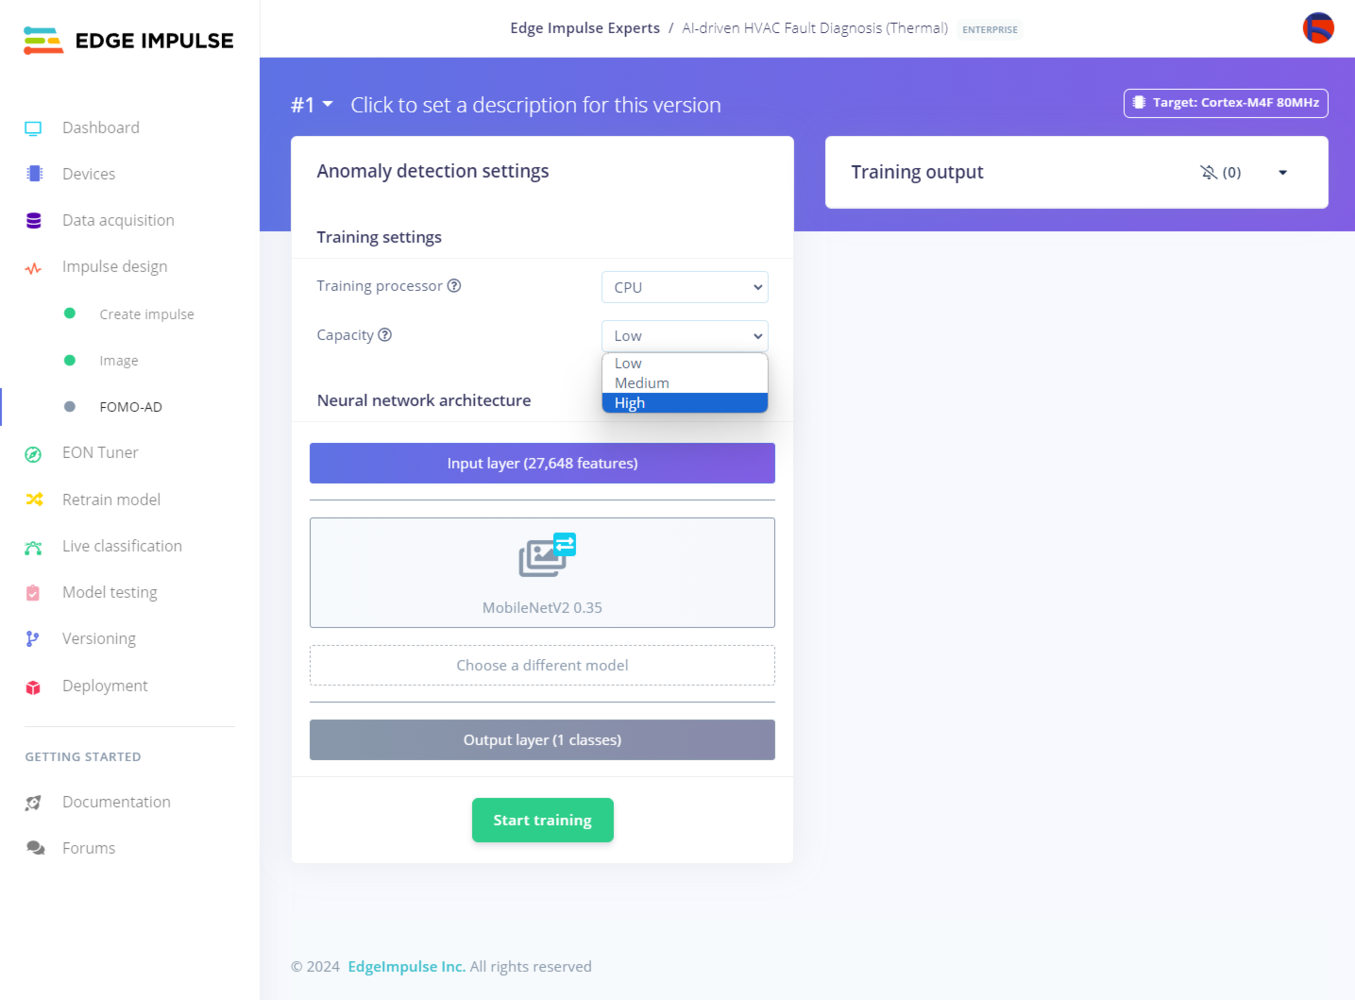
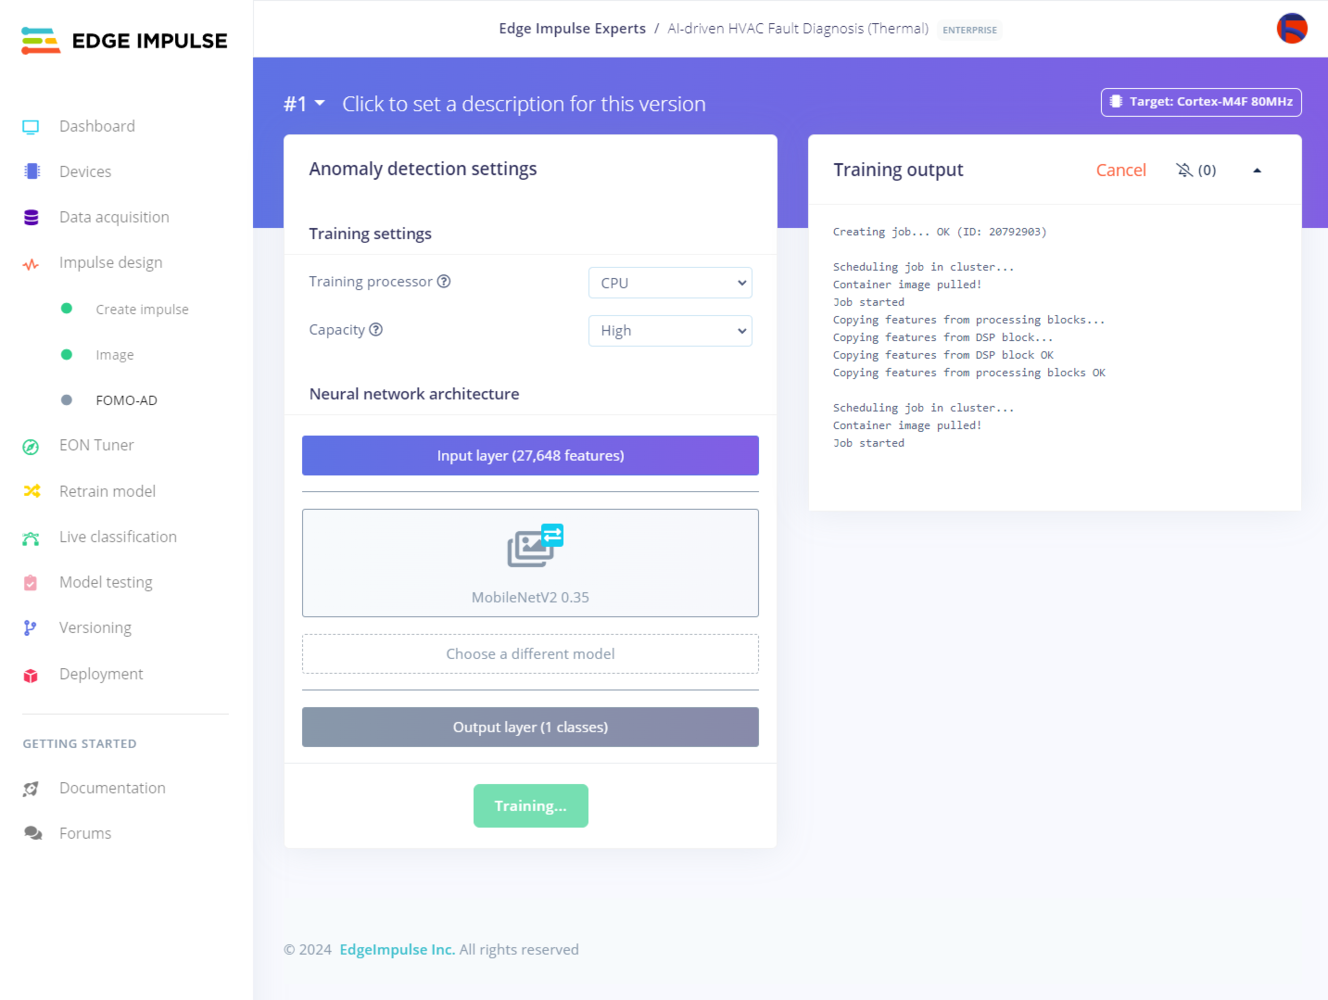
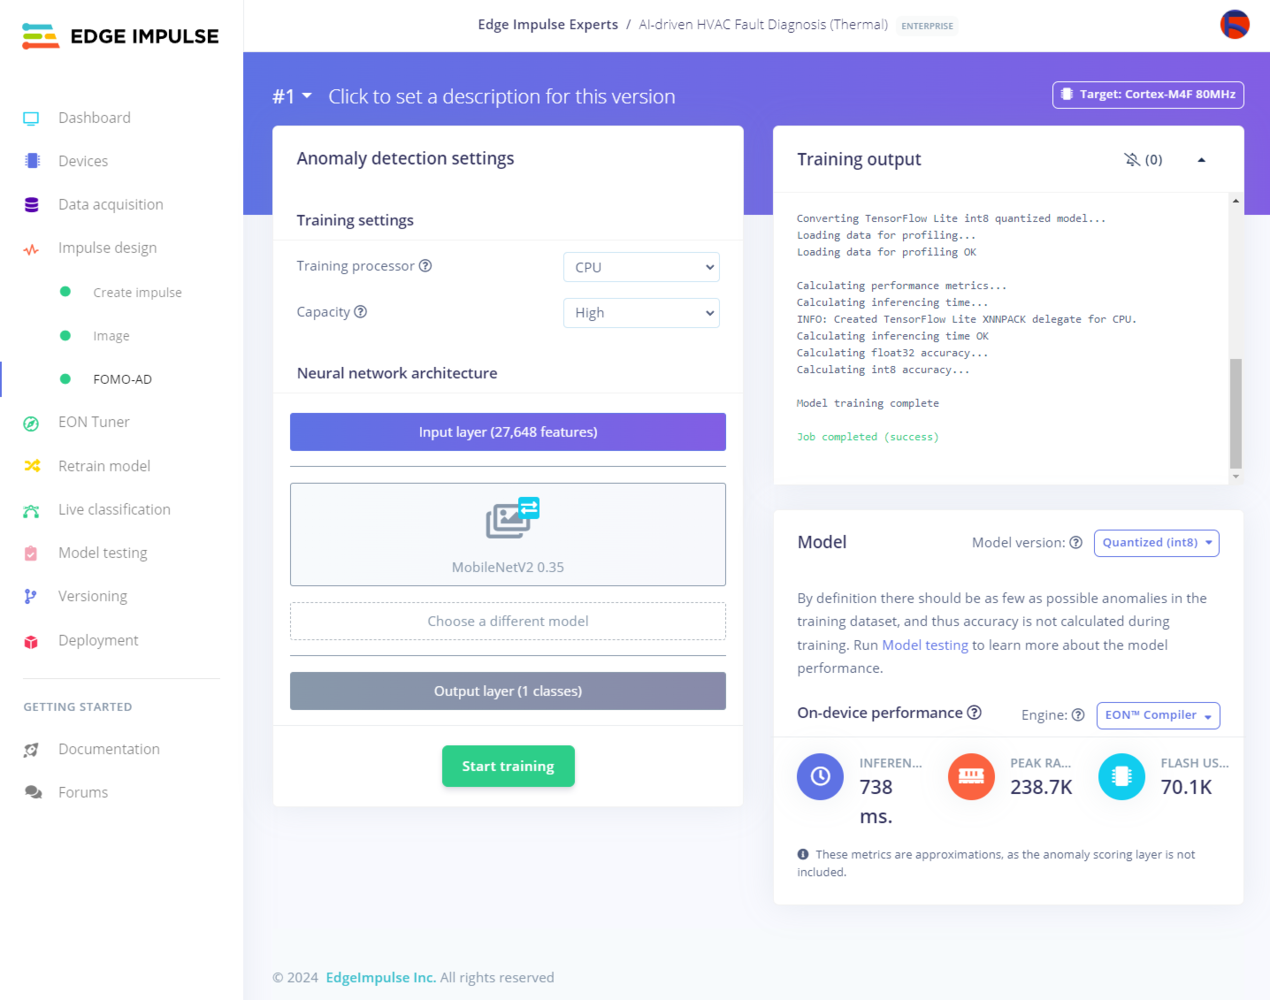
After training and testing my neural network model (Audio MFE), I deployed the model as an Arduino library and uploaded it to XIAO ESP32C6. Therefore, the device is capable of detecting anomalous sound emanating from the cooling fans by running the neural network model onboard without any additional procedures or latency. Since I wanted to employ the secure and reliable Particle Cloud as a proxy to transfer thermal imaging (scan) buffers to the web dashboard, I decided to utilize Photon 2, which is a feature-packed IoT development board optimized for cloud prototyping. To collect accurate thermal imaging buffers, I employed an MLX90641 thermal imaging camera producing 16x12 IR arrays (buffers) with fully calibrated 110° FOV (field-of-view). Also, I connected an ST7735 TFT display and an analog joystick to program a secondary on-device user interface. Even though I managed to create a snapshot (preview) image from the collected thermal scan buffers, Photon 2 is not suitable for generating thermal images, saving image samples, and running a demanding visual anomaly detection model simultaneously due to memory limitations. Therefore, after registering the collected thermal scan buffers to the Particle Cloud, I utilized the web dashboard to obtain the registered buffers via the Particle Cloud API, produce thermal image samples, and run the visual anomaly detection model. Considering the requirements of producing accurate thermal images and running a visual anomaly detection model, I decided to host my web application (dashboard) on a LattePanda Mu (x86 Compute Module). Combined with its Lite Carrier board, LattePanda Mu is a promising single-board computer featuring an Intel N100 quad-core processor with 64 GB onboard storage. After completing constructing my thermal image data set, I built my visual anomaly detection model with Edge Impulse to diagnose ensuing thermal cooling malfunctions after applying anomalous sound detection to the water-based HVAC system. Since analyzing cooling anomalies based on thermal images of HVAC system components is a complicated task, I decided to employ an advanced and precise machine learning algorithm based on the GMM anomaly detection algorithm and FOMO. Supported by Edge Impulse Enterprise, FOMO-AD is an exceptional algorithm for detecting unanticipated defects by applying unsupervised learning techniques. Since Edge Impulse is nearly compatible with all microcontrollers and development boards, I have not encountered any issues while uploading and running my FOMO-AD model on LattePanda Mu. As labels, I utilized the default classes required by Edge Impulse to enable the F1 score calculation:
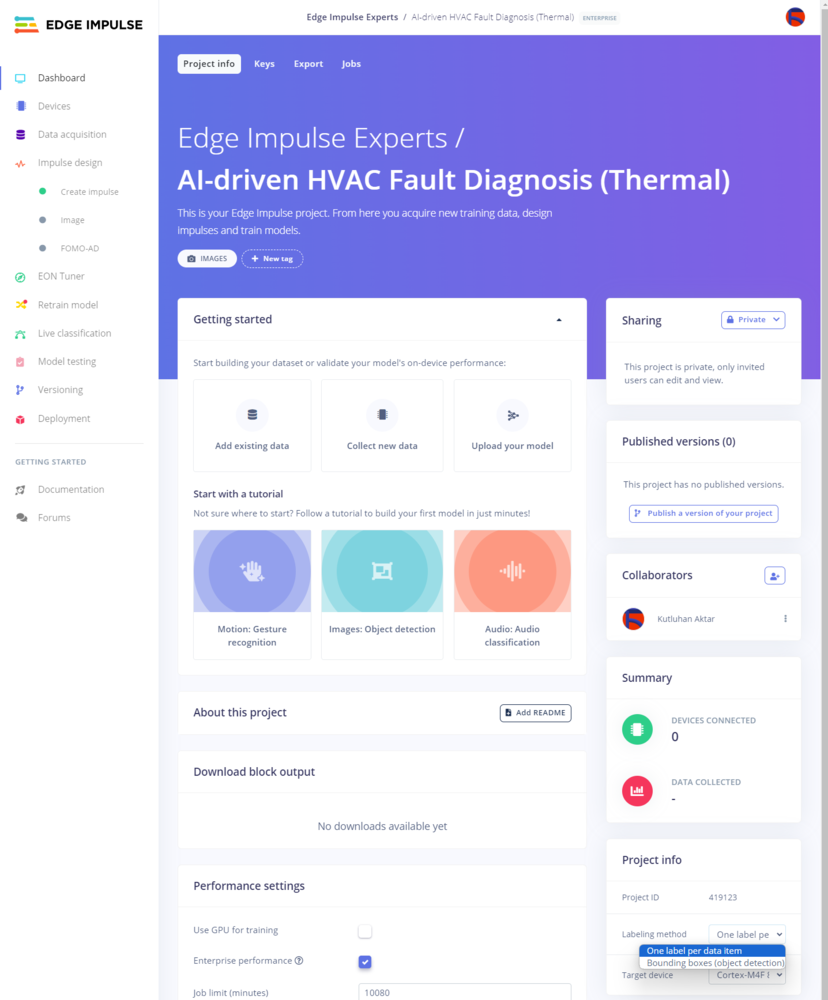
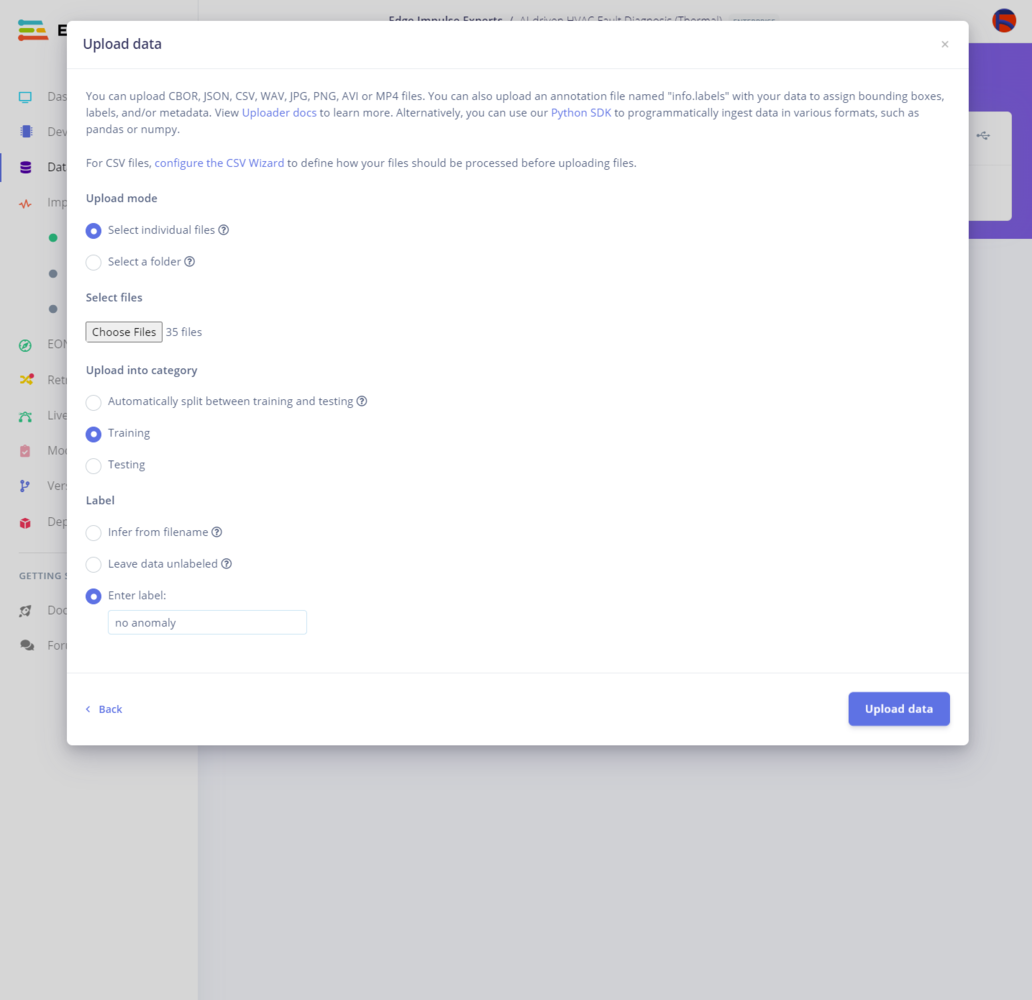
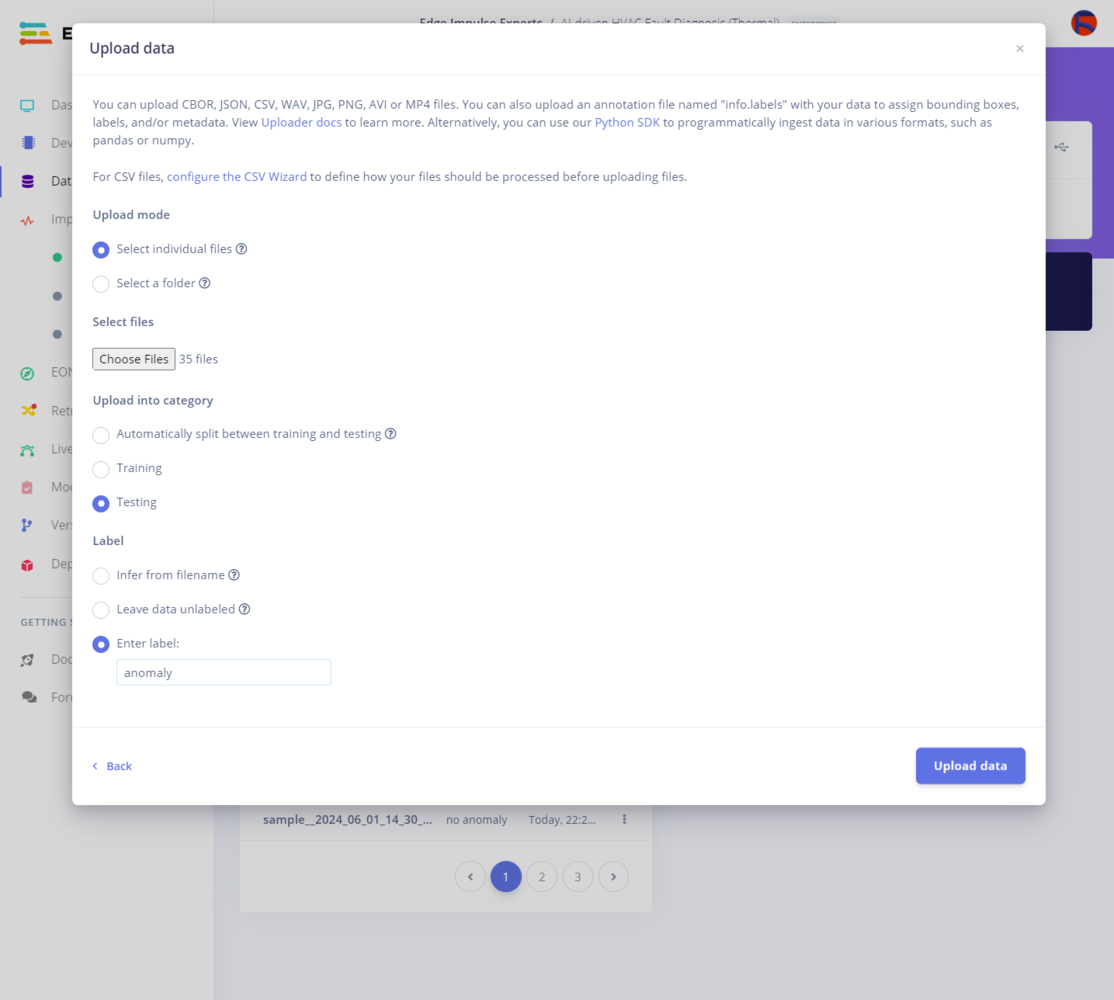
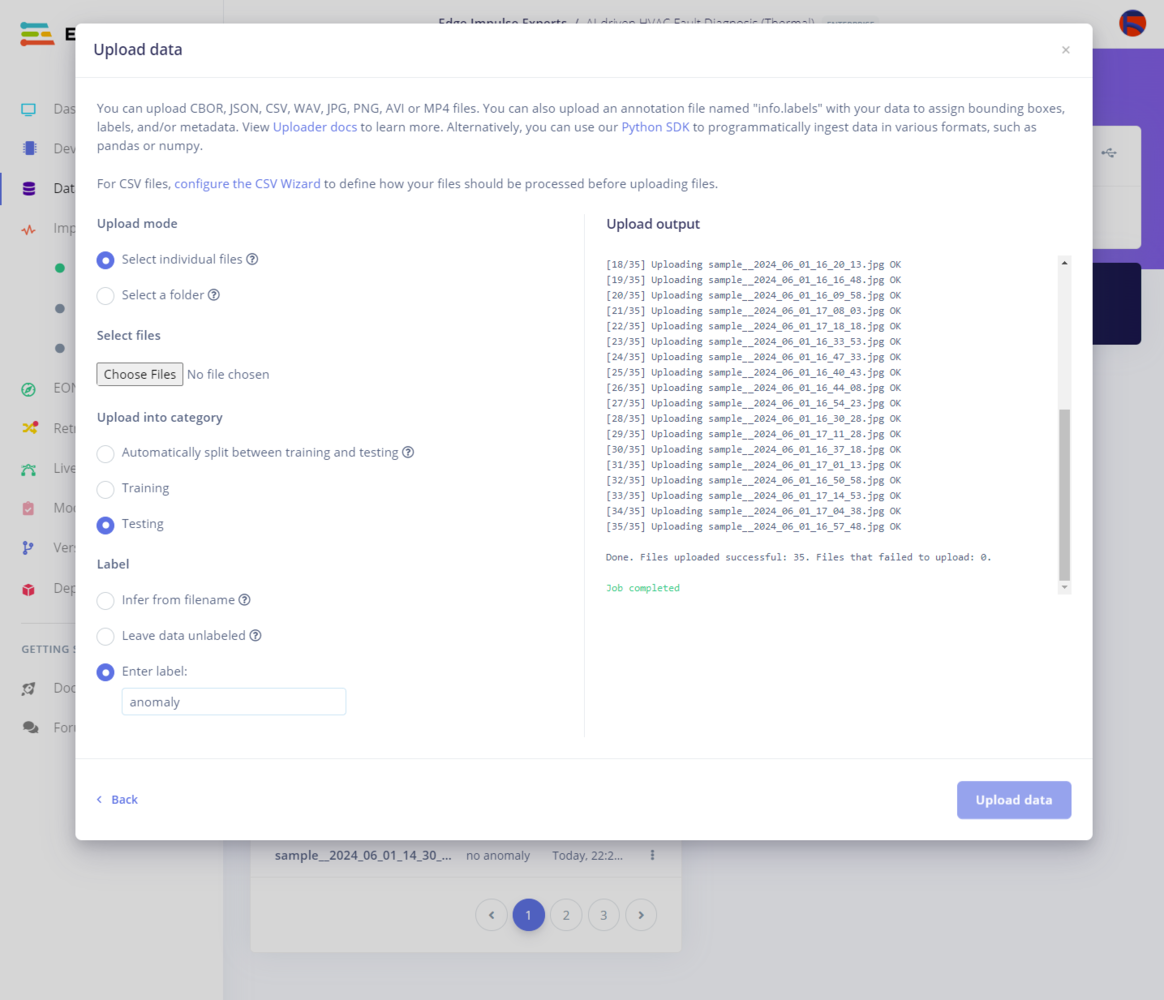
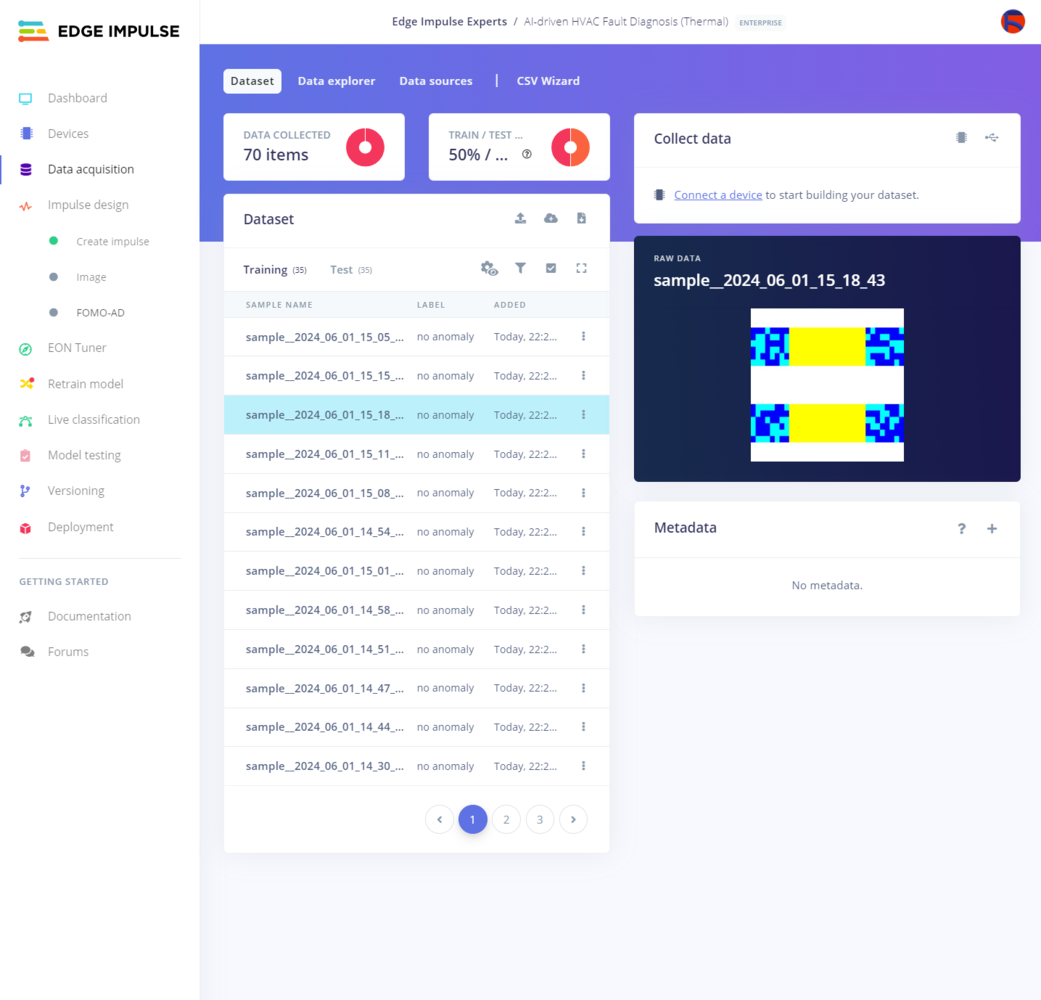
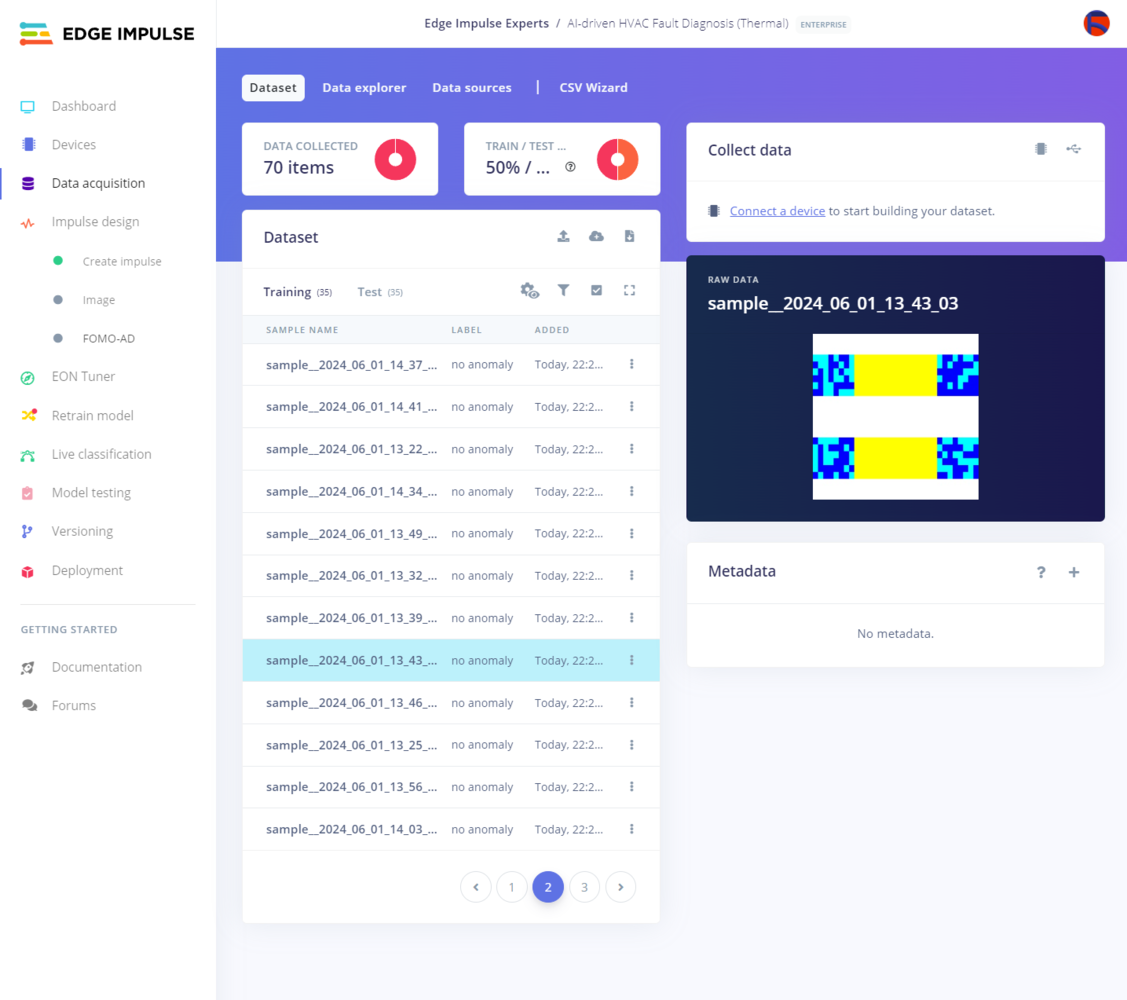
  • no anomaly
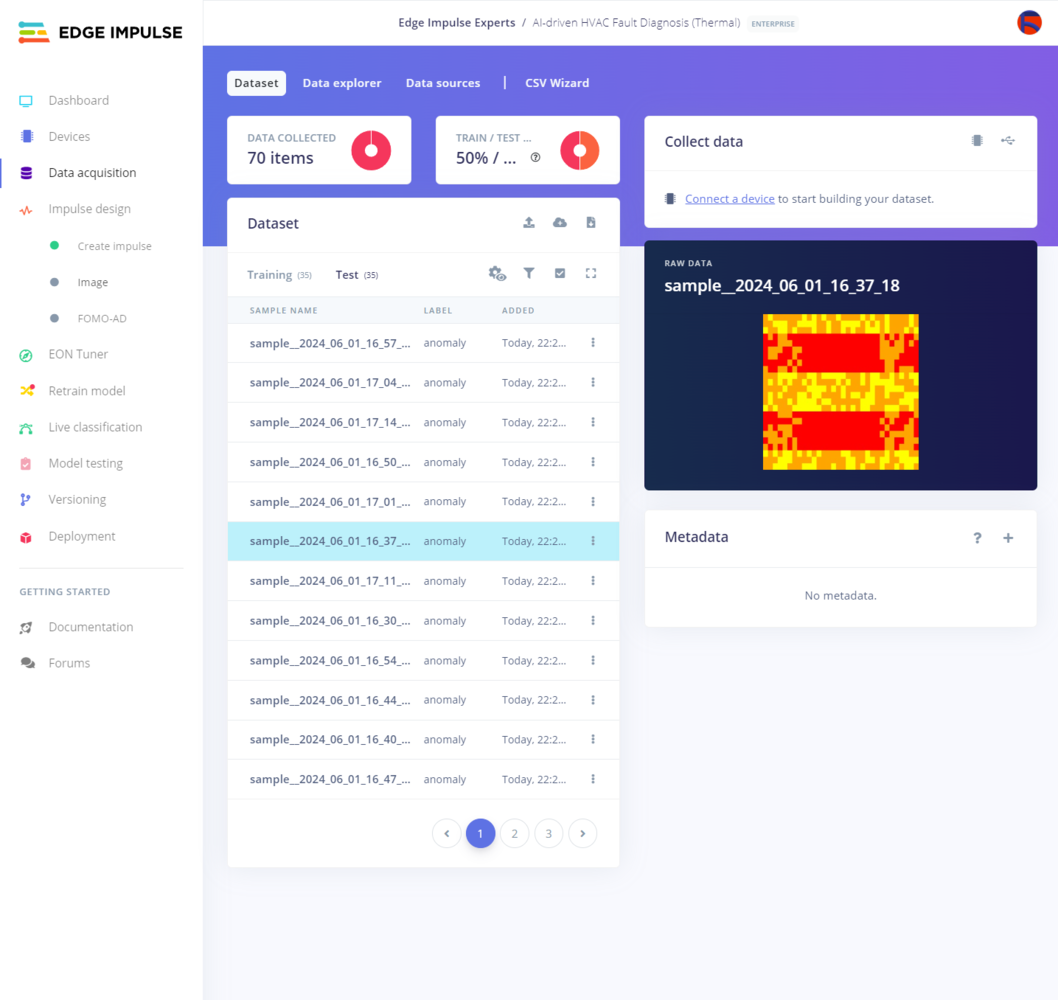
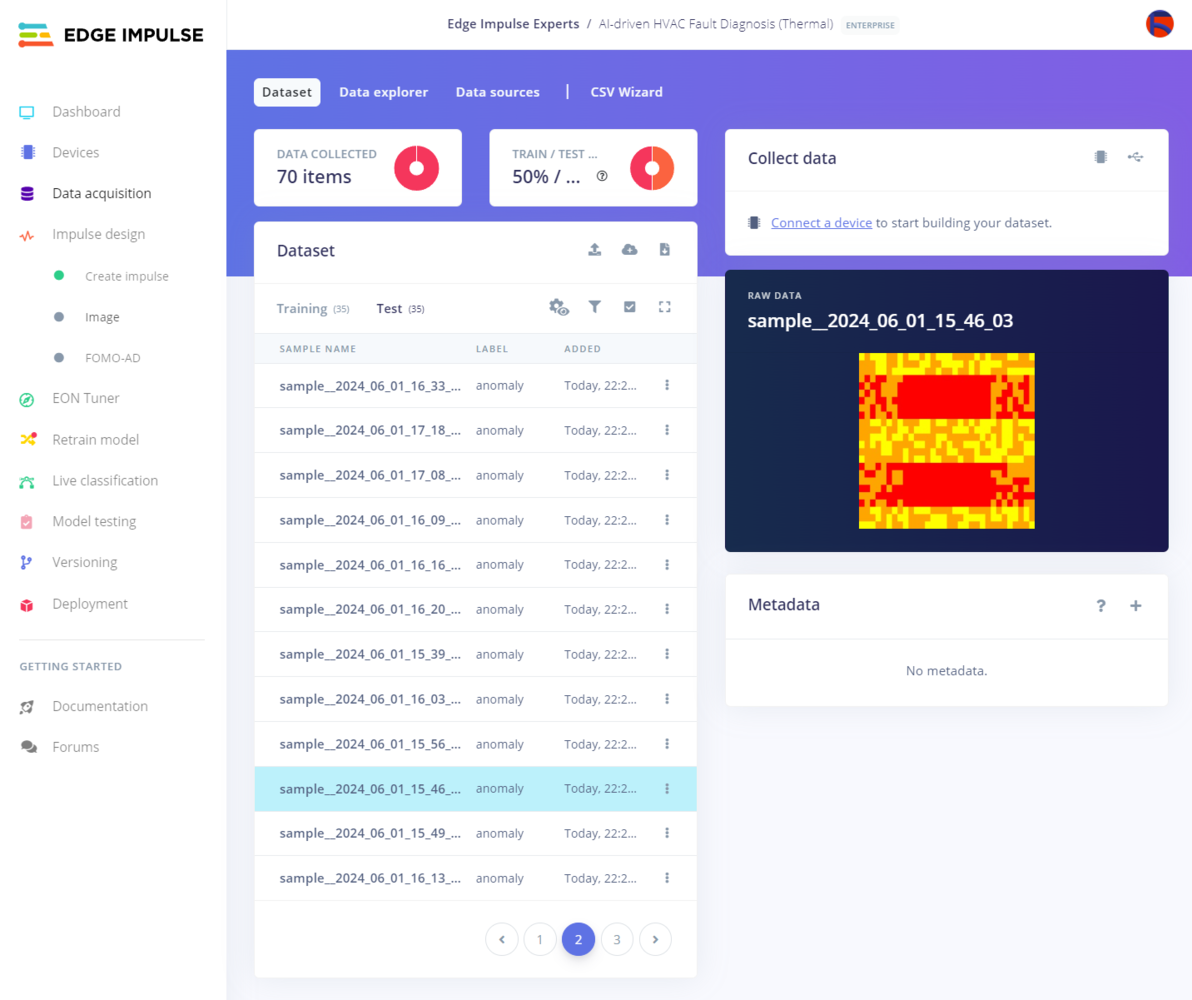
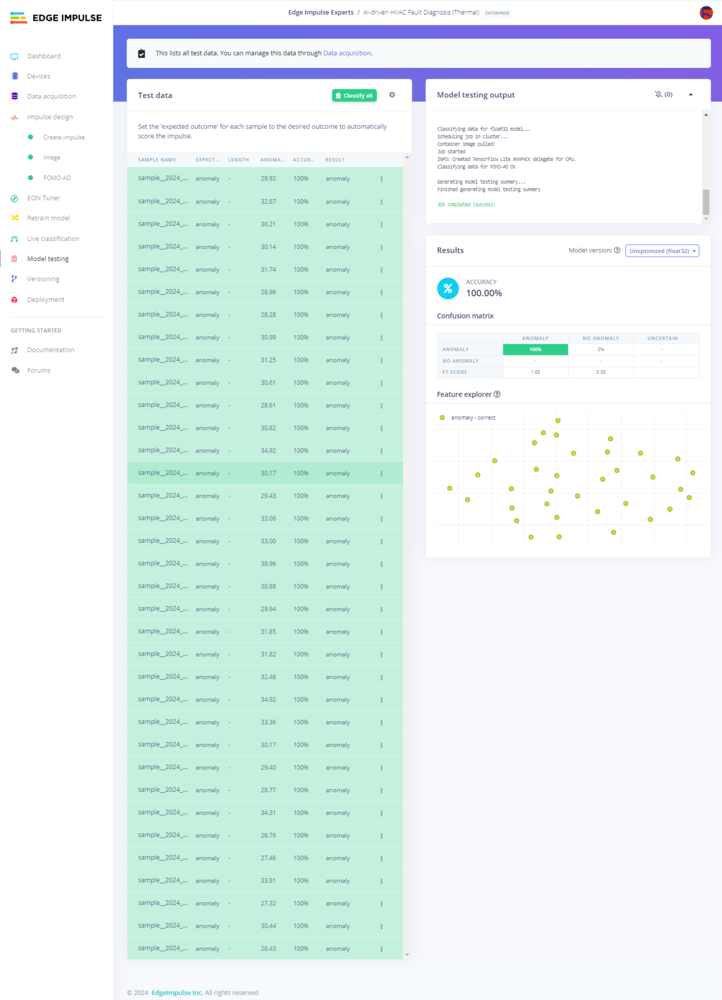
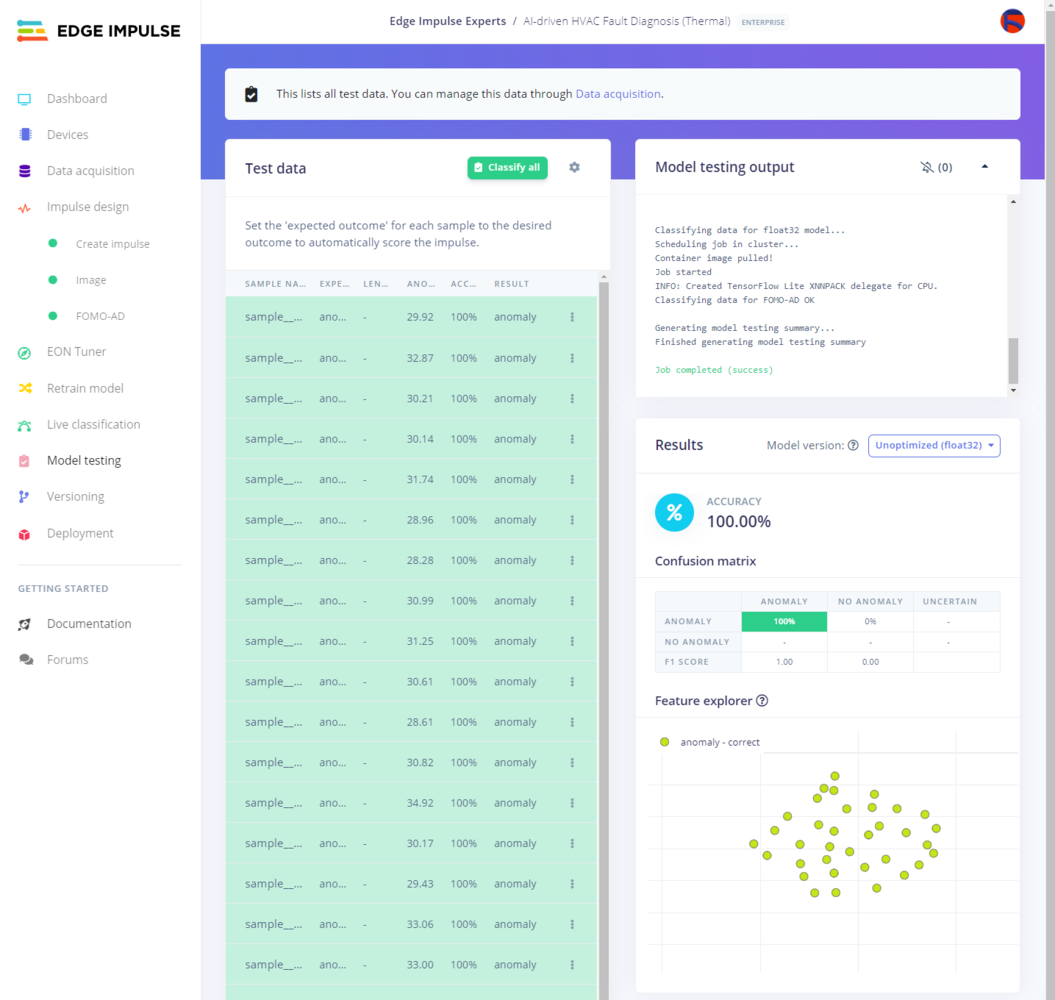
  • anomaly
After training and testing my FOMO-AD visual anomaly detection model, I deployed the model as a Linux (x86_64) application (.eim) and uploaded it to LattePanda Mu. Thus, the web dashboard is capable of diagnosing thermal cooling anomalies based on the specifically produced thermal images by running the visual anomaly detection model on the server (LattePanda Mu) without any additional procedures, reduced accuracy, or latency. In addition to the discussed features, the web dashboard informs the user of the latest system log updates (completed operations) on the home (index) page automatically and sends an SMS to the verified phone number via Twilio so as to notify the user of the latest cooling status. Considering the complex structure of this device based on a customized water-based HVAC system, I decided to design two unique PCBs after testing the prototype connections via breadboards. Since I wanted my PCB designs to represent the equilibrium of cooling fan failures and thermal (heat) malfunctions, I got inspired by two ancient rival Pokémon: Kyogre and Groudon. Finally, in addition to the custom CNC router and coolant reservoir parts, I designed a plethora of complementary 3D parts, from unique PCB encasement to radiator mounts, so as to make the device as robust and compact as possible. To print flexible parts handling water pressure, I utilized a color-changing TPU filament. So, this is my project in a nutshell 😃 Please refer to the following tutorial to inspect in-depth feature, design, and code explanations. :gift::art: Huge thanks to ELECROW for sponsoring this project with their high-quality PCB manufacturing service and for sending me a CrowVision 11.6” TouchScreen Module (1366x768). 🚀🤖 Furthermore, you can check the brand-new ELECROW project community to gain insight into the manufacturing process of my PCB designs. :gift::art: Huge thanks to Seeed Studio for sponsoring these products: ⭐ XIAO ESP32C6 | Inspect ⭐ Grove - MLX90641 Thermal Imaging Camera (16x12 IR Array w/ 110° FOV) | Inspect :gift::art: Huge thanks to DFRobot for sponsoring these products: ⭐ Fermion: I2S MEMS Microphone | Inspect ⭐ LattePanda Mu | Inspect ⭐ Lite Carrier Board for LattePanda Mu | Inspect :gift::art: Also, huge thanks to Anycubic for sponsoring an Anycubic Kobra 2.
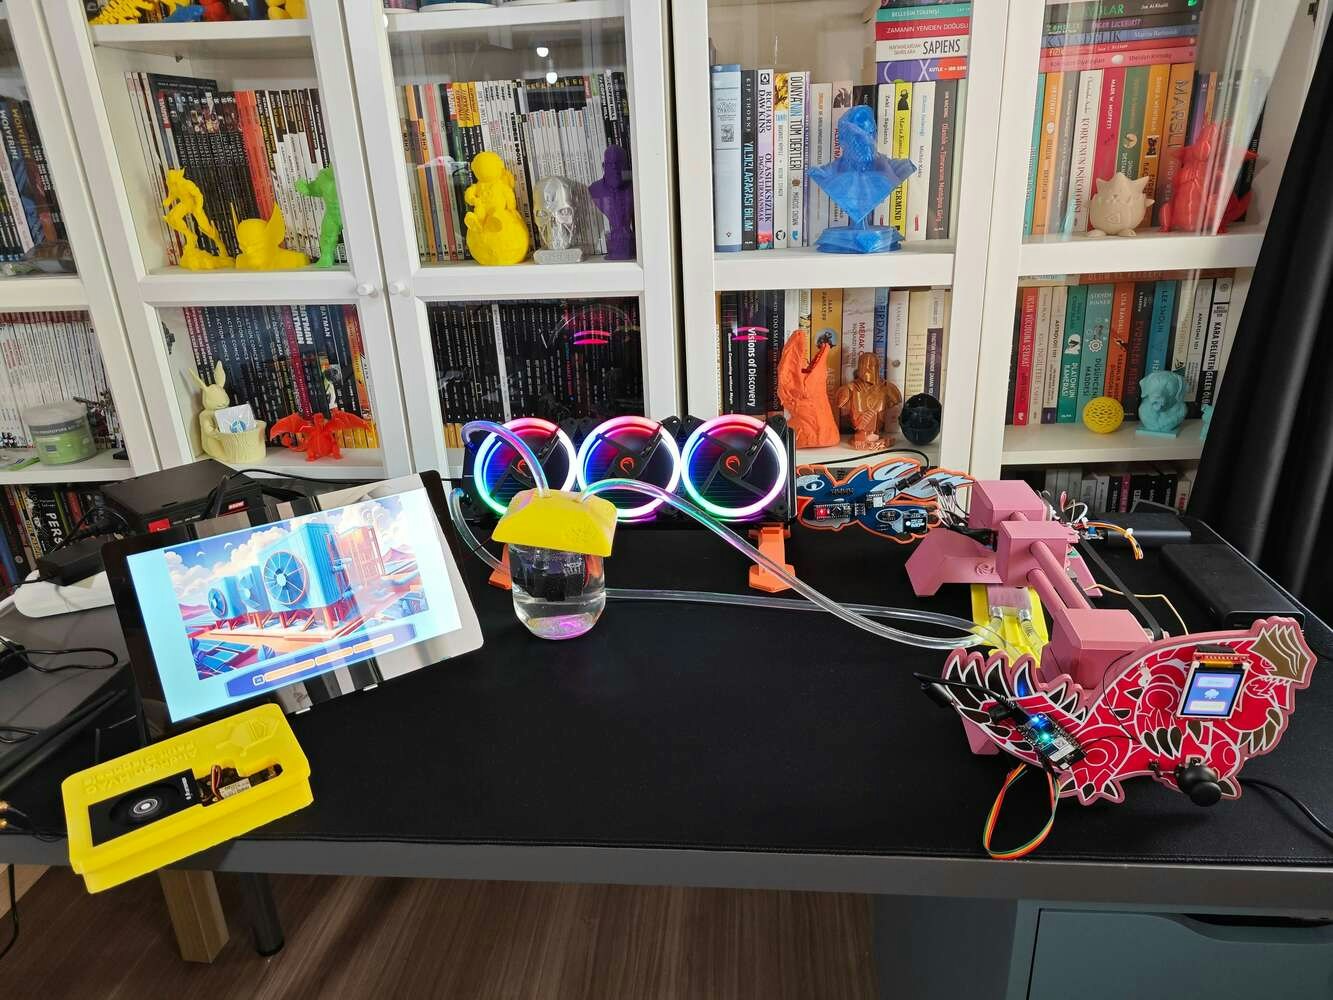
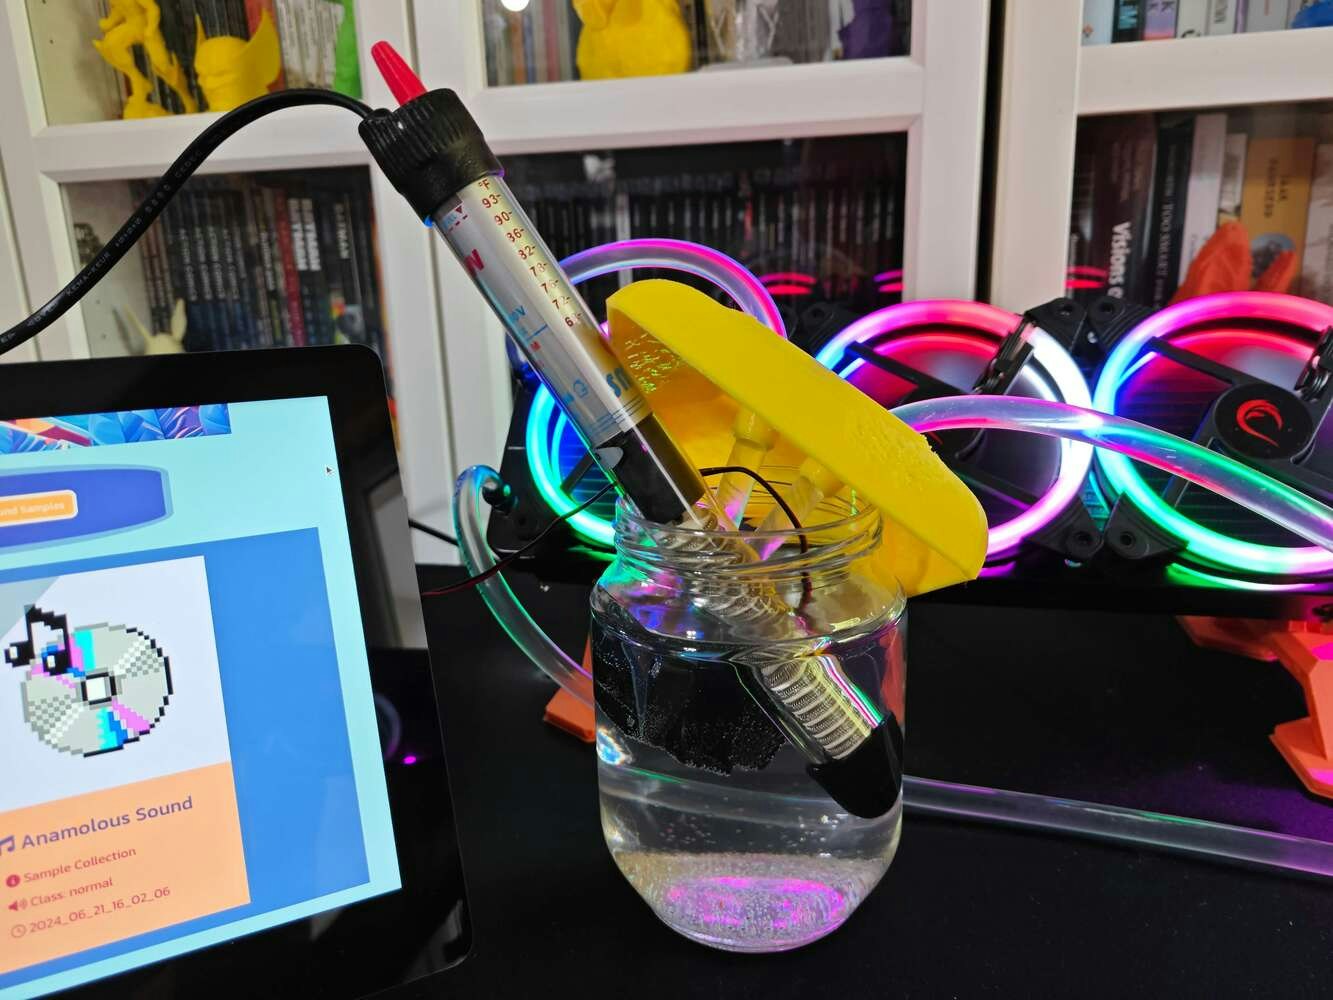
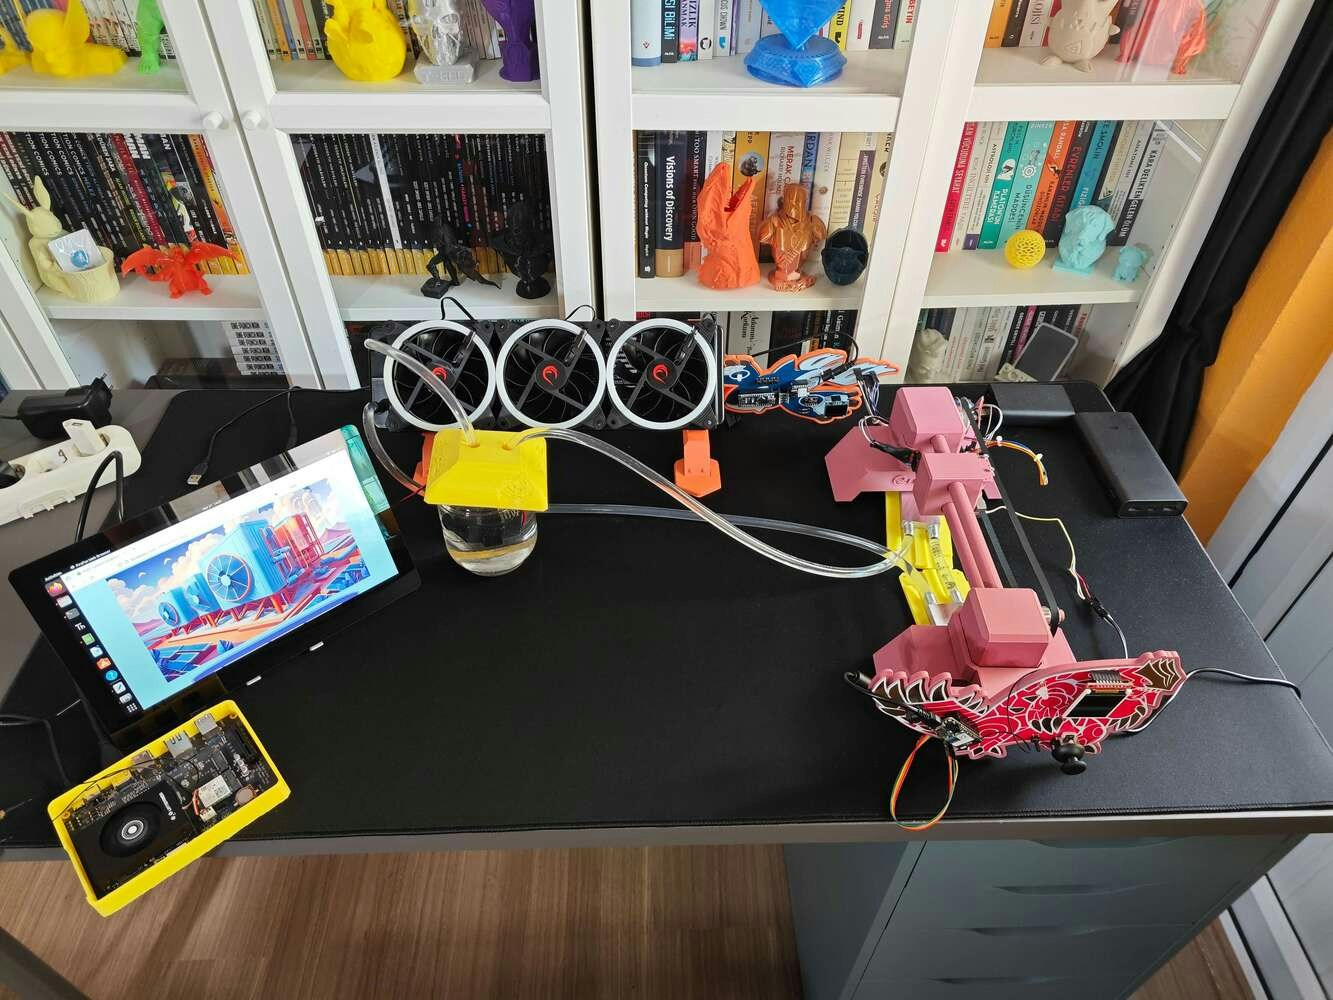
Complete HVAC rig collecting a thermal image sample with the CNC camera and dashboard active

1


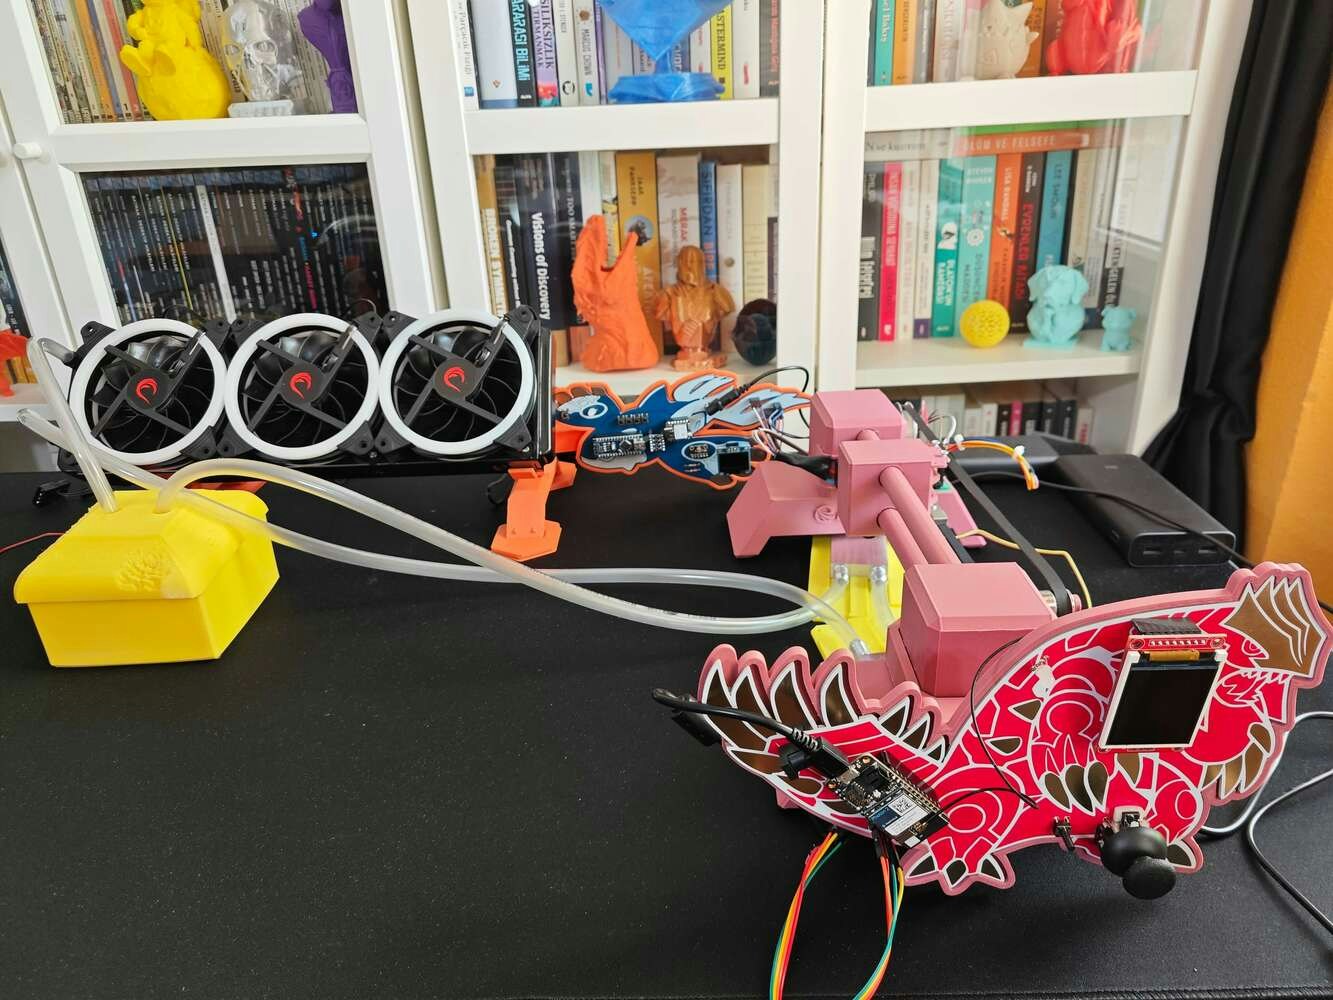
Full HVAC monitoring system assembly step 18, joining parts in an exploded view with the completed build in place alongside the radiator, reservoir, CNC rig, and dashboard

2


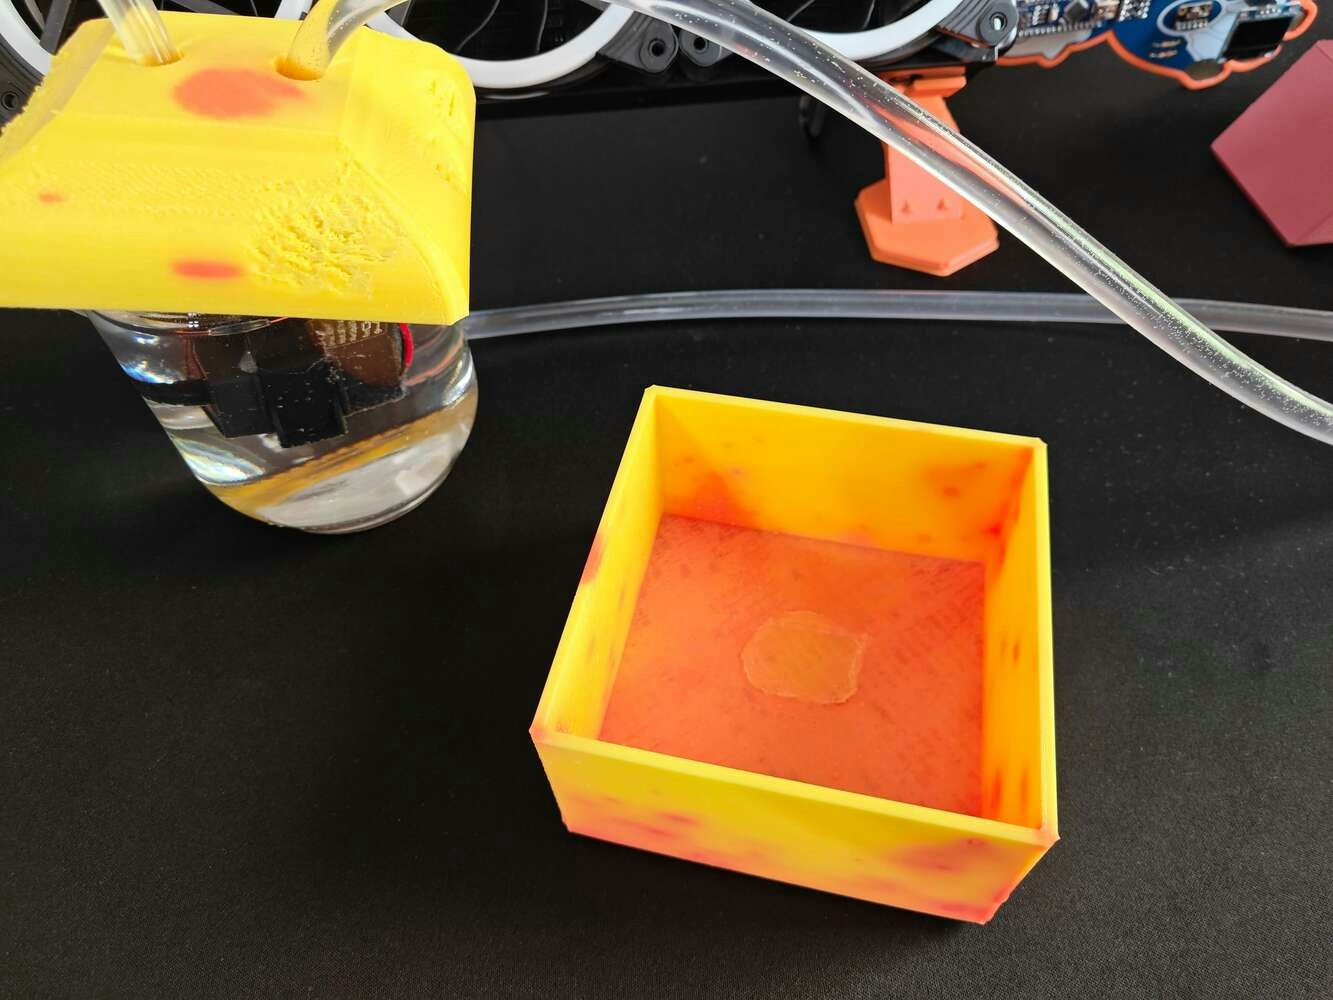
Full HVAC monitoring system assembly step 13, mounting parts in a side view with the radiator, reservoir, CNC rig, and dashboard

3


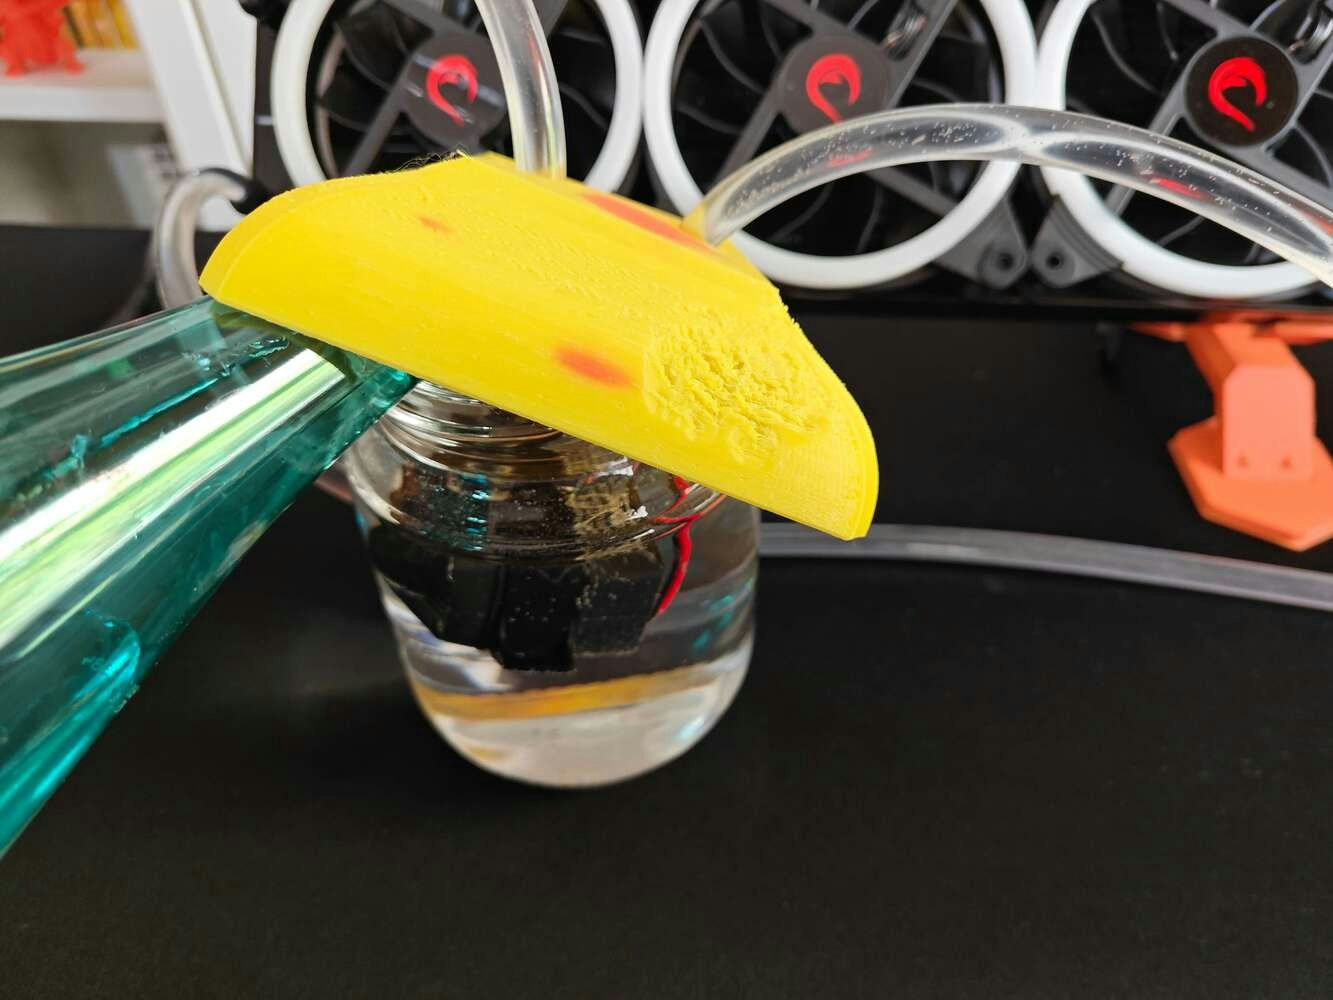
Full HVAC monitoring system assembly step 6, reinforcing parts in a mounted view with the radiator, reservoir, CNC rig, and dashboard

4


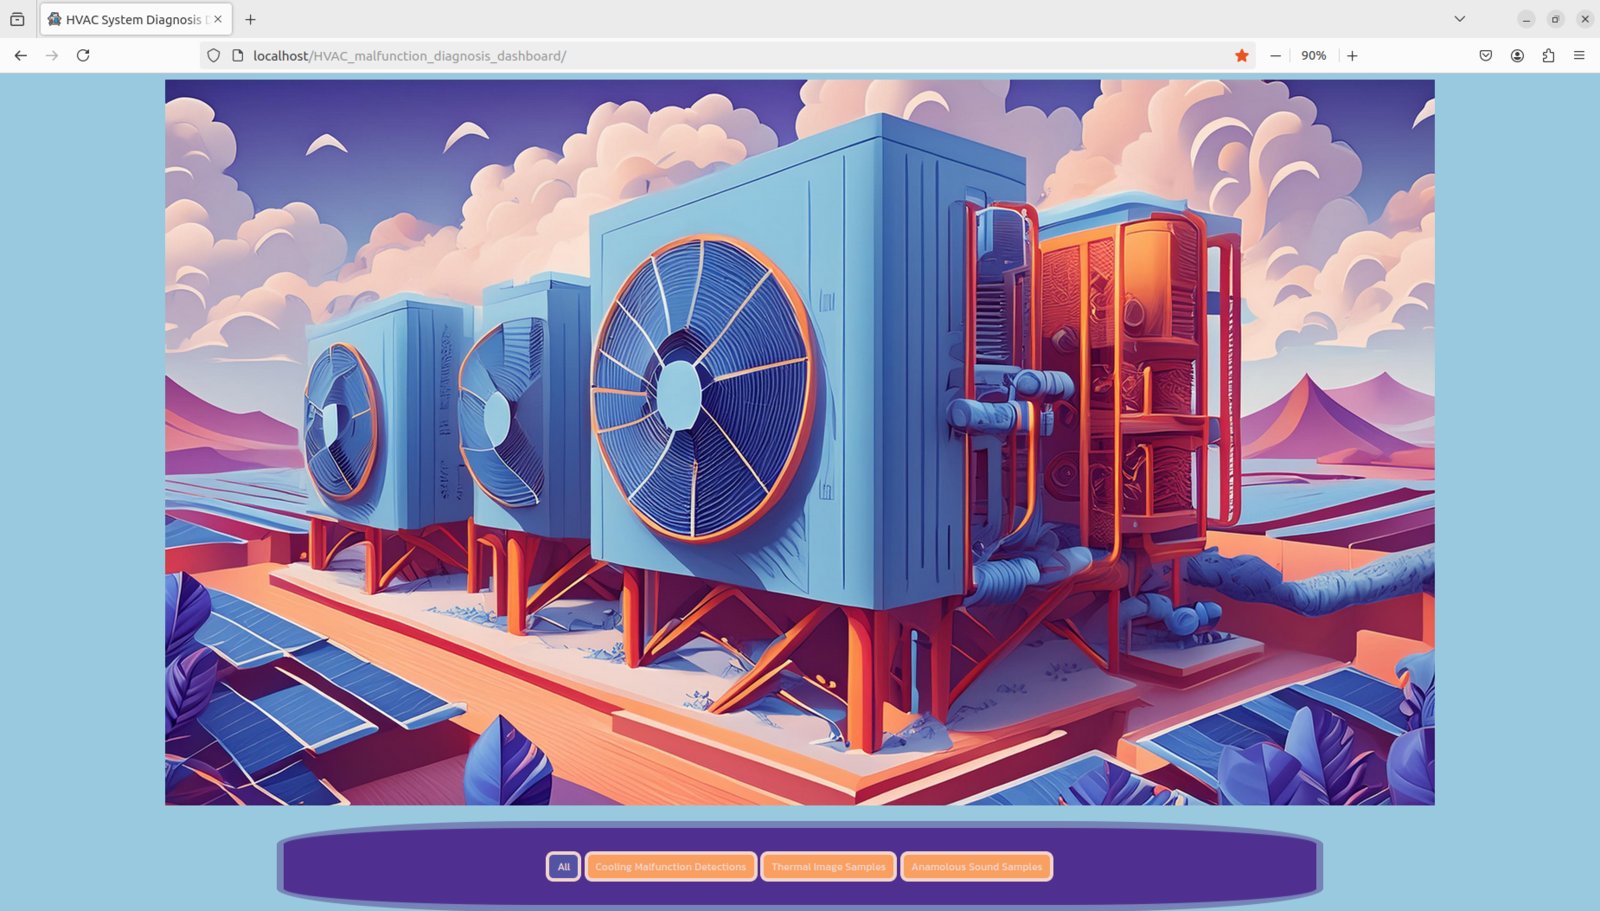
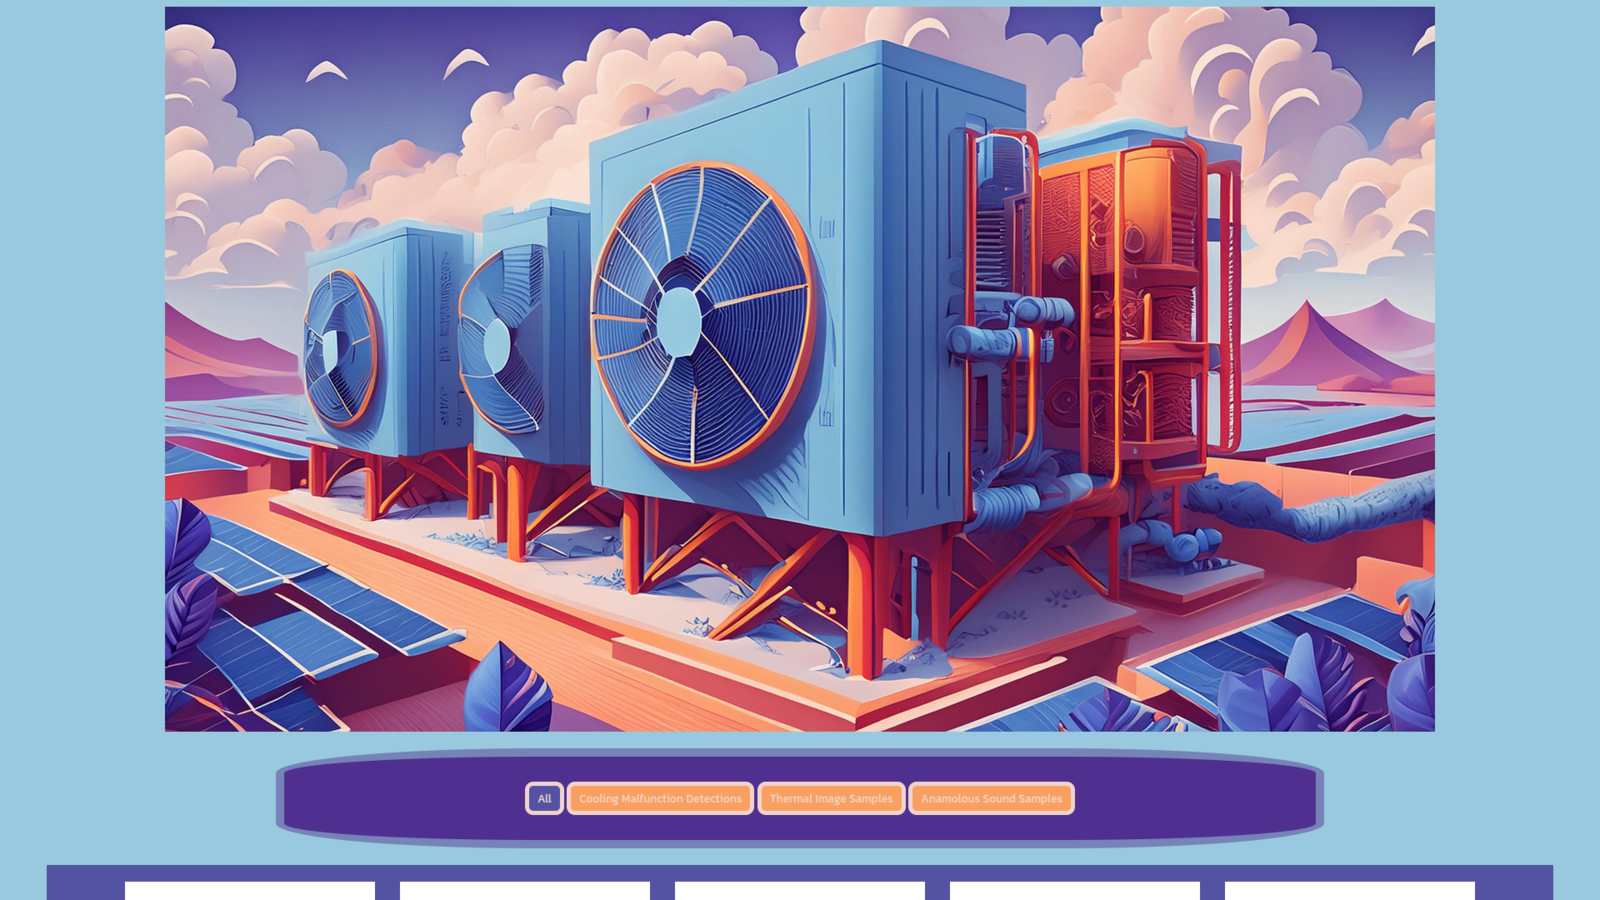
Dashboard home page showing HVAC artwork and category filter buttons for system logs

5


Thermal image samples page listing generated HVAC thermal captures for download

6


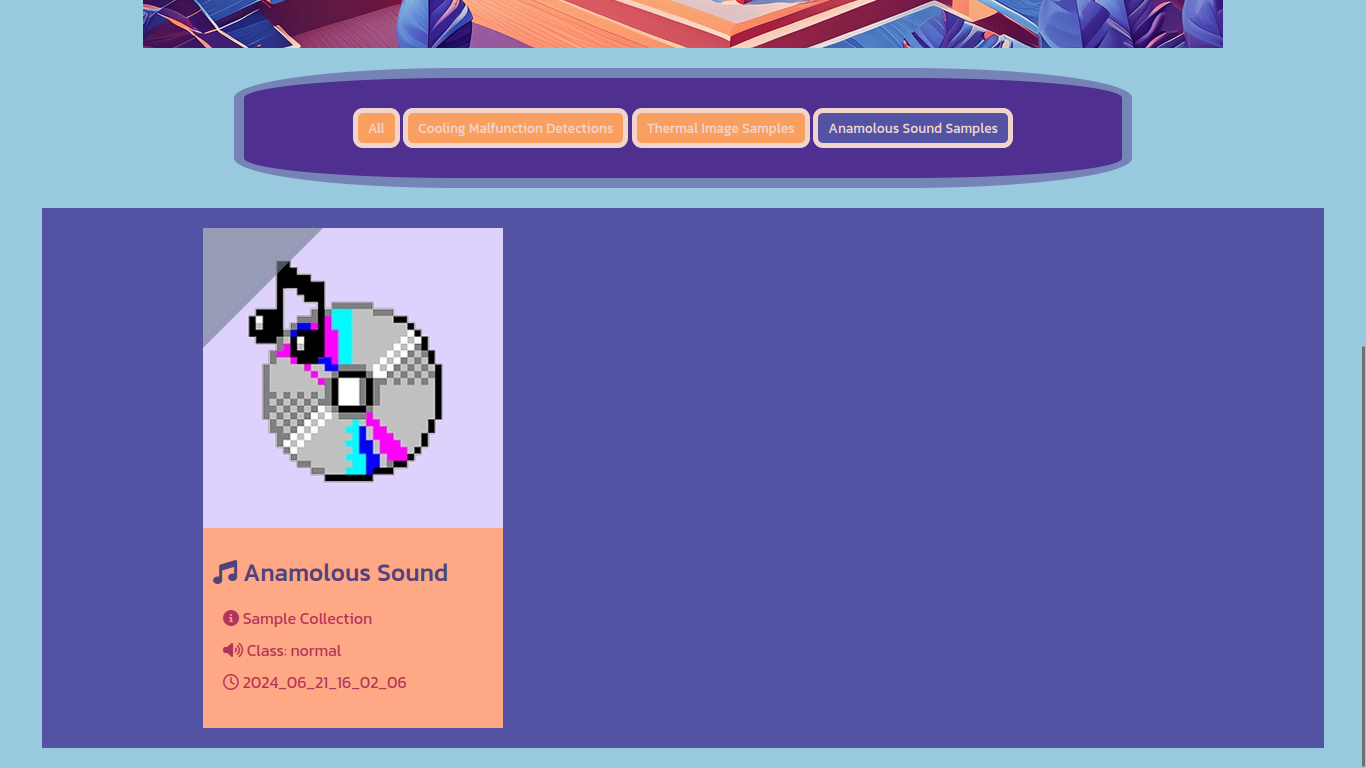
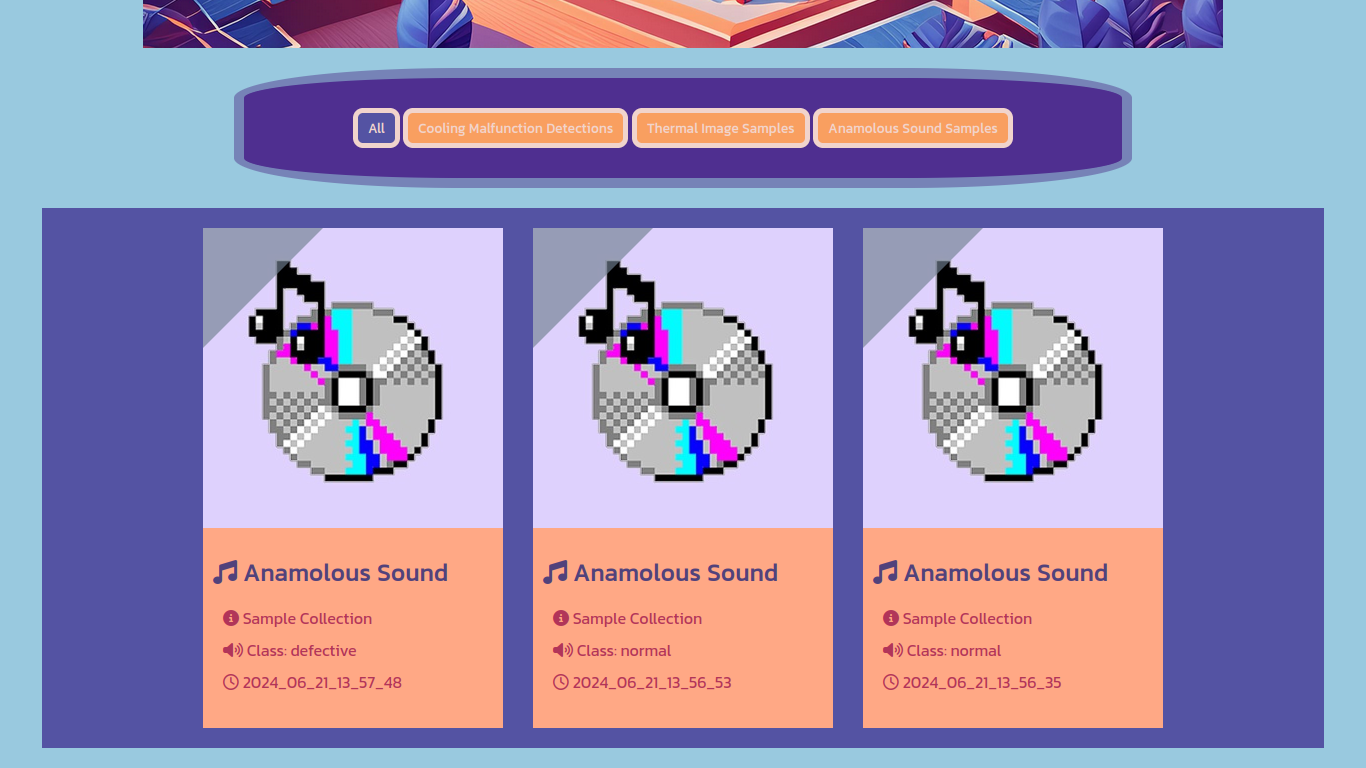
Anomalous sound samples page listing converted WAV files and sample metadata

7


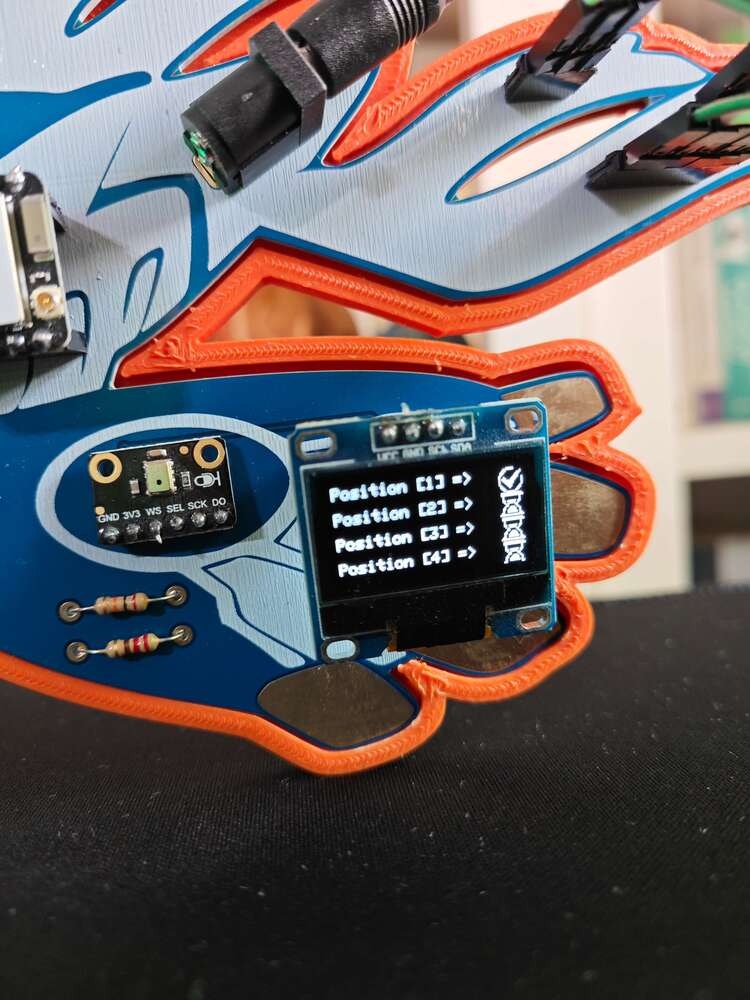
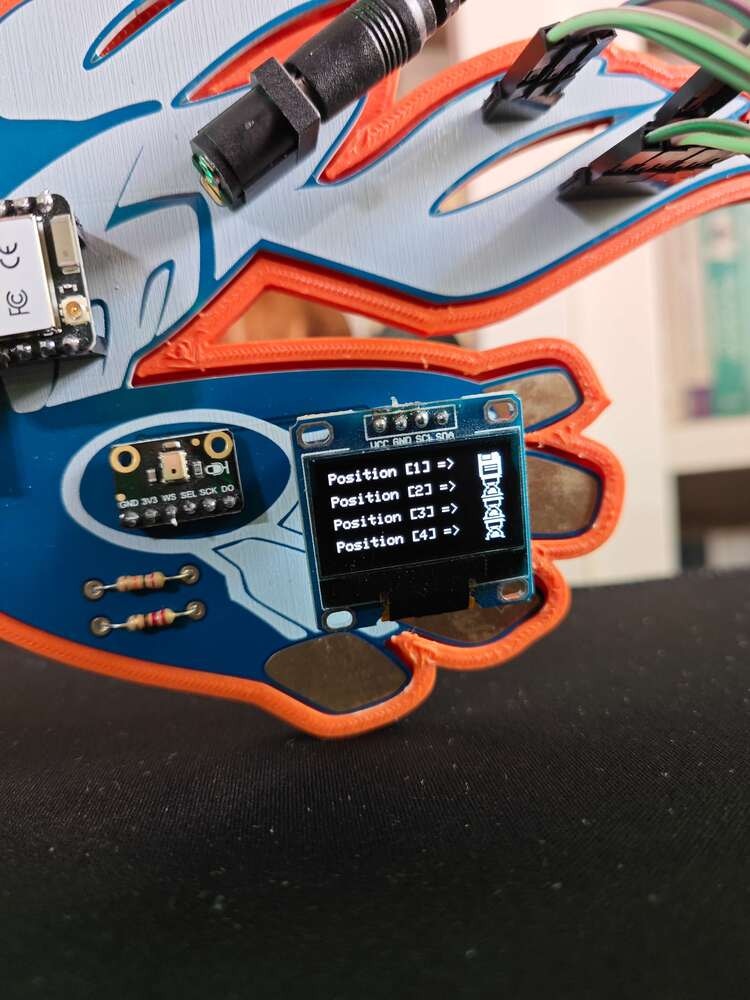
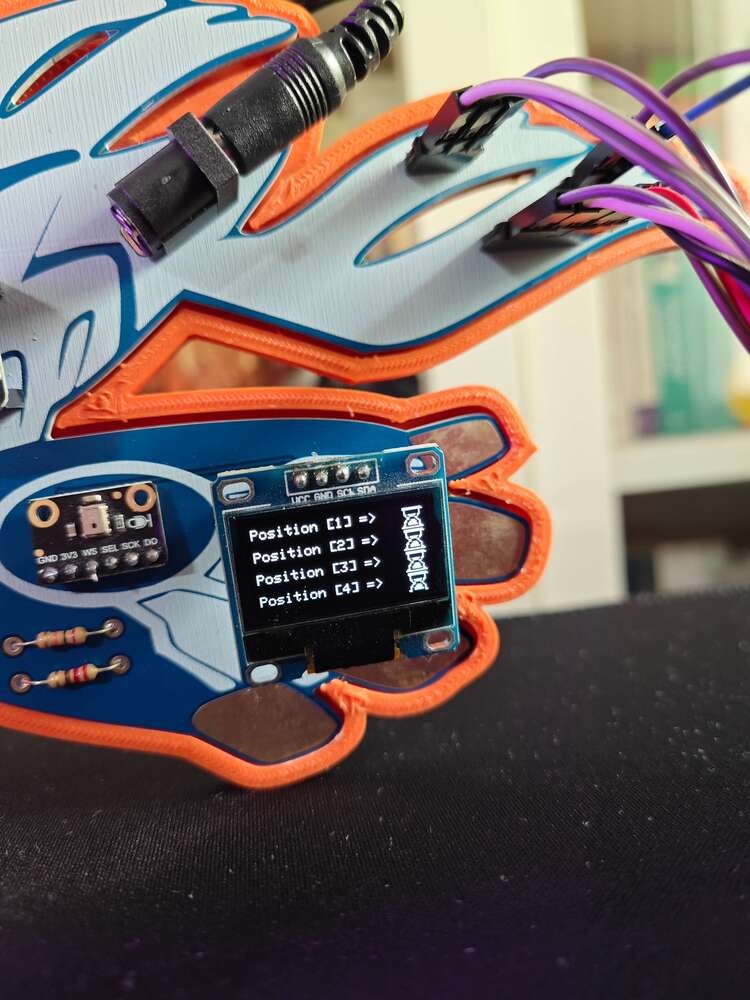
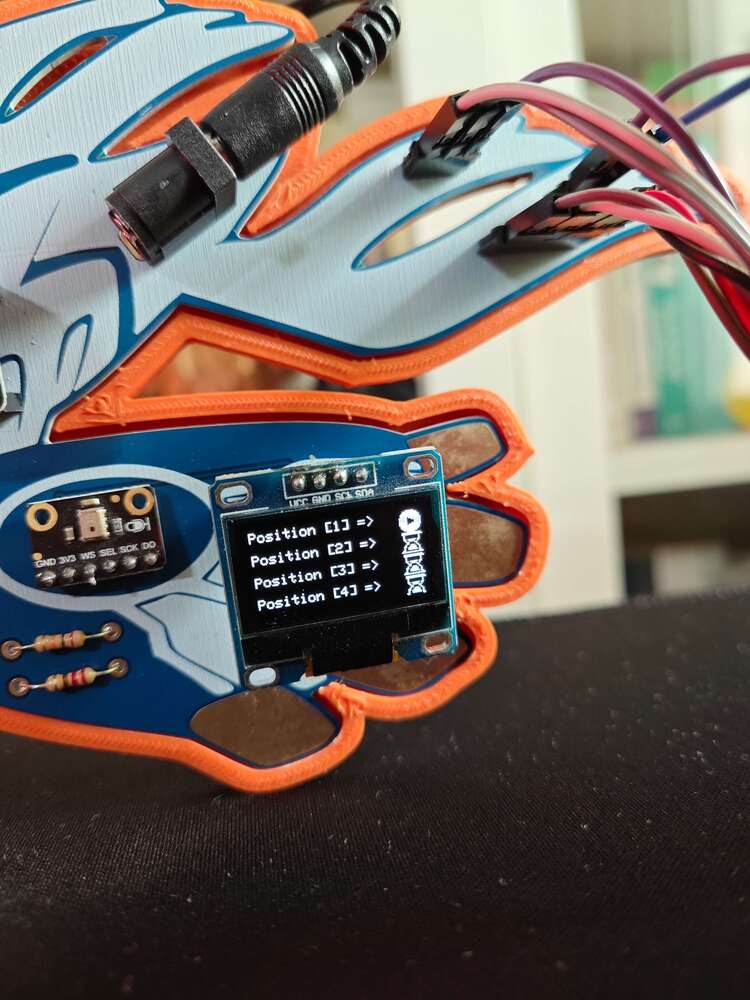
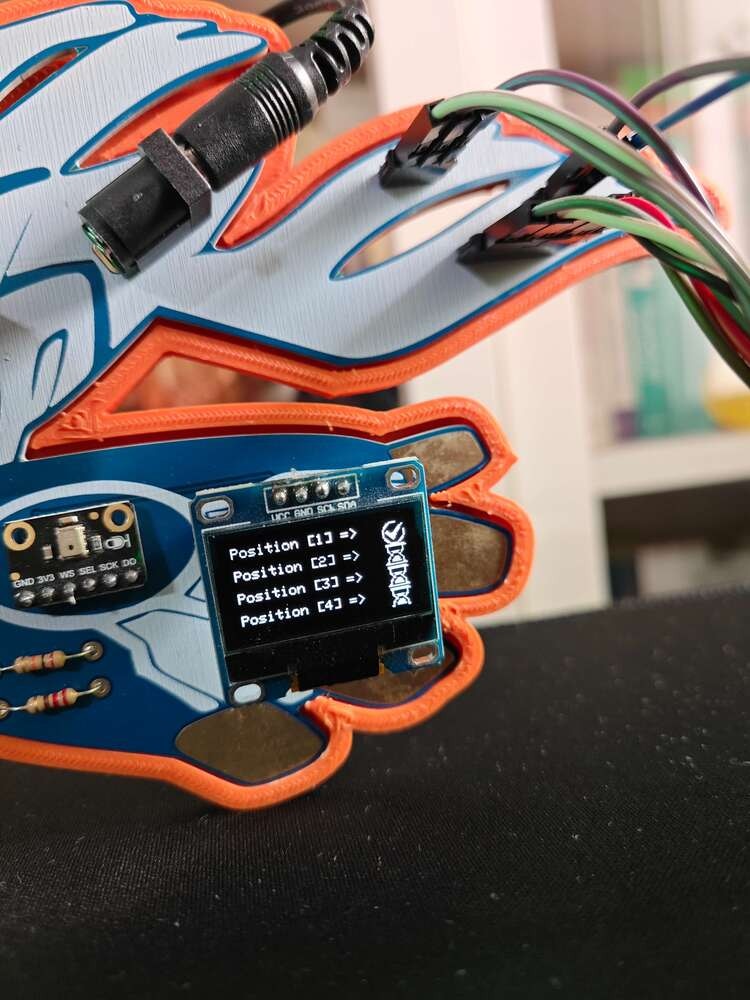
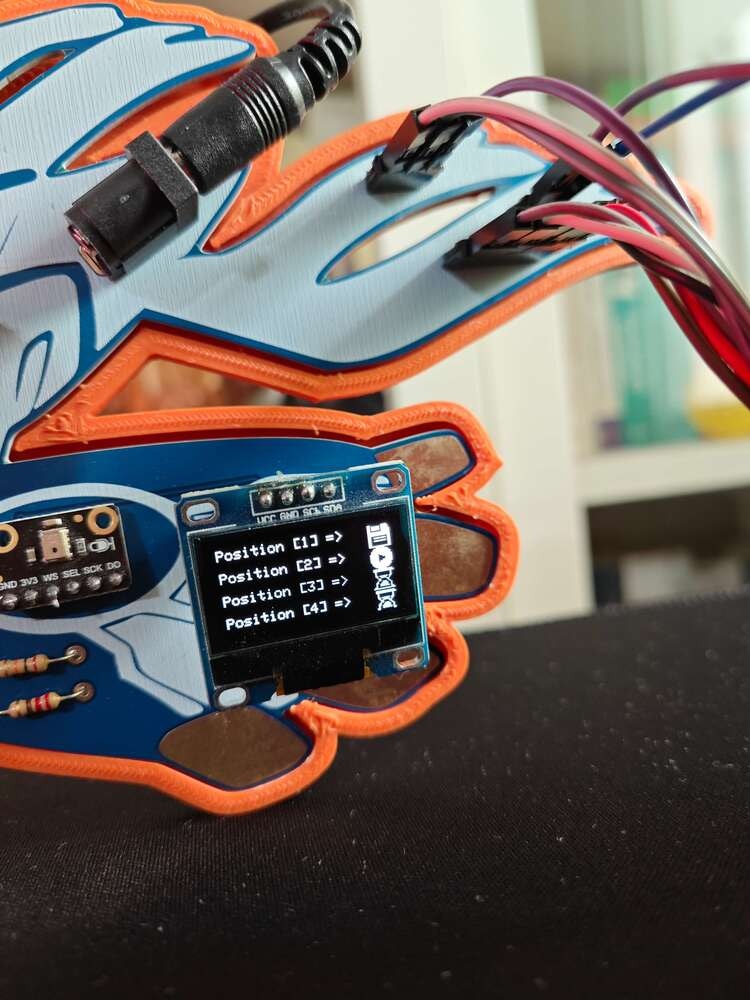
OLED menu with the highlighted option changed using the control buttons

8


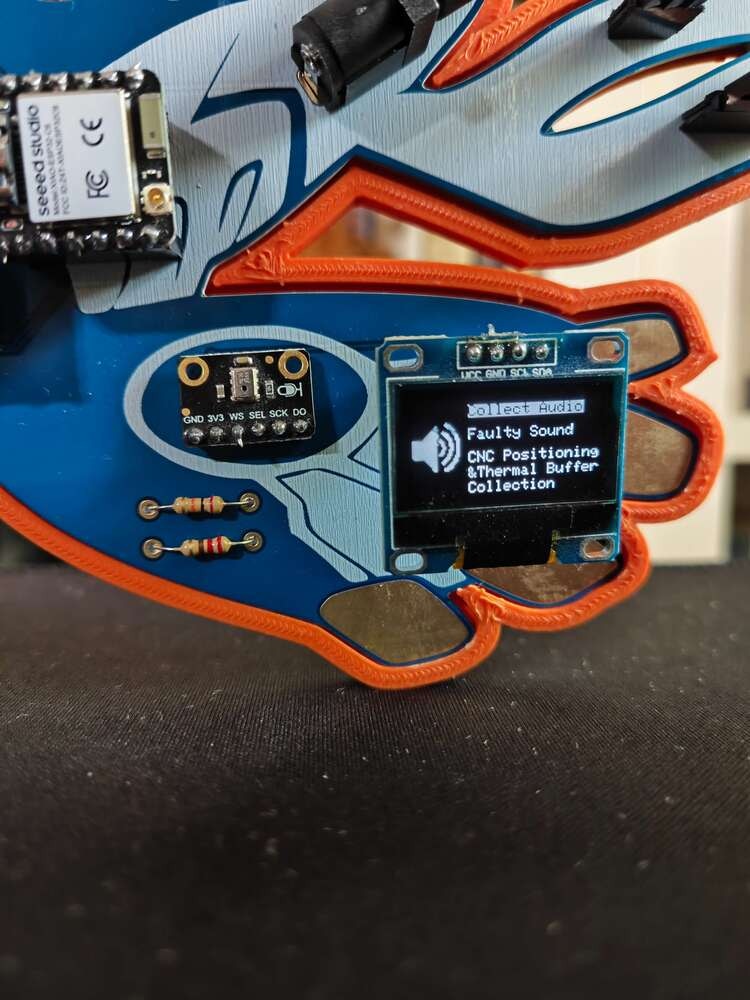
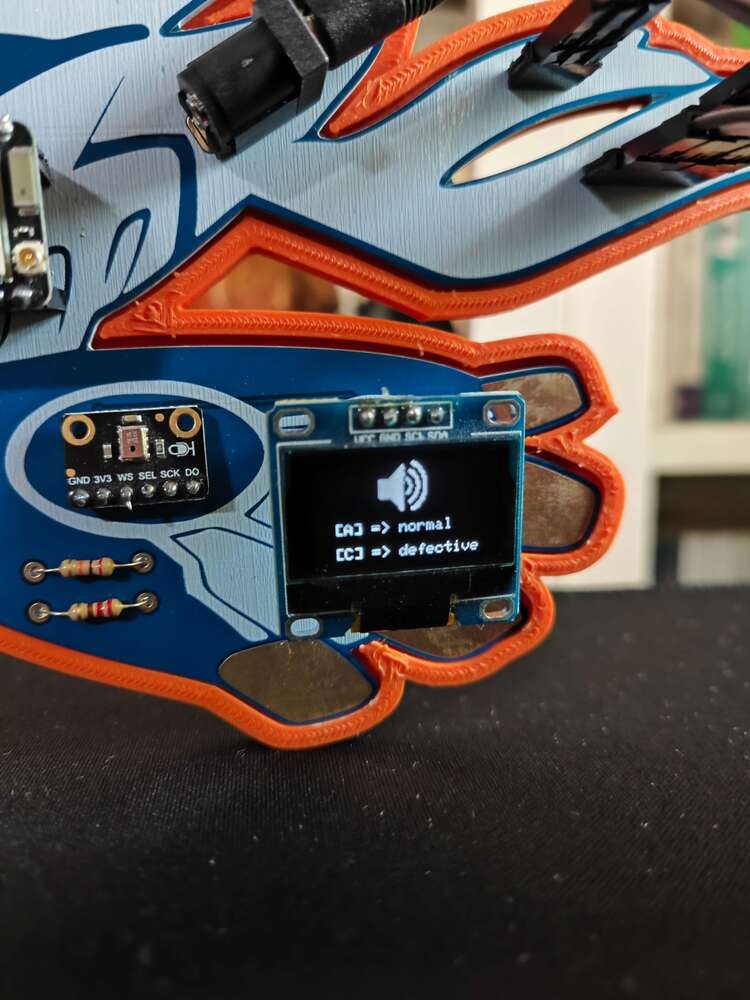
Collect Audio screen listing normal and defective button choices

9


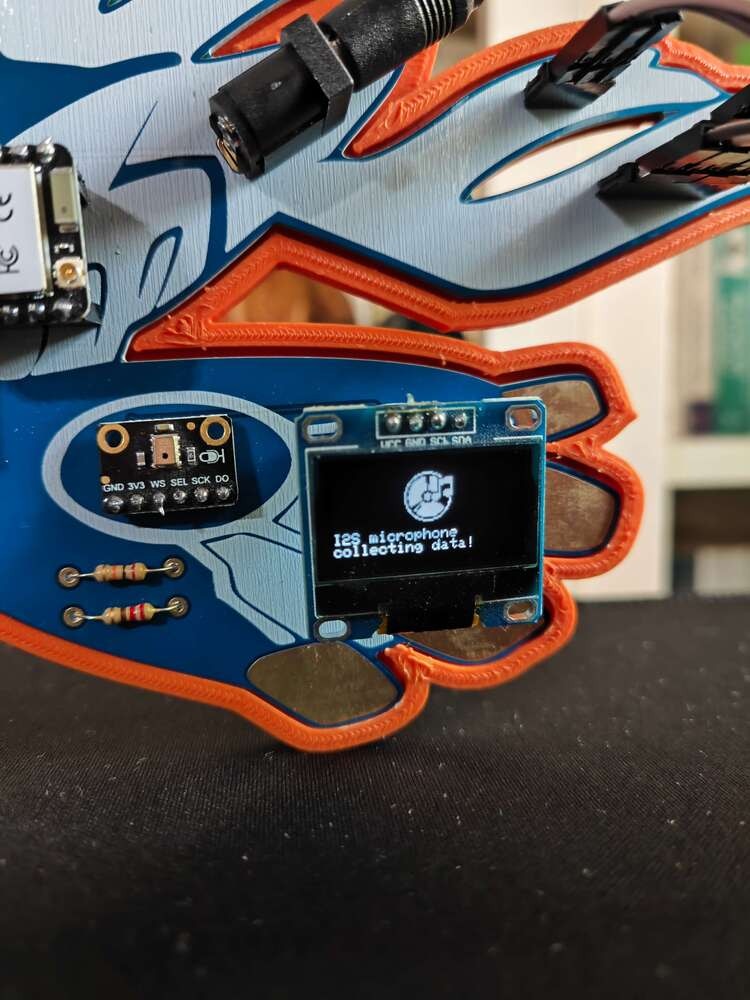
OLED status screen checking the I2S microphone before sampling

10


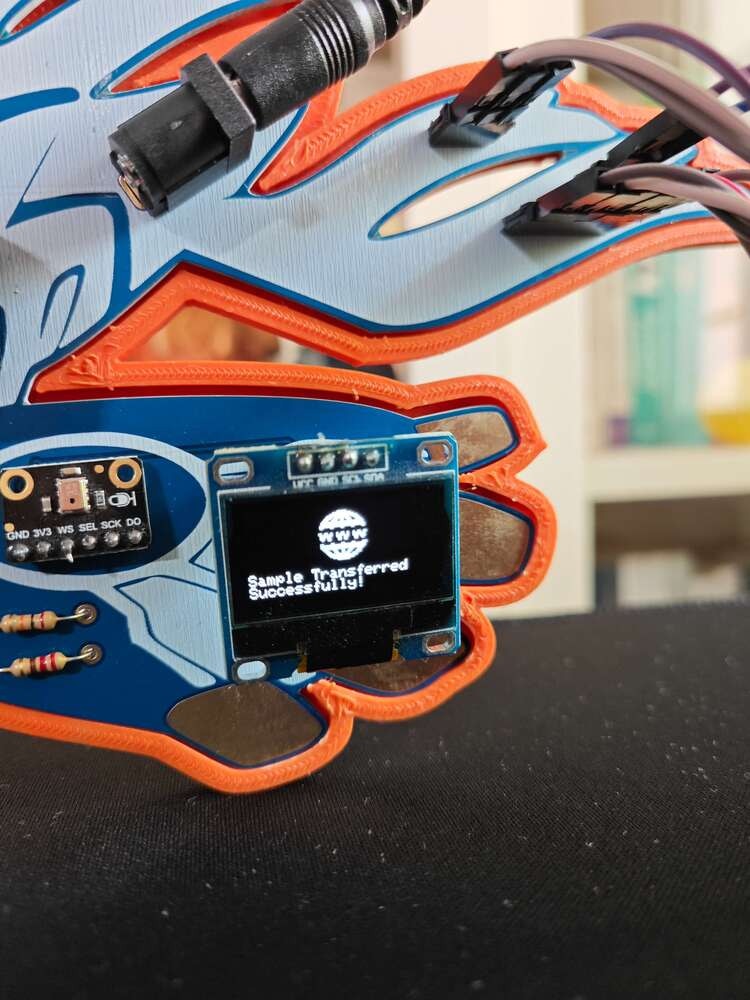
OLED success screen after transferring the raw audio sample to the dashboard

11


Dashboard audio sample entry after the WAV conversion script finishes

12


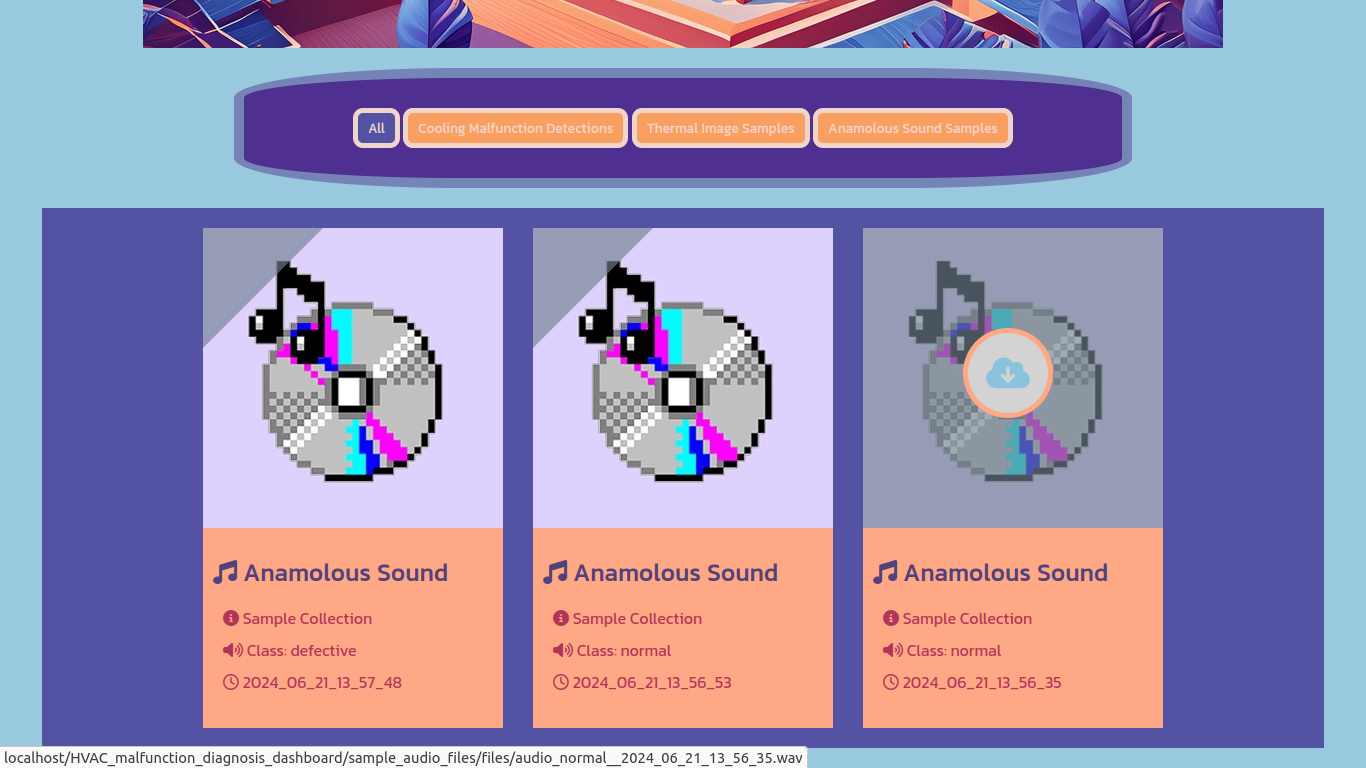
Audio samples dashboard entry showing converted normal and defective fan recordings

13


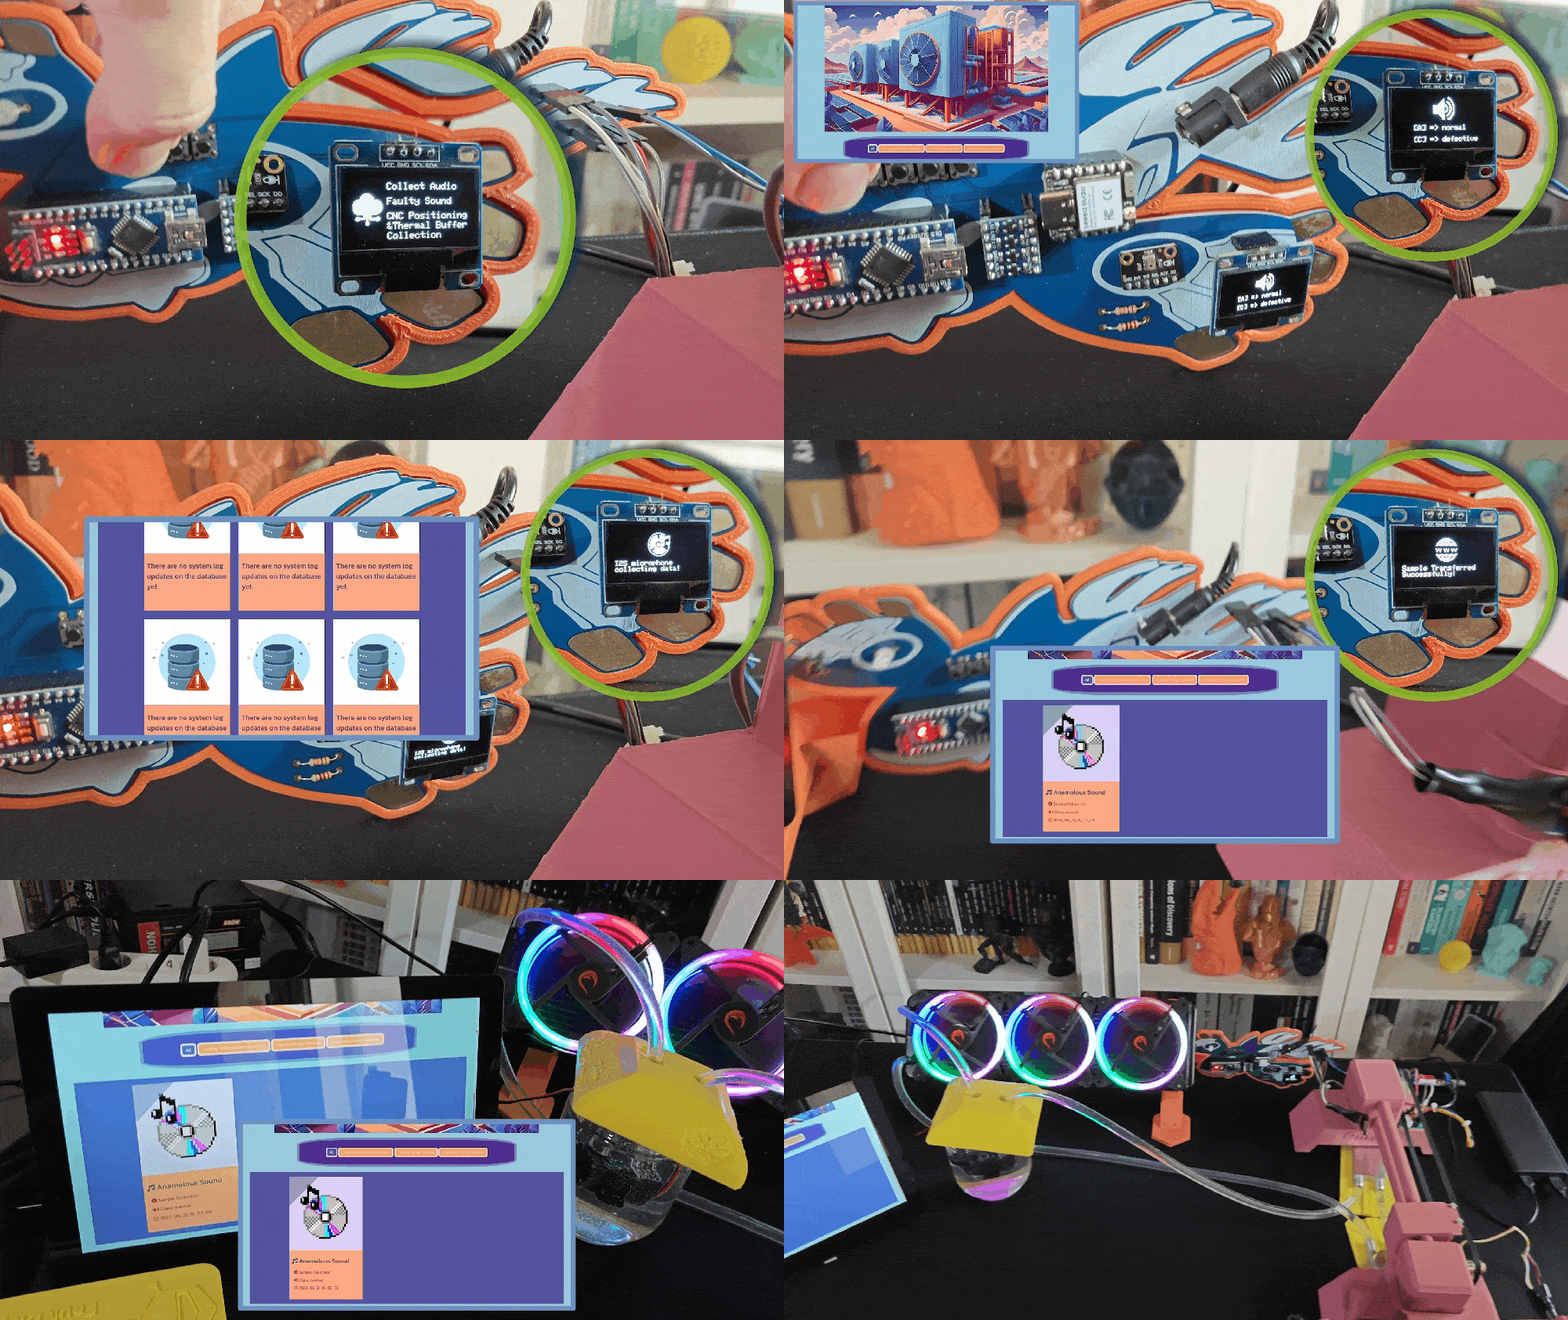
Animation of XIAO ESP32C6 collecting fan audio and the dashboard saving the converted sample

14


Animation of the CNC thermal camera head homing against the micro switch

15


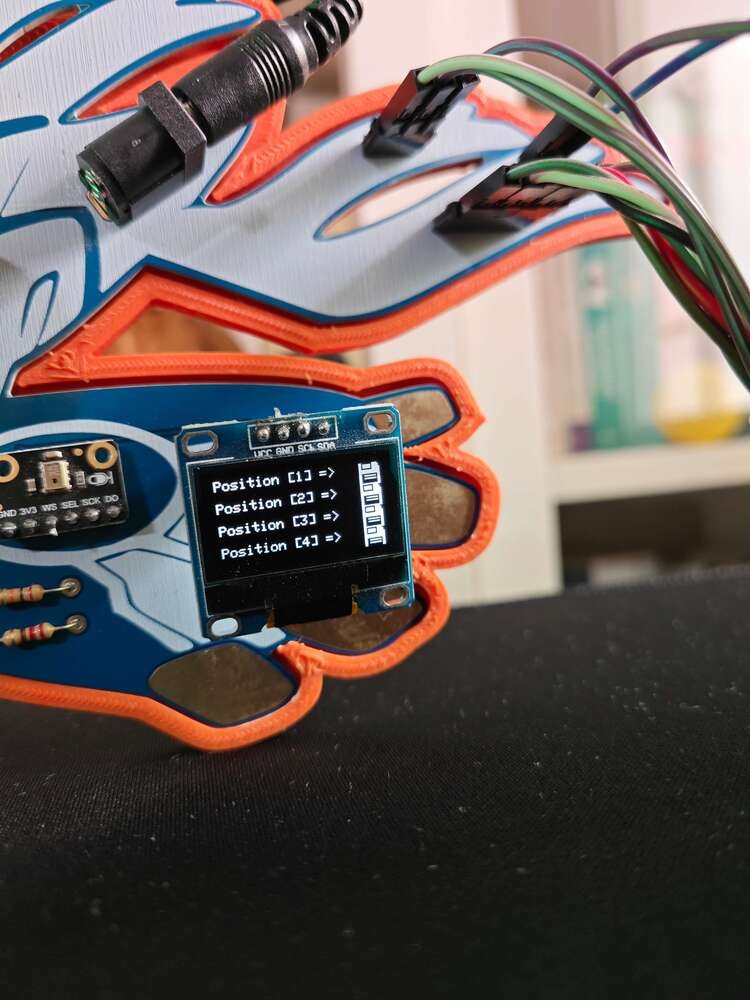
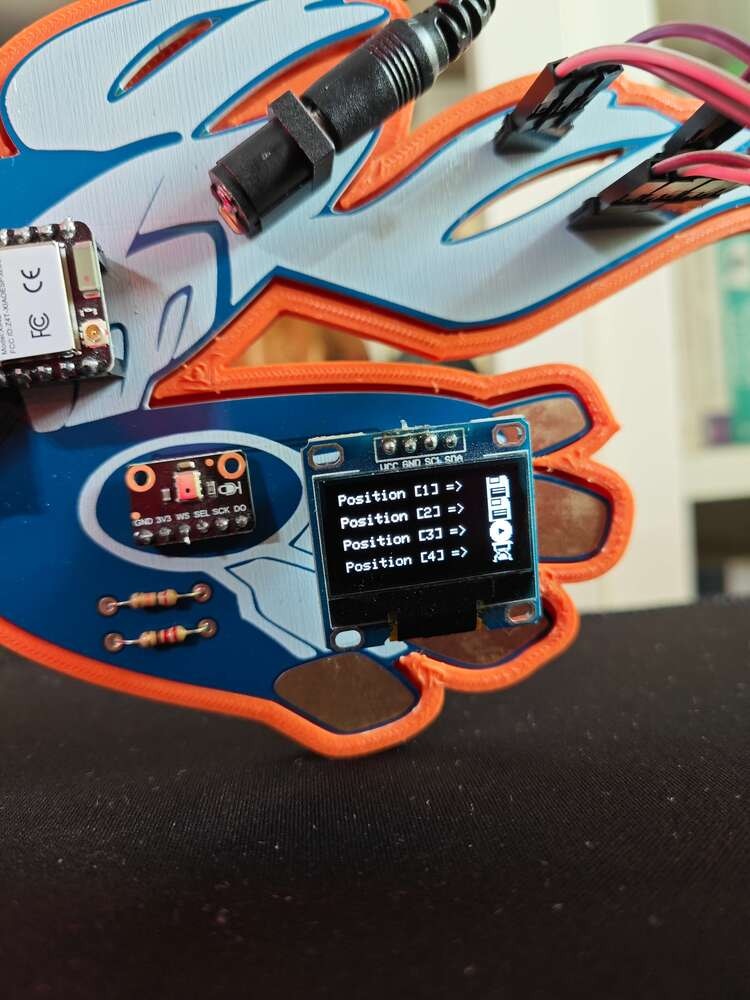
OLED CNC positioning screen showing the first point status indicator

16


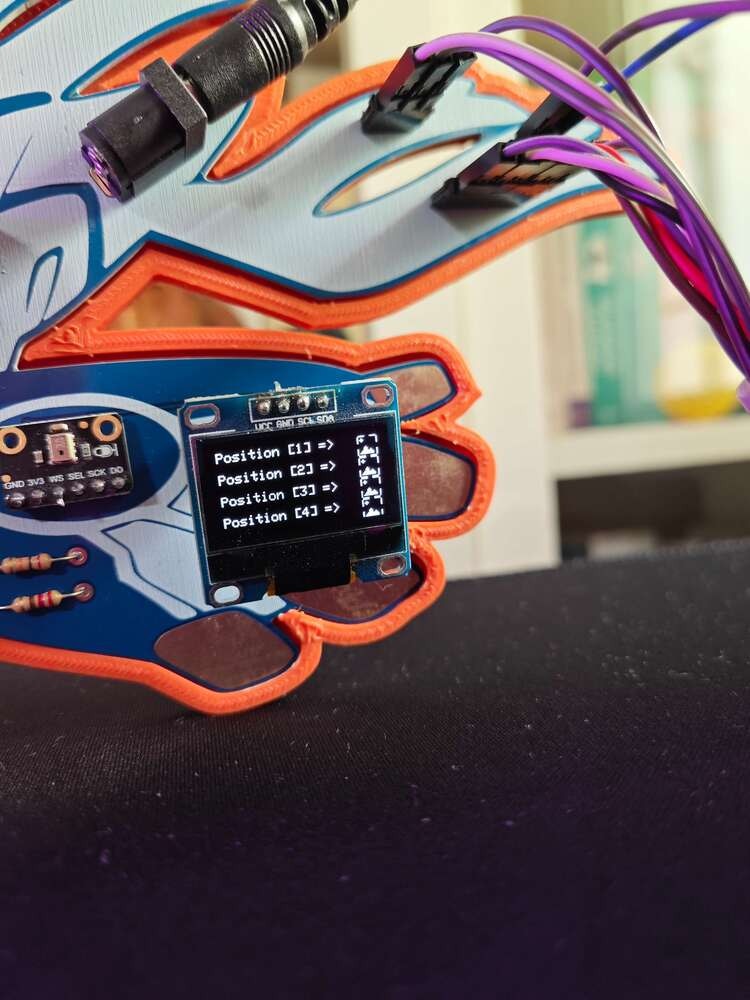
OLED CNC positioning screen after the first coordinate update

17


CNC camera carriage moving toward the next aluminum block scan point

18


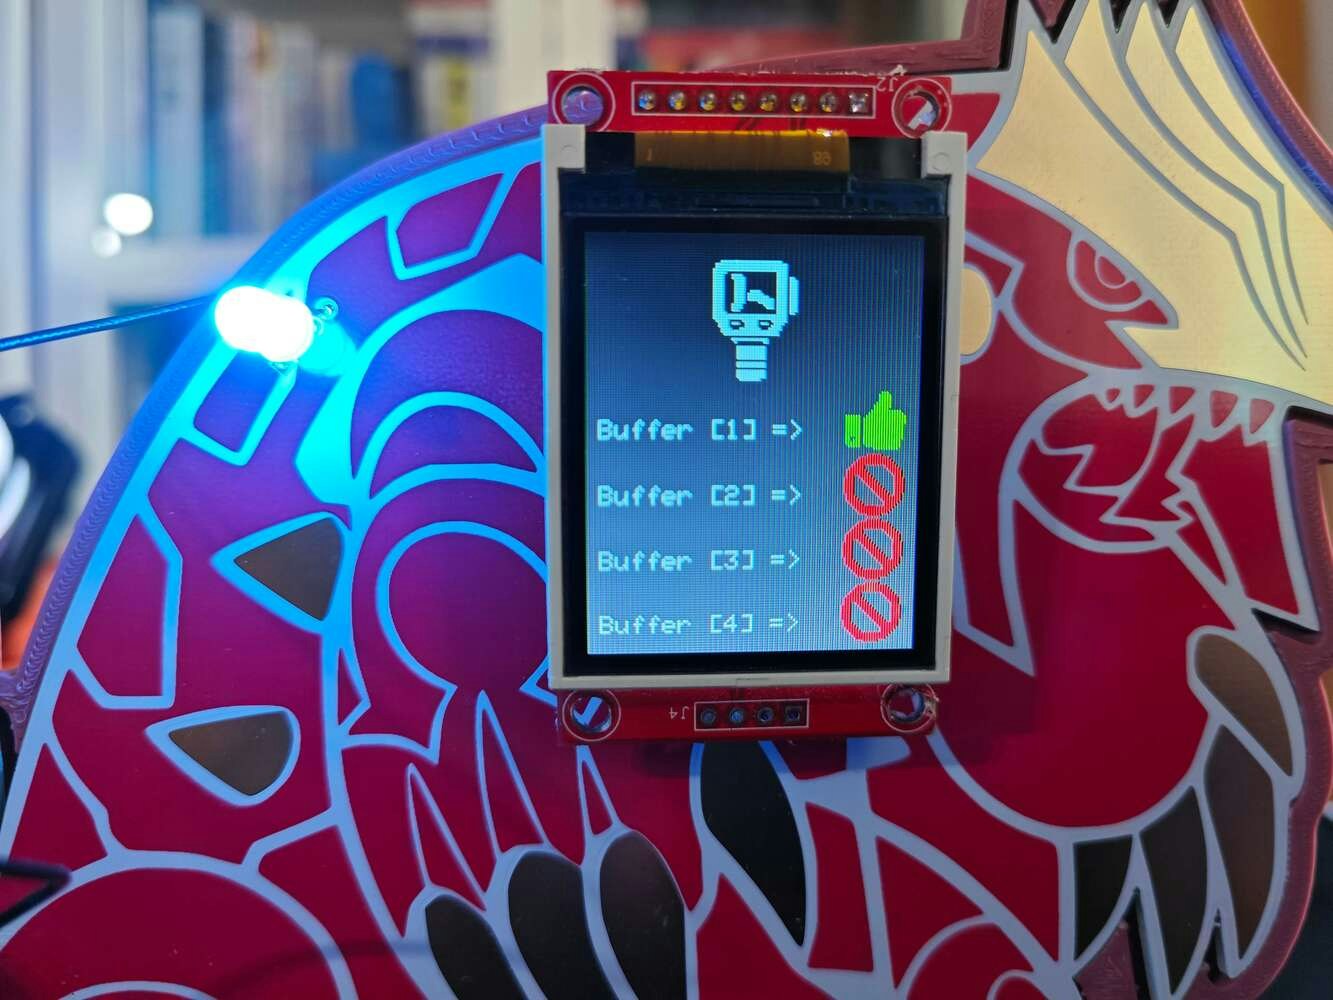
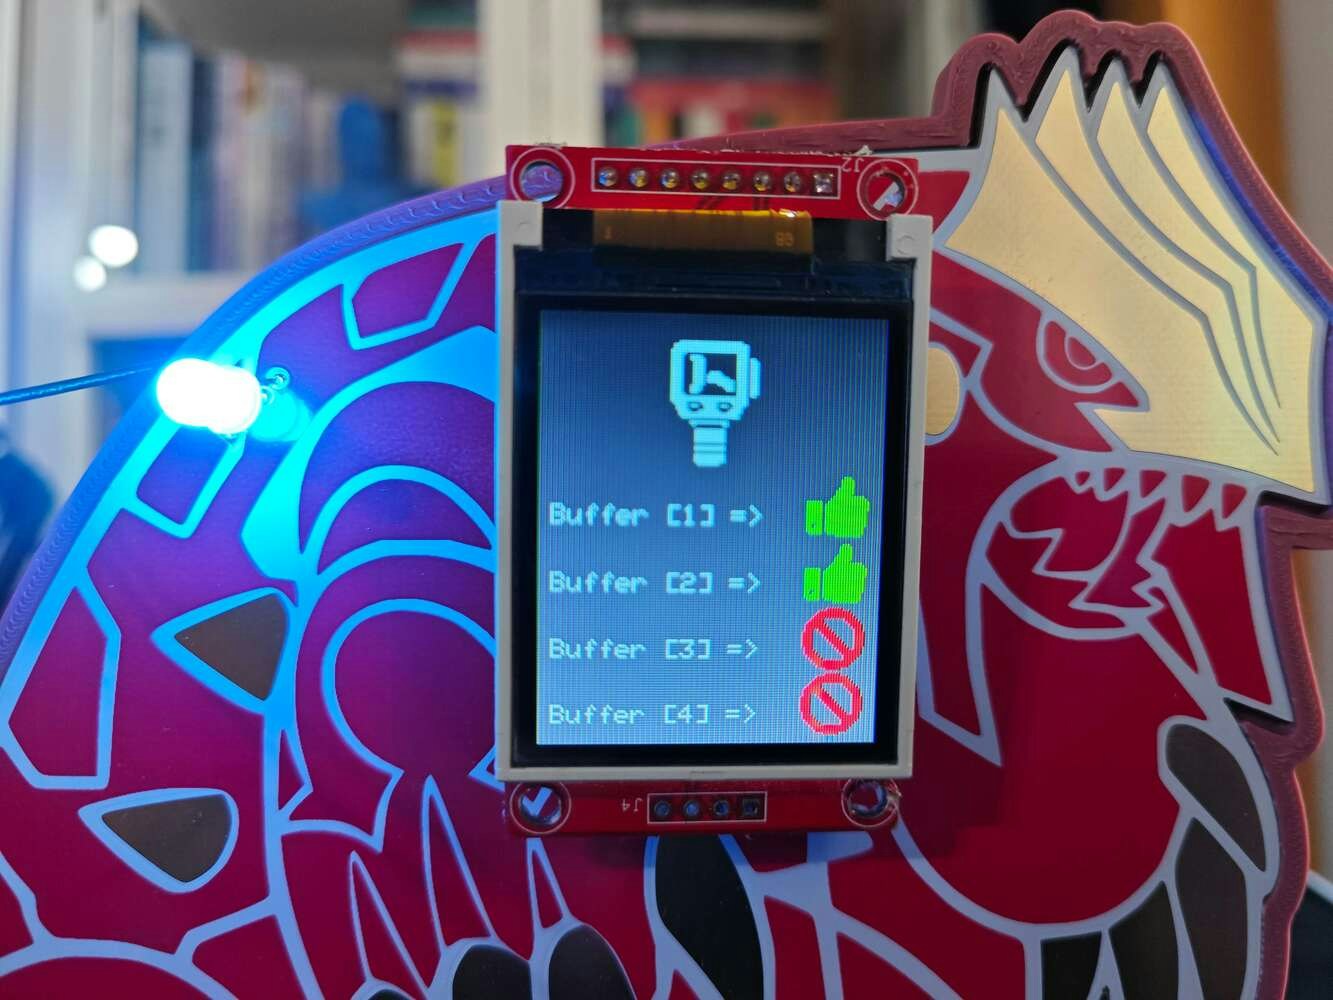
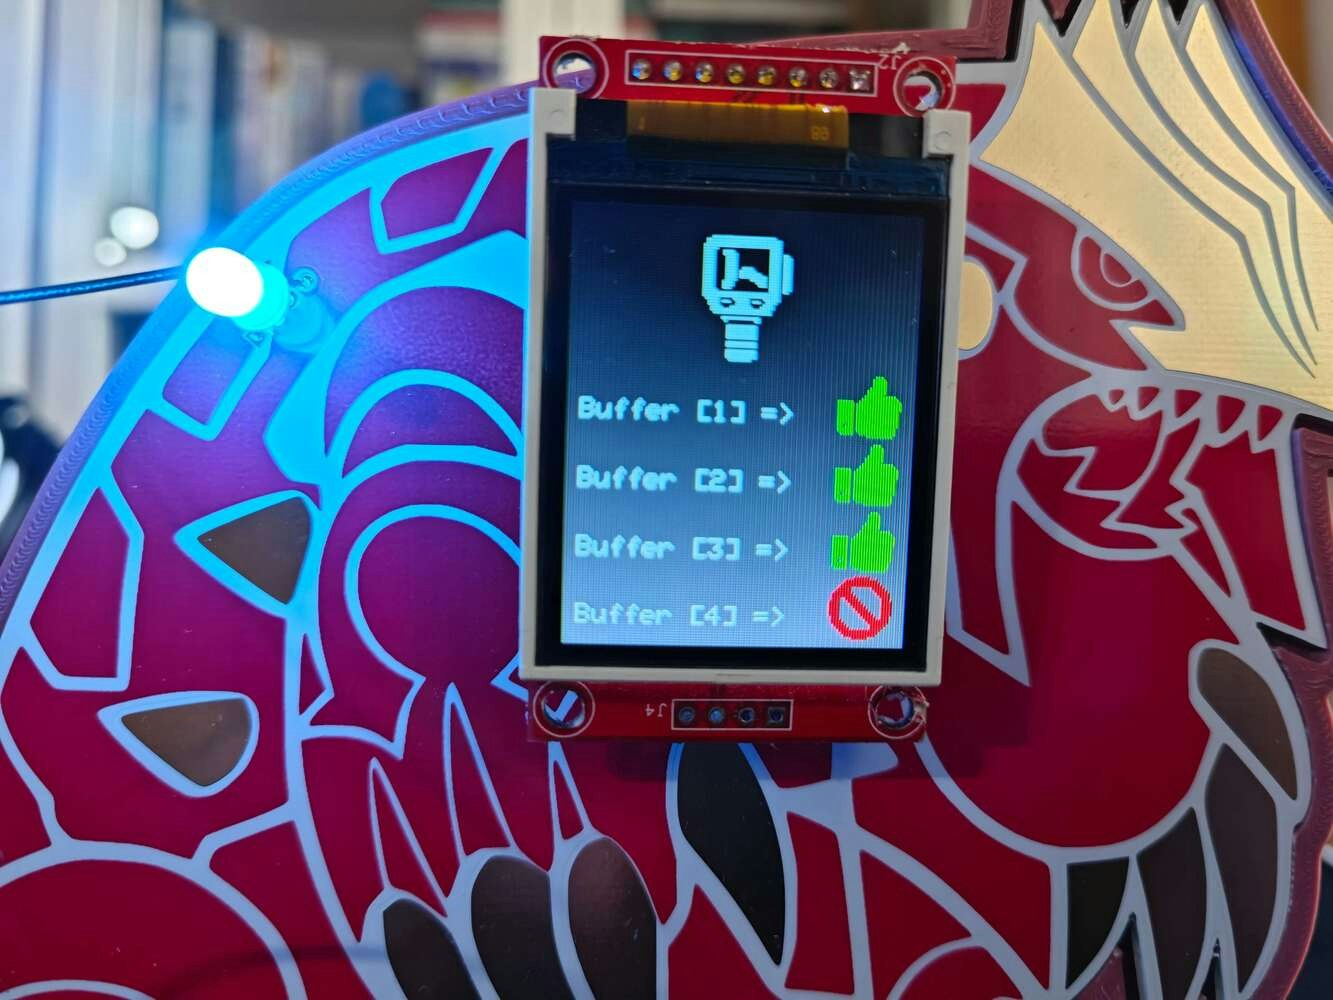
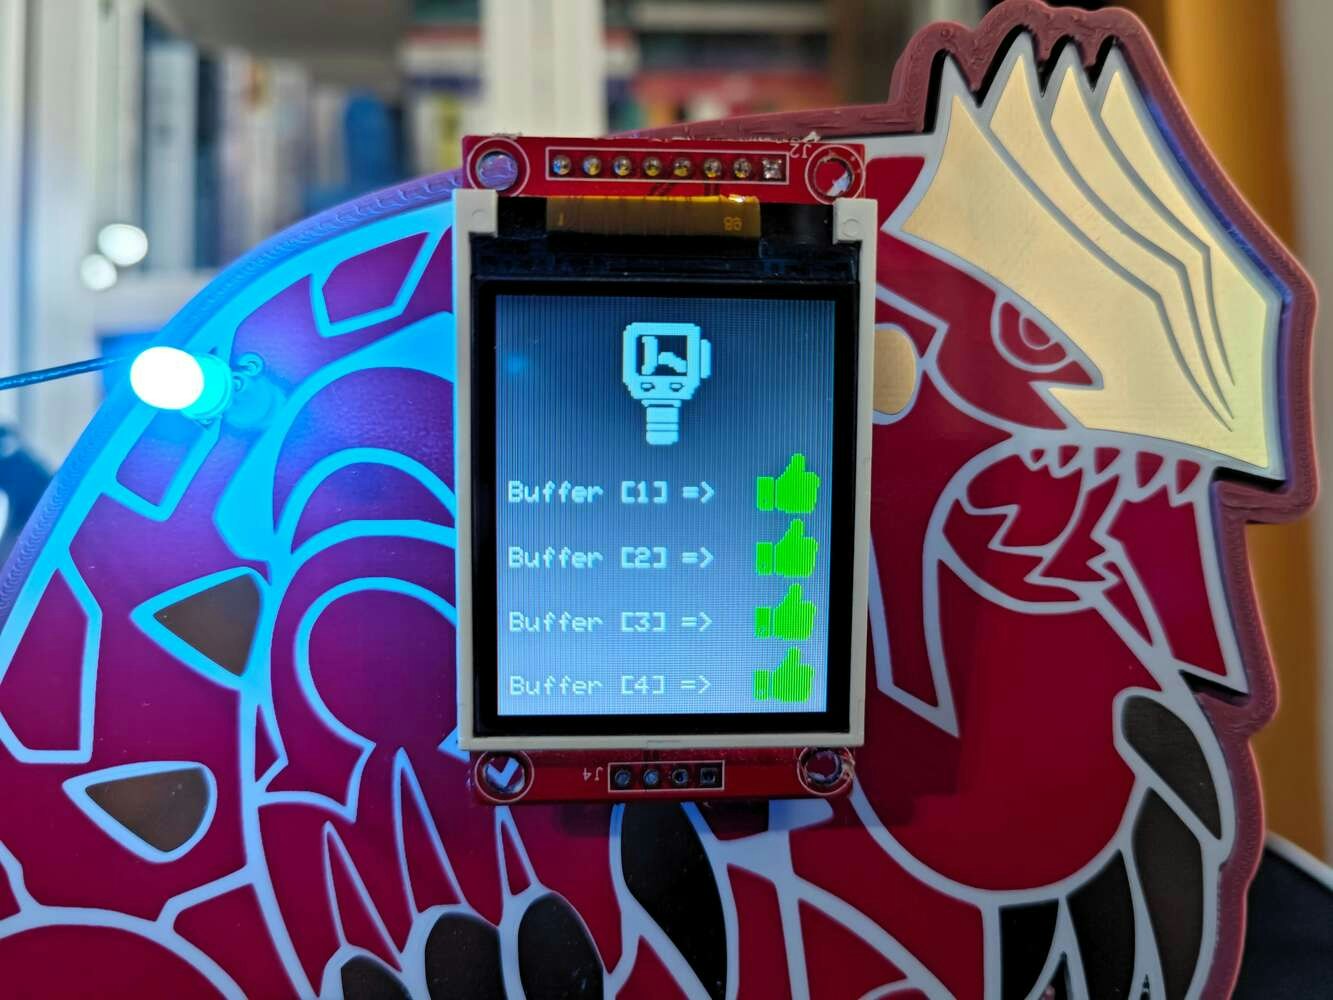
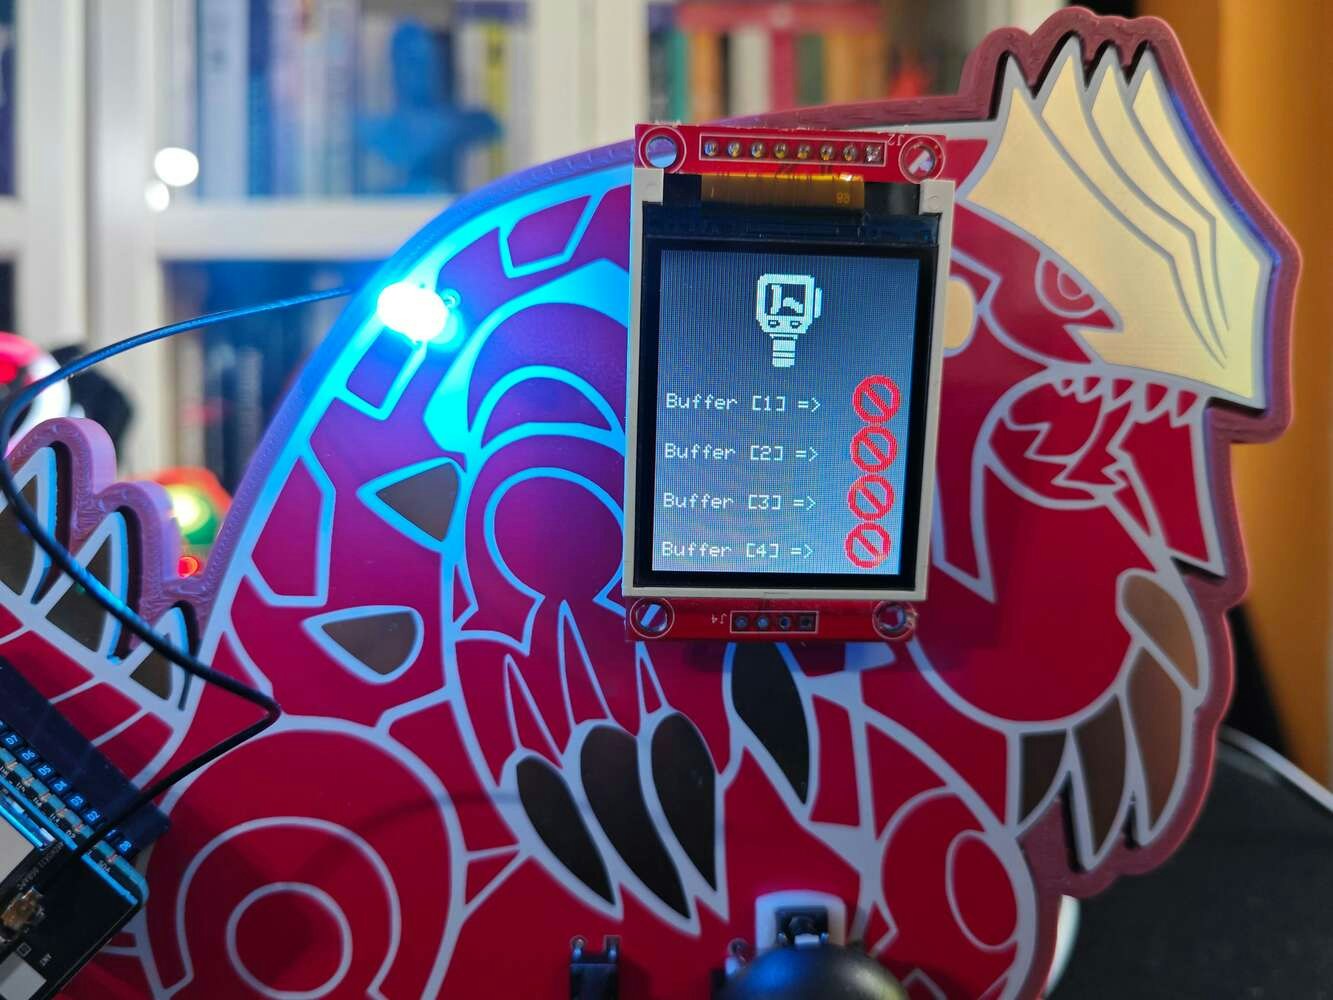
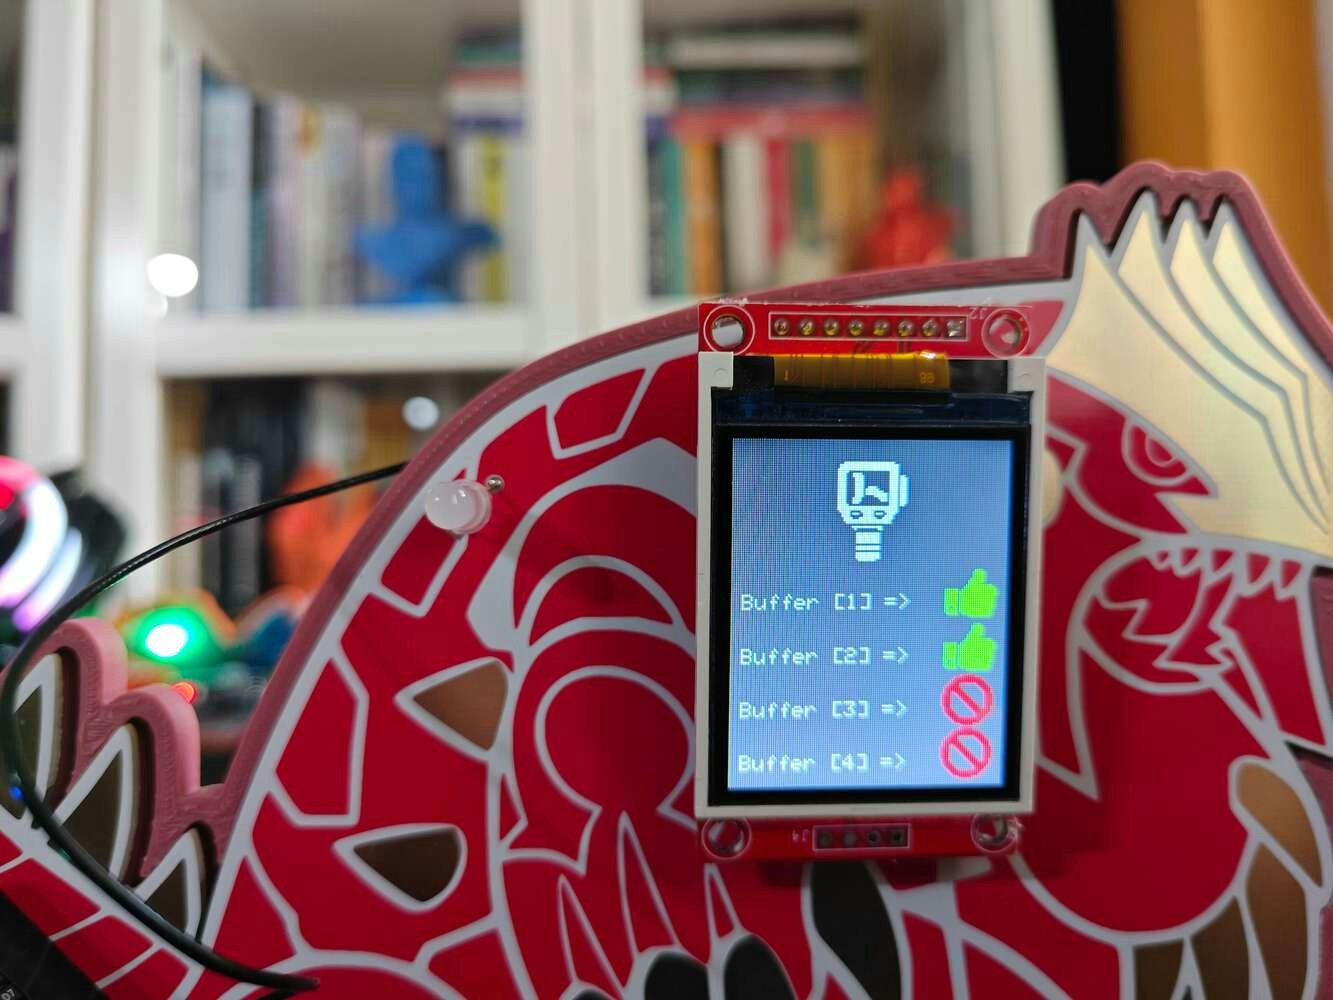
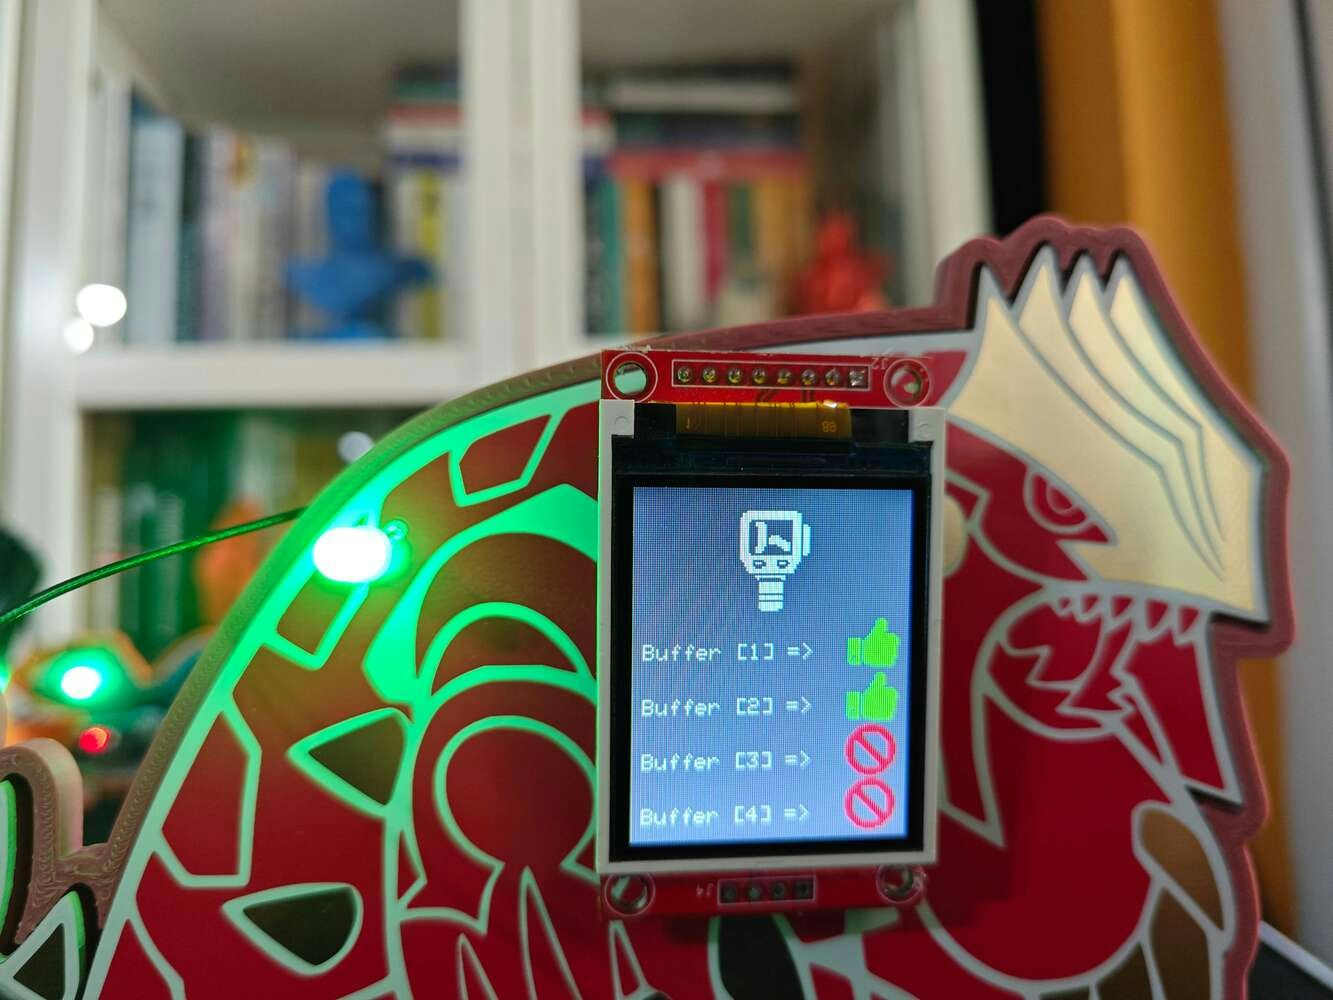
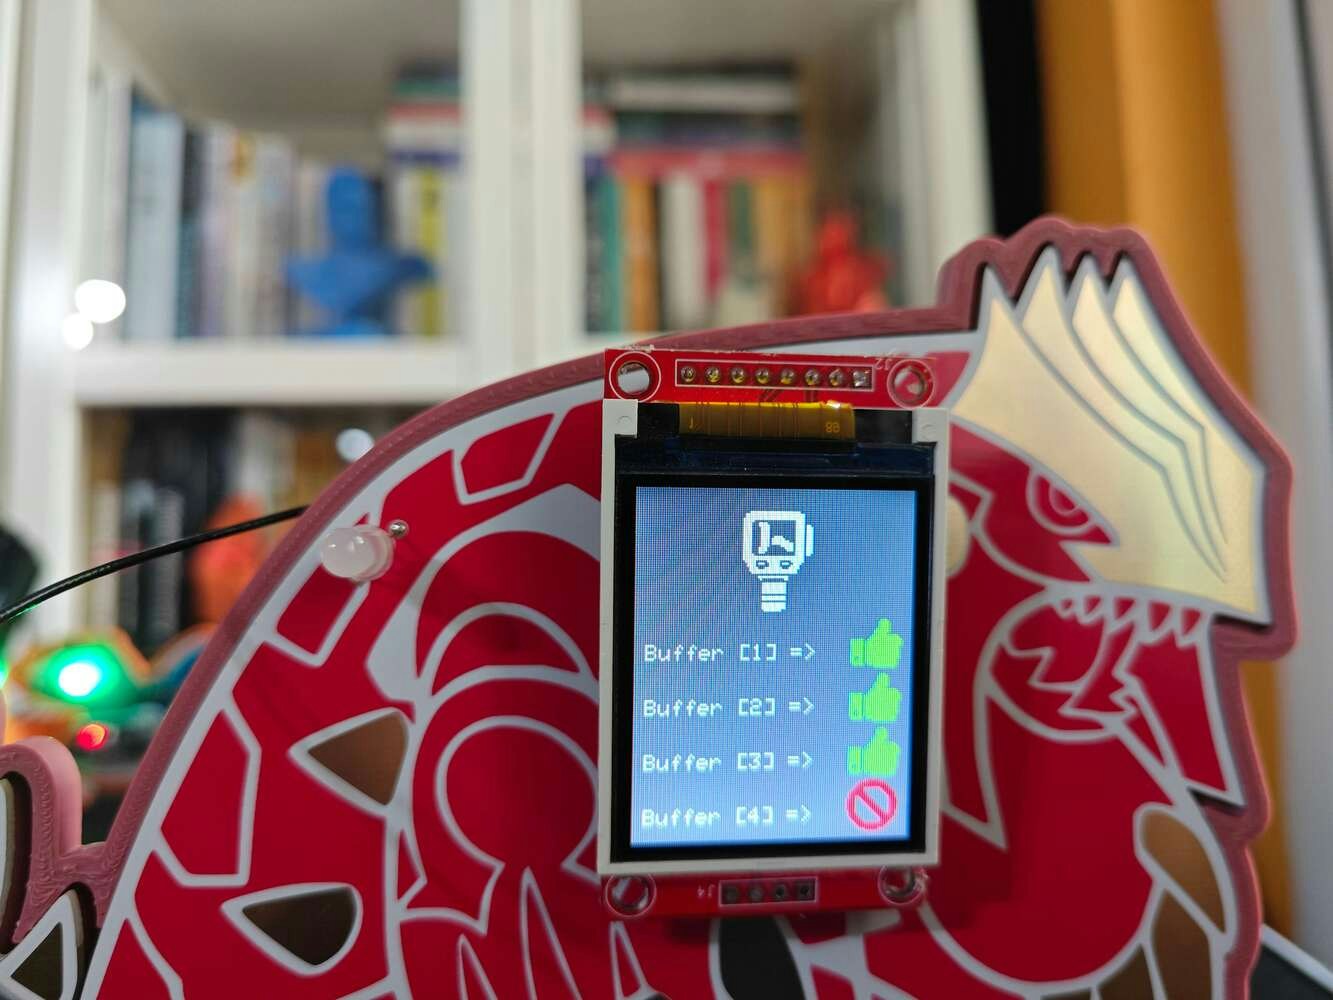
TFT Scan screen listing four thermal buffer registration indicators

19


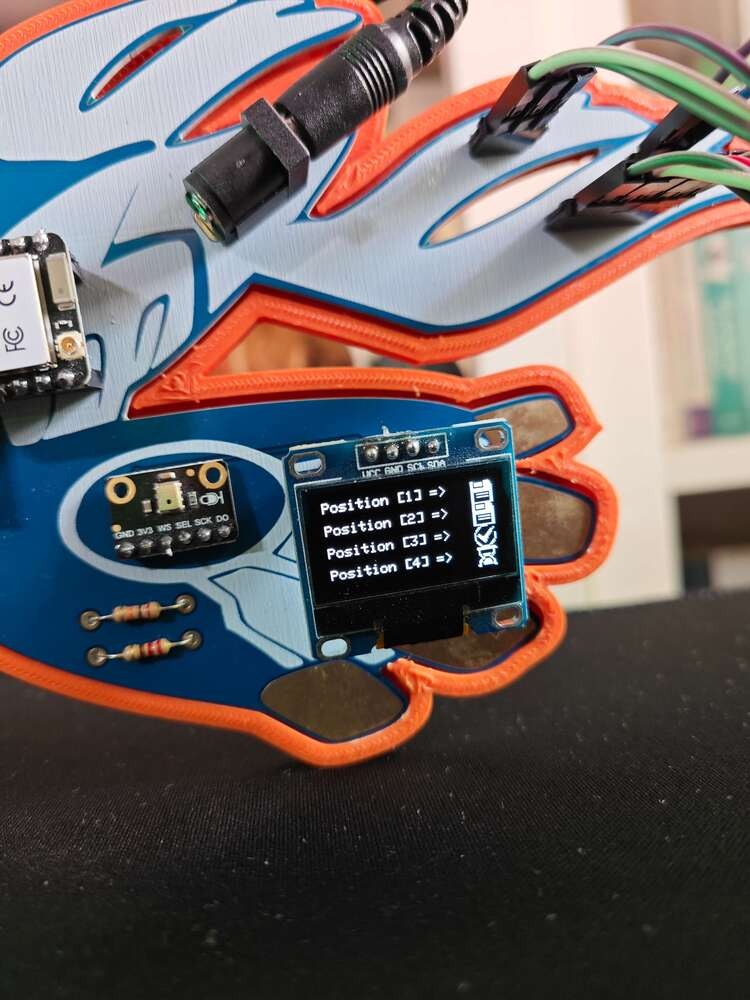
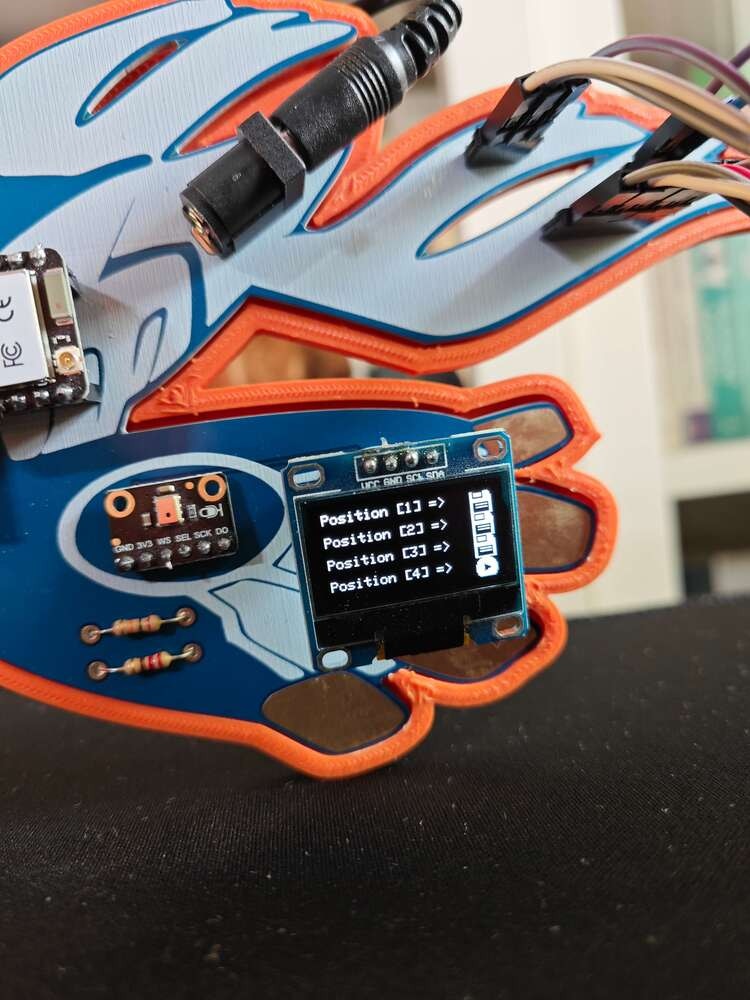
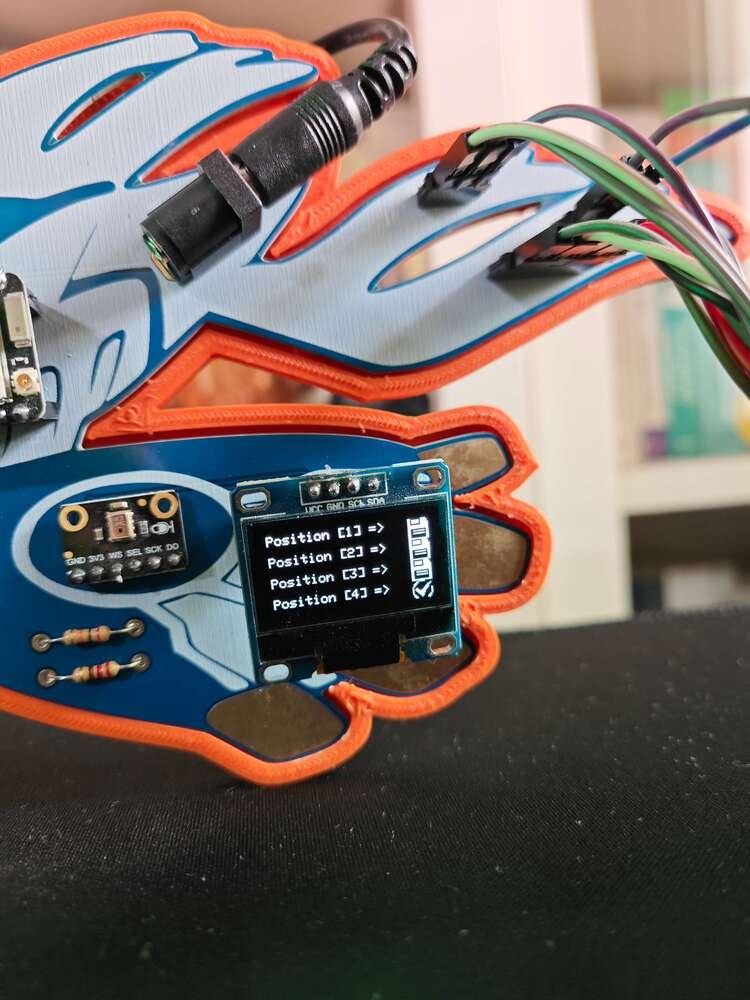
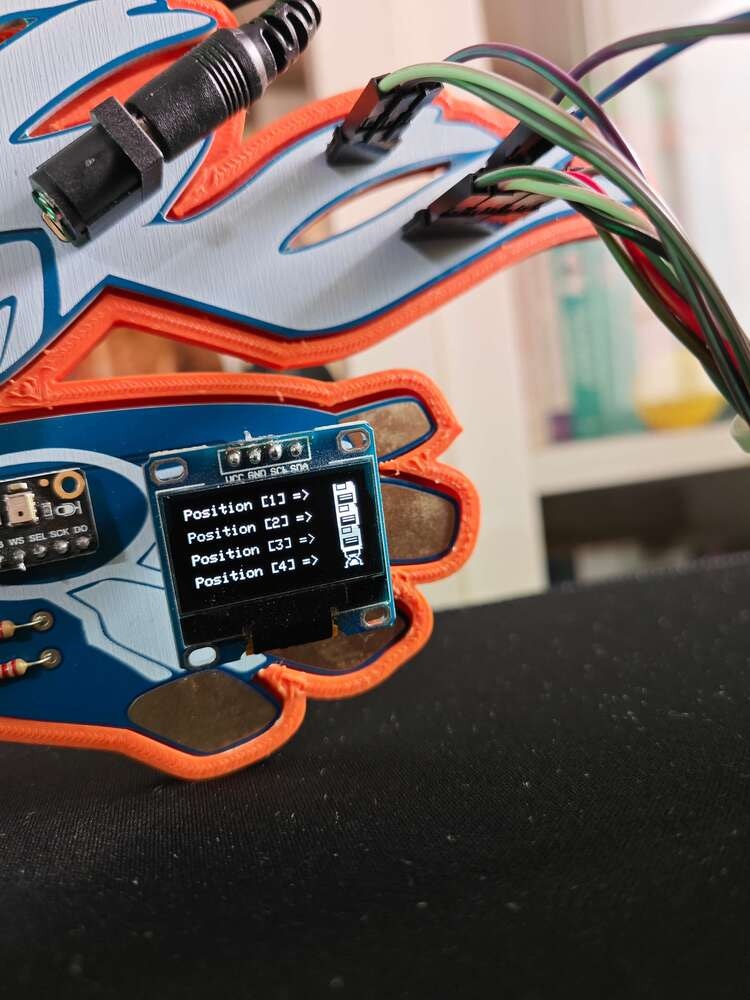
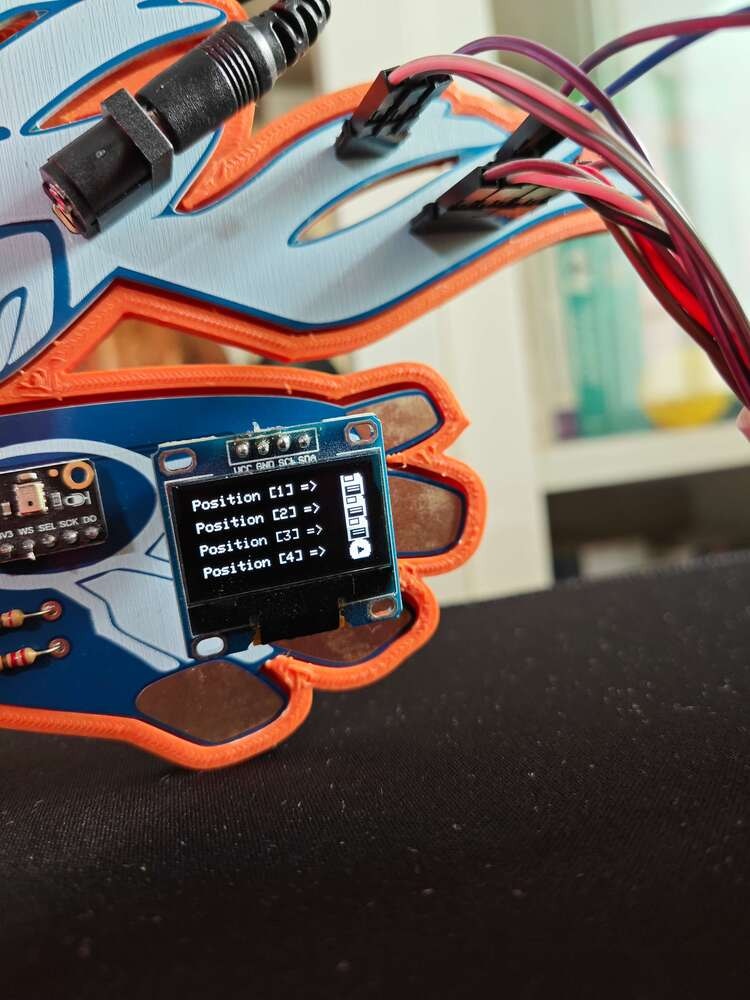
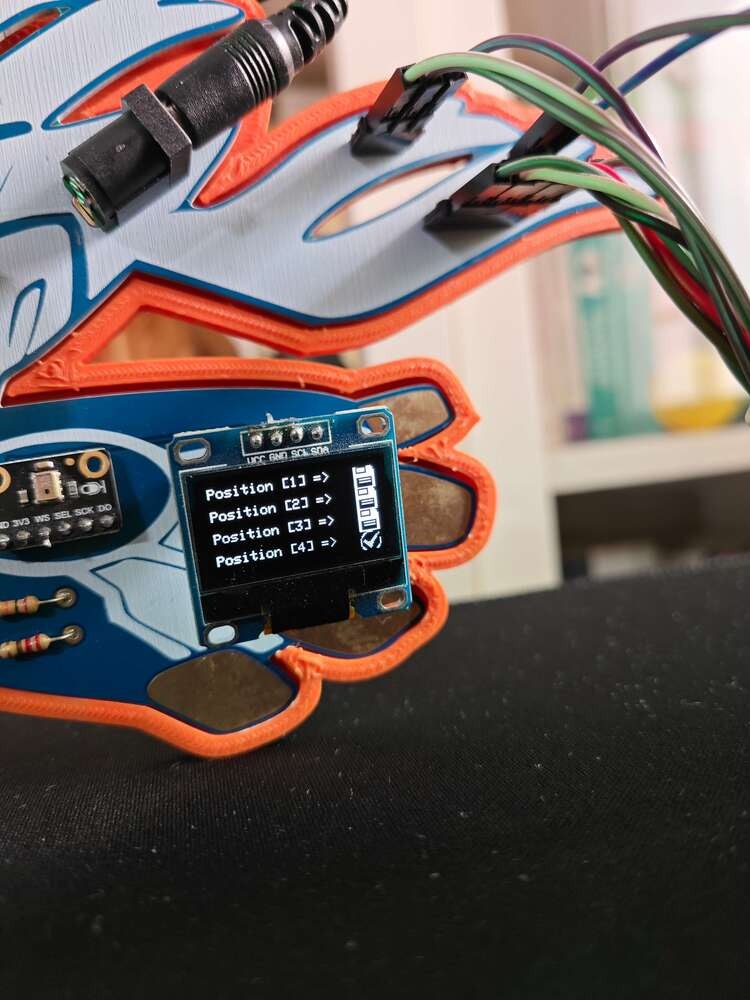
OLED CNC positioning screen with multiple buffer status indicators updated

20


CNC carriage aligned over a cooling block for thermal buffer capture

21


OLED screen showing saved status for another thermal buffer

22


CNC carriage advancing along the rods during the four-point scan

23


OLED status screen indicating the thermal image is ready after buffer collection

24


TFT display after registering initial thermal scan buffers

25


Thermal image result page showing a stable cooling pattern

26


Thermal image result page showing a warmer cooling block region

27


Thermal result view with visible hot zones on the scanned cooling blocks

28


Full system view during the automated CNC scan and thermal image workflow

29


Completed CNC collection setup with the dashboard ready to save the image

30


Thermal inspection dashboard entry showing a generated sample image

31


Inspect screen with the generated thermal preview ready for review

32


Thermal preview on the TFT display beside the operating CNC rig

33


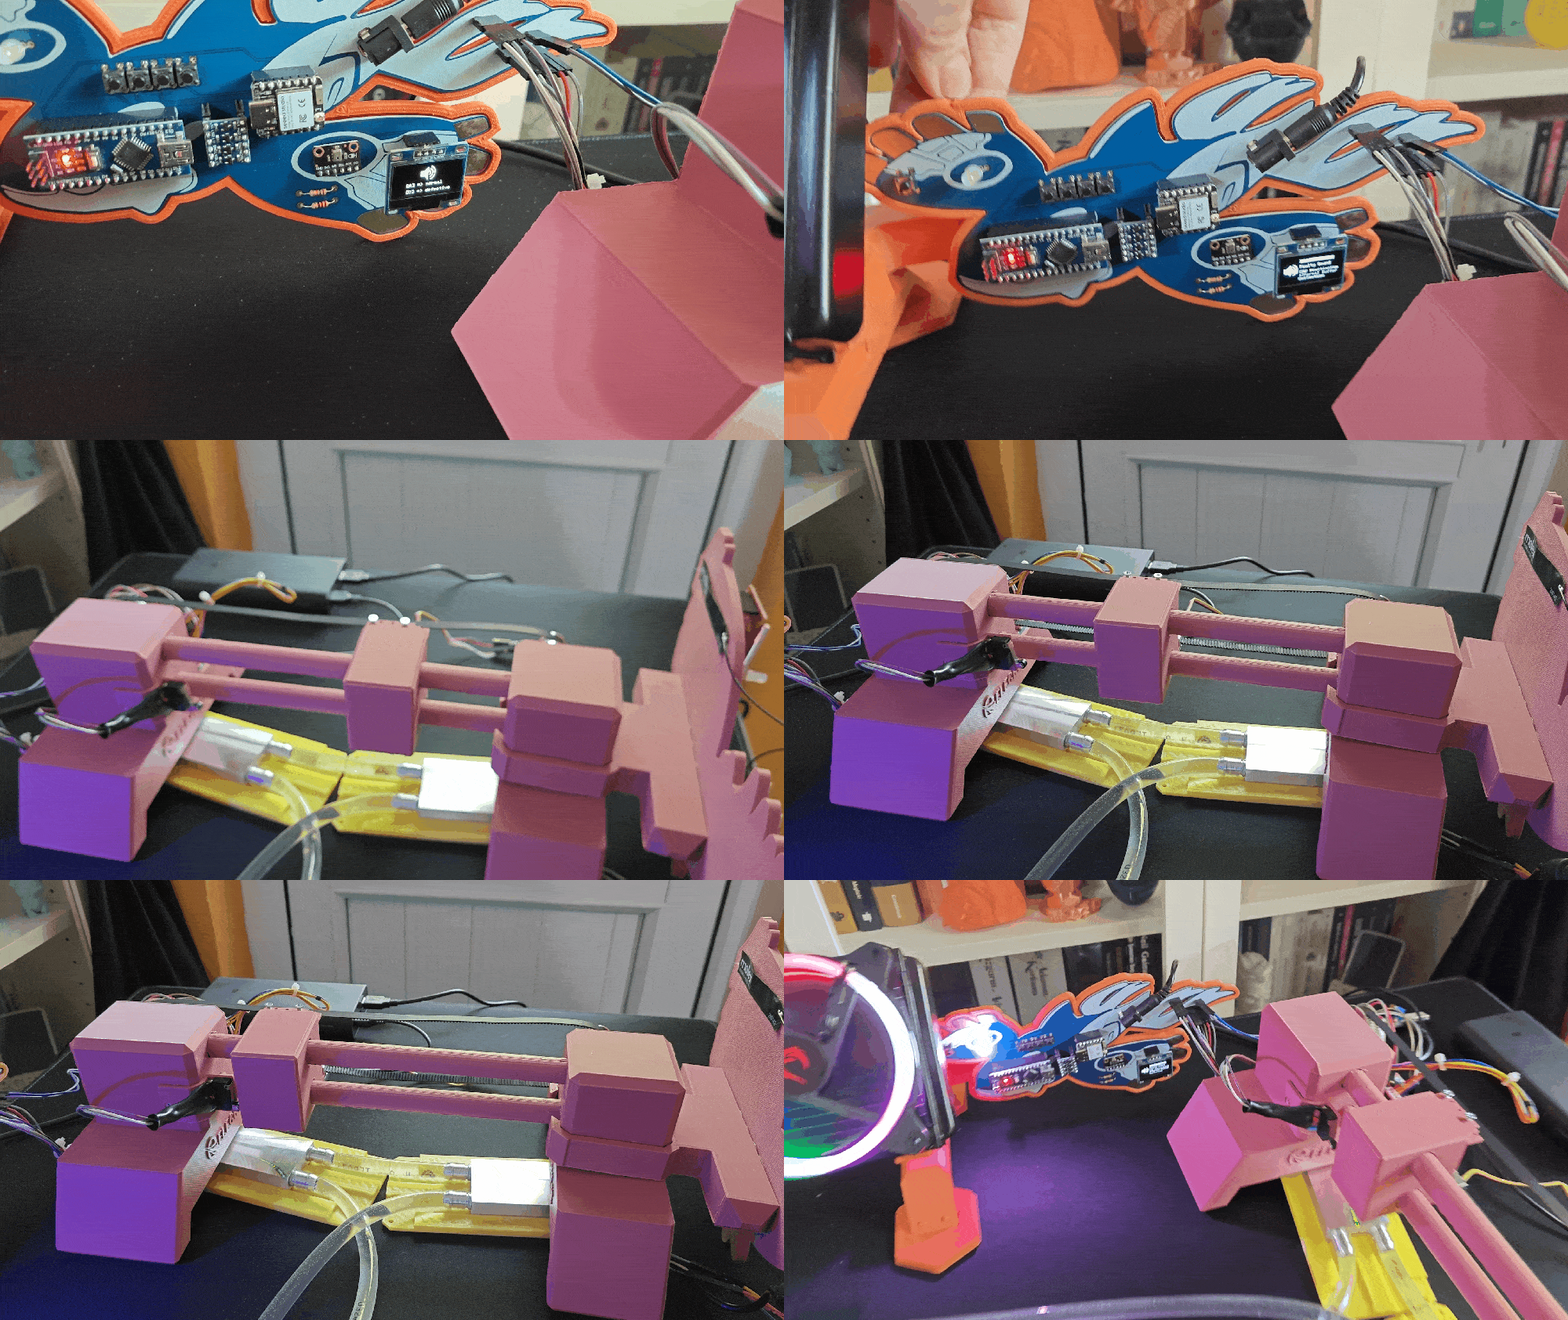
Animation of the CNC router collecting four thermal buffers and generating a sample image

34


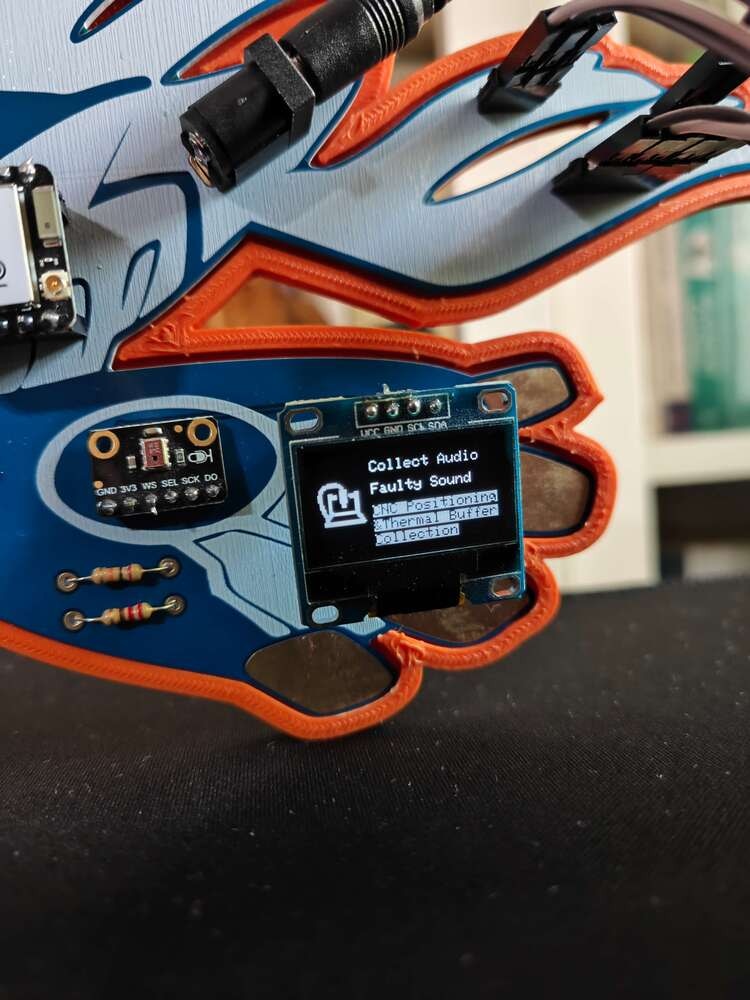
XIAO ESP32C6 OLED screen with the Faulty Sound menu option selected

35


OLED display showing the normal fan sound class after Audio MFE inference

36


OLED display showing the defective fan sound class after Audio MFE inference

37


OLED status screen starting CNC thermal buffer collection after anomalous sound detection

38


CNC carriage begins scanning the cooling blocks after the faulty sound result

39


OLED display updates the first CNC buffer status during model execution

40


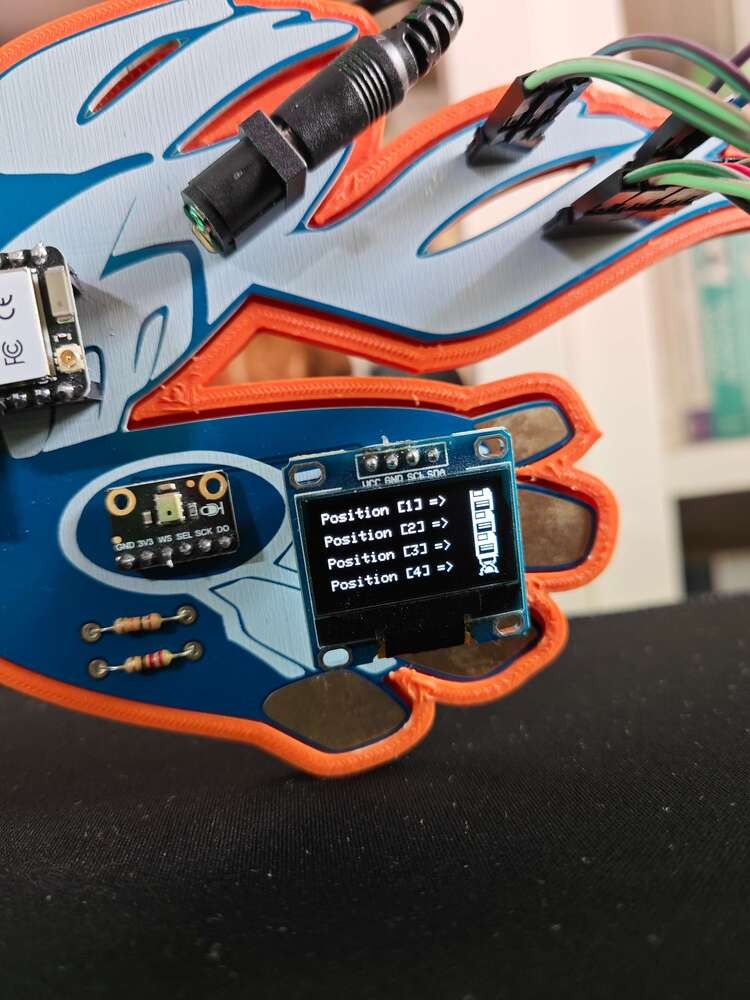
OLED display showing multiple CNC positions with saved buffer indicators

41


OLED display showing final Audio MFE detection status on the device

42


XIAO ESP32C6 and CNC rig after completing the audio-triggered thermal inspection

43


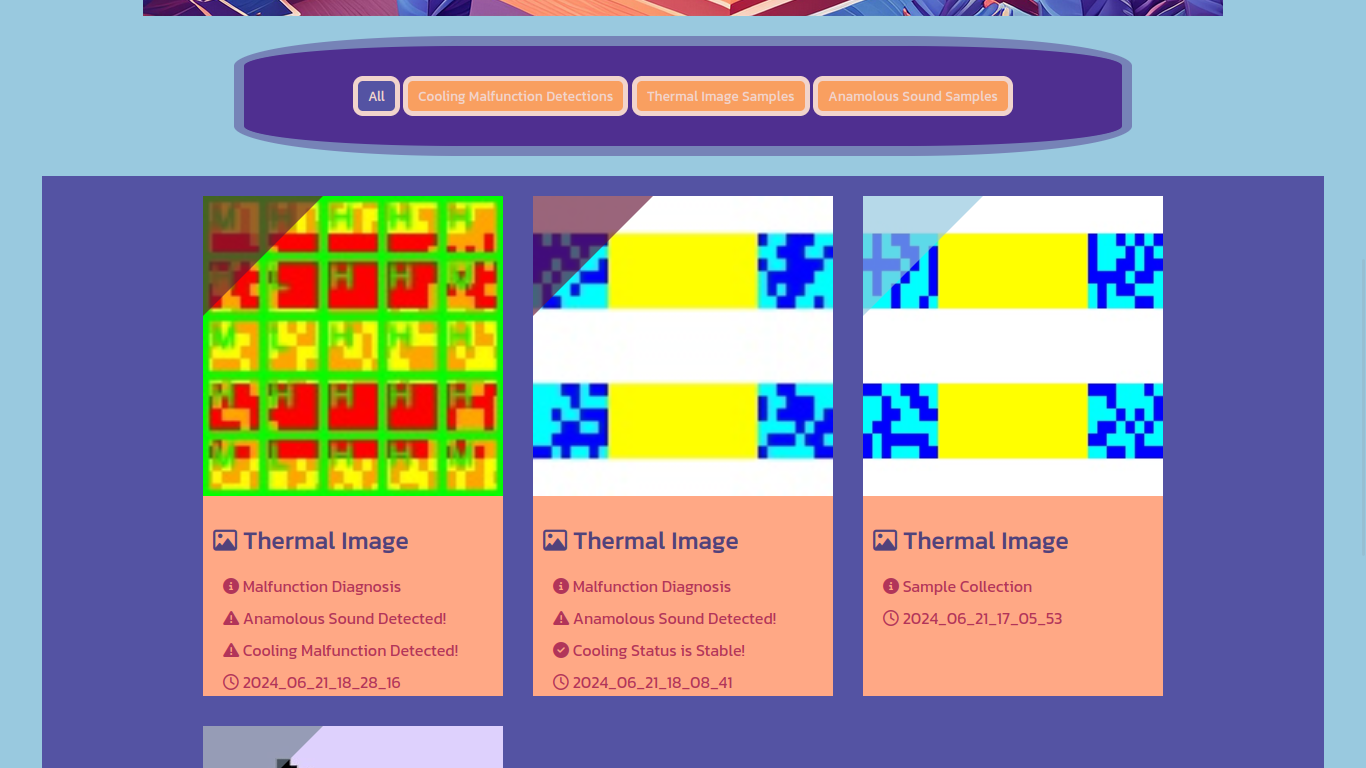
Cooling malfunction dashboard with model result images and prediction dates

44


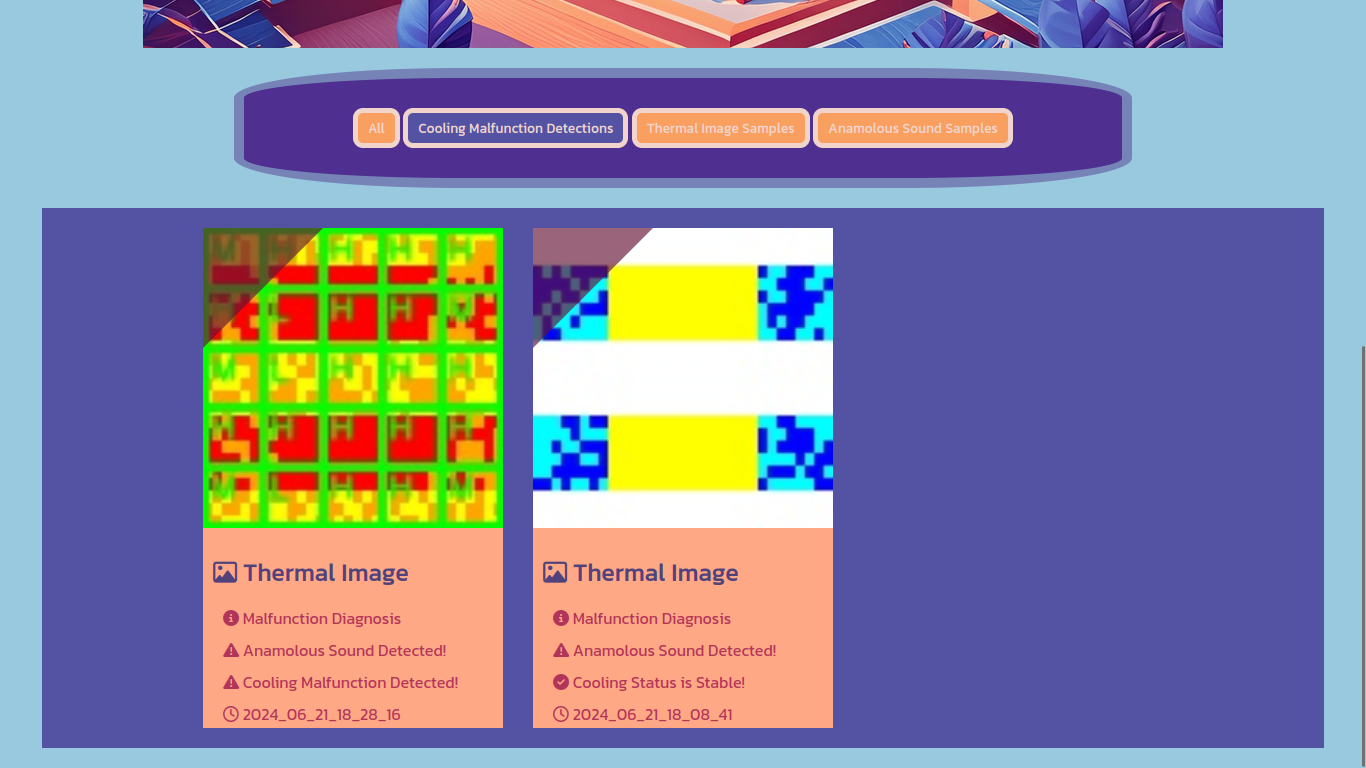
Filtered dashboard log view focused on detected cooling malfunction entries

45


Phone notification showing the HVAC anomaly alert sent through Twilio SMS

46


Phone notification showing the thermal cooling malfunction status message

47


Photon 2 TFT display showing the generated thermal preview in Inspect mode

48


Full HVAC device running the thermal inspection workflow with lights and dashboard

49


Animation of the audio and thermal models running consecutively on the completed HVAC rig

50

Demonstration Videos

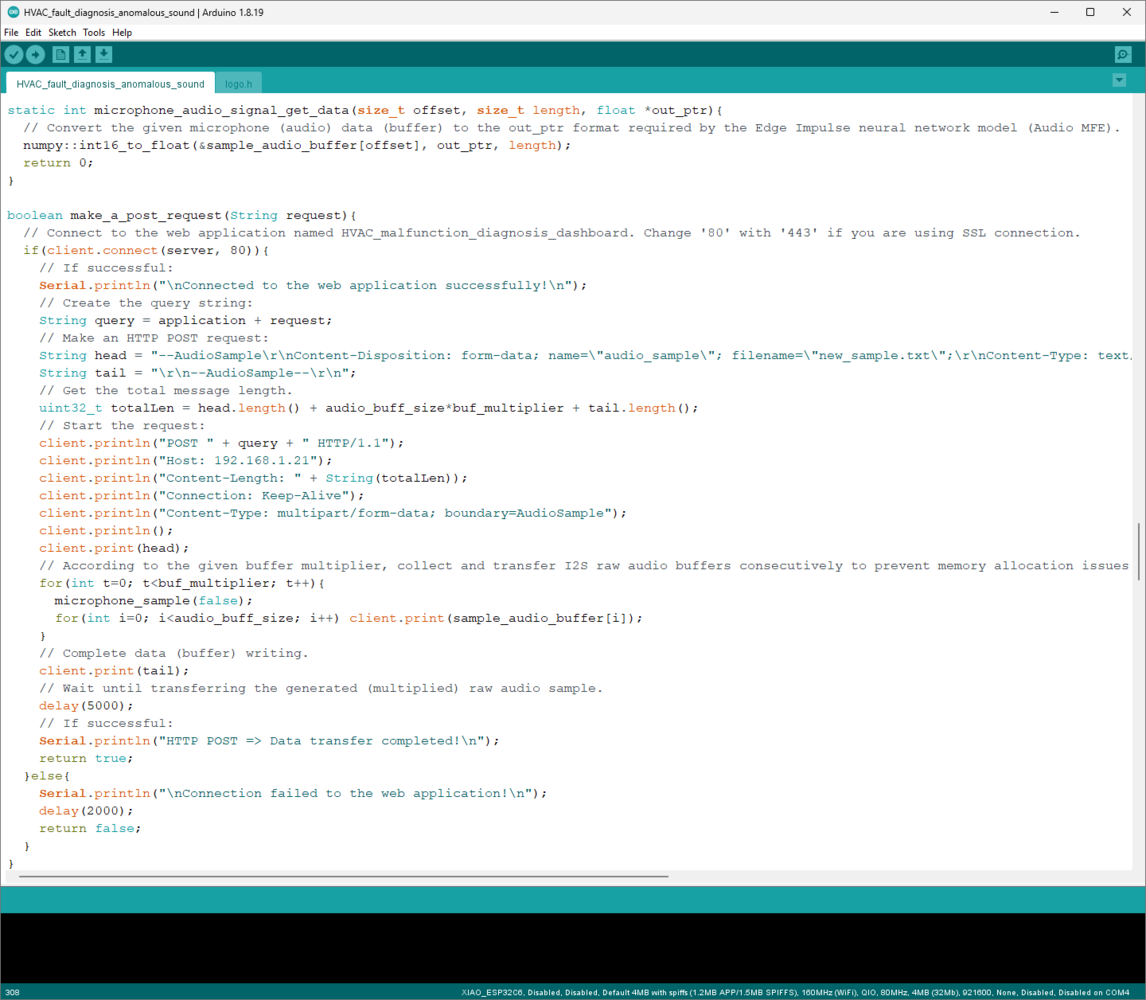
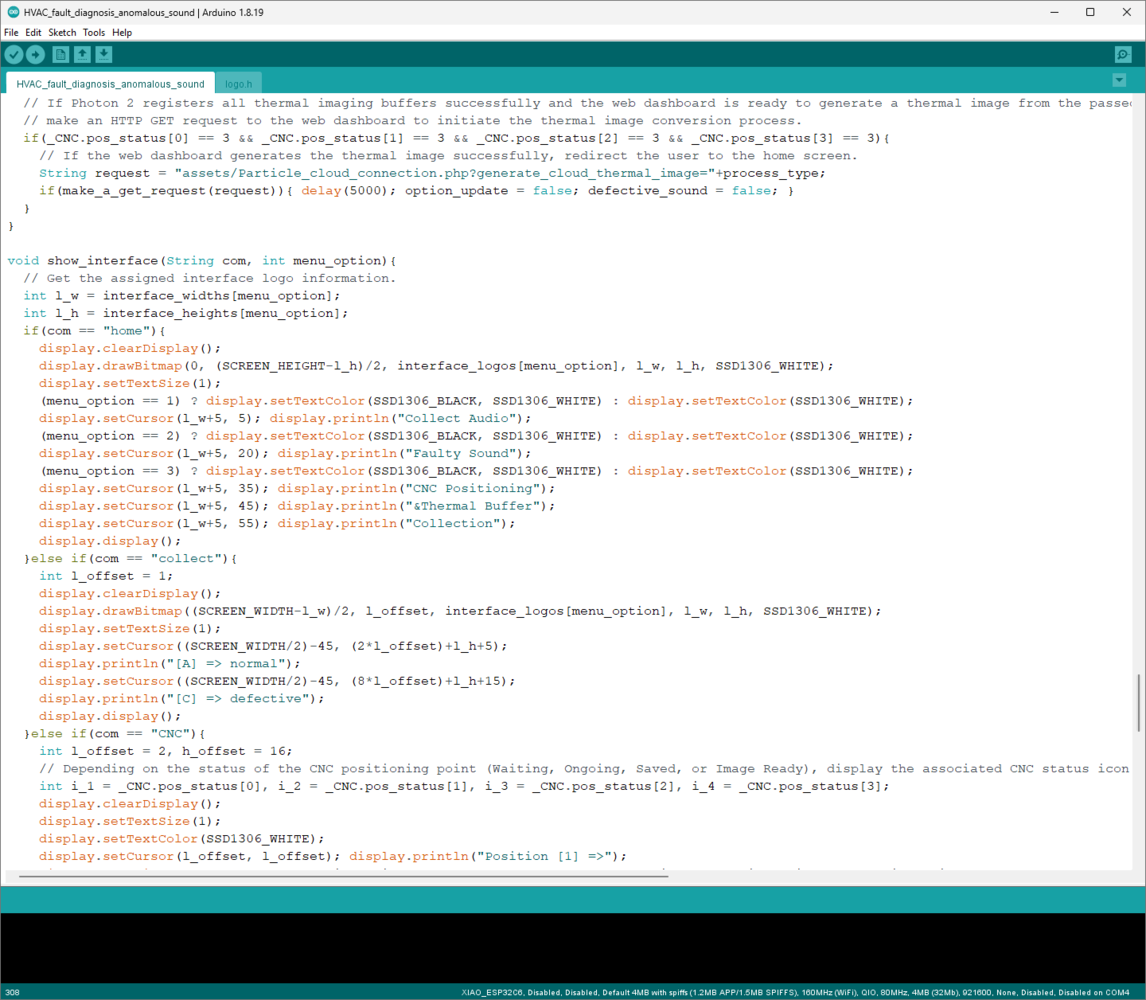
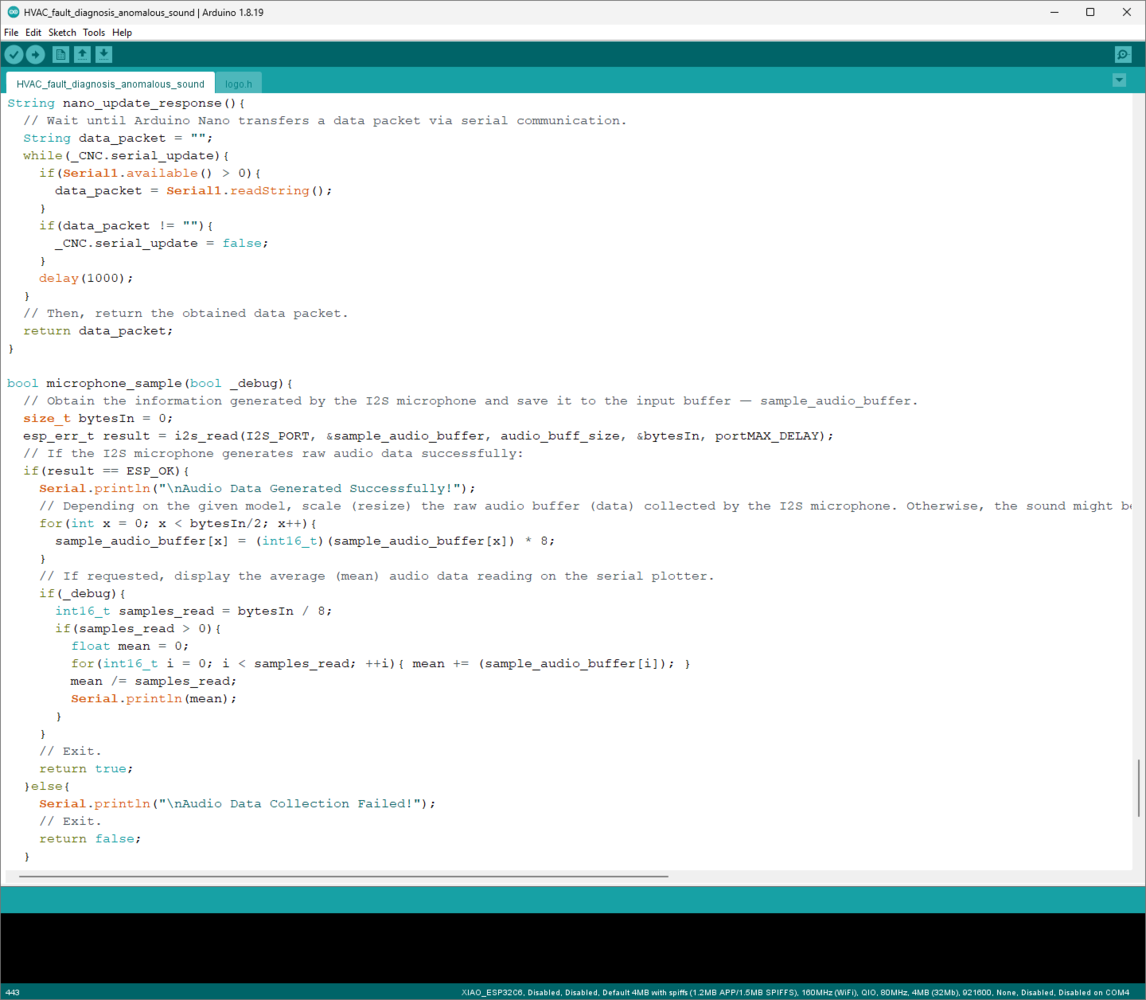
Since this HVAC malfunction detection device performs various interconnected features between different development boards and the web application (dashboard), I needed to compartmentalize consecutive processes and describe functions under the same code file separately to provide comprehensive step-by-step instructions. Thus, I highly recommend watching the demonstration videos before scrutinizing the tutorial steps to effortlessly grasp device capabilities that might look complicated in the instructions.

Step 0: A brief introduction to device features and structure

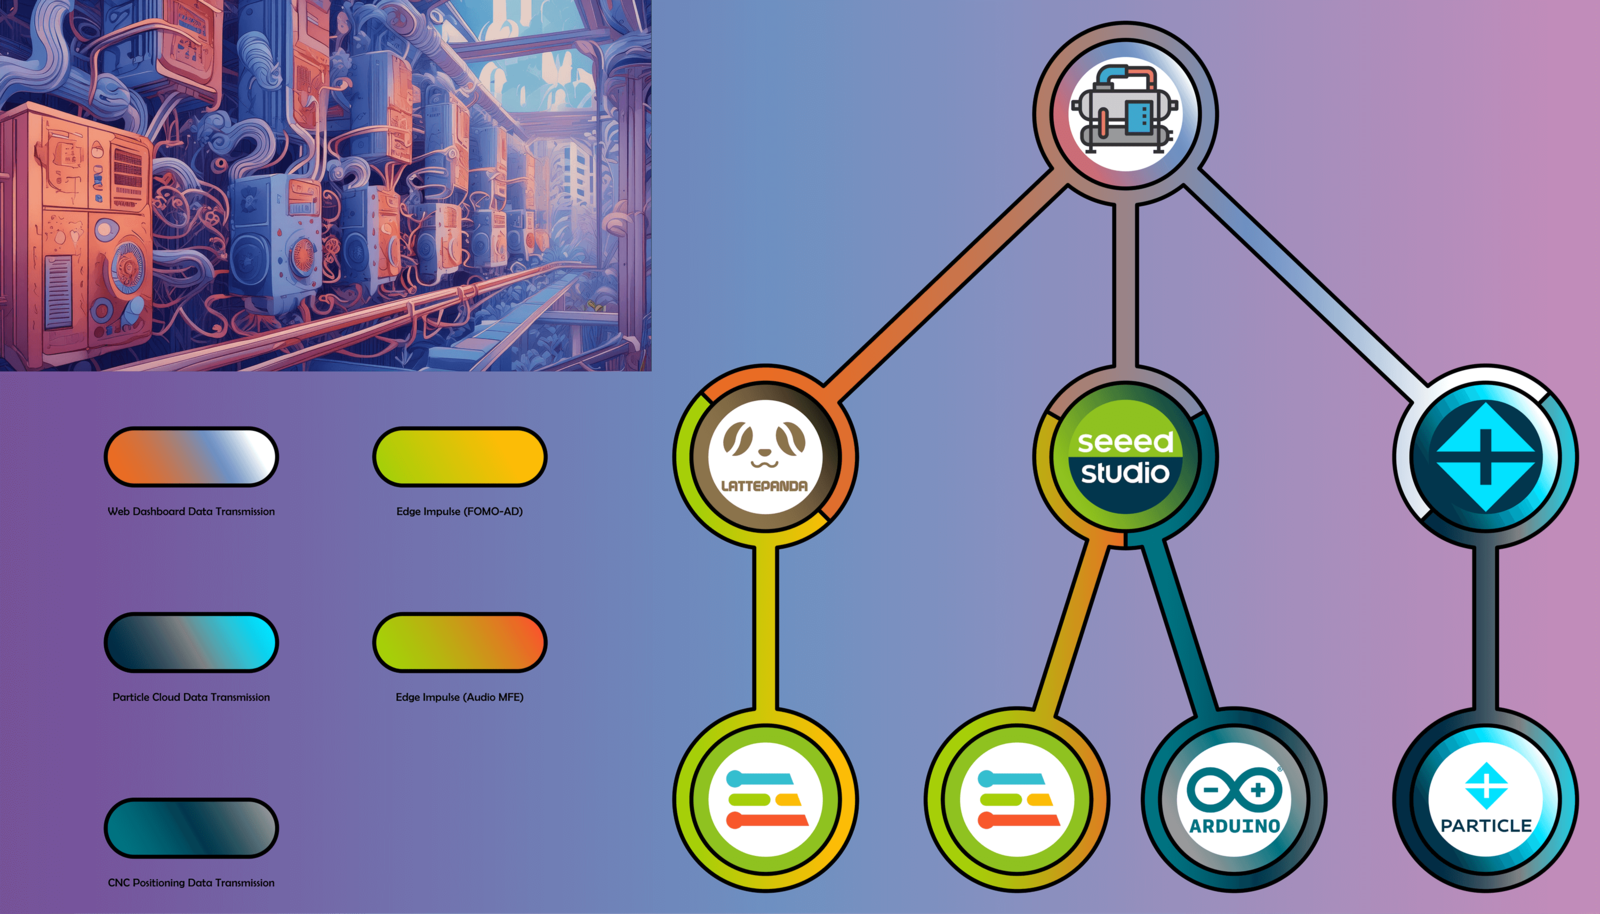
As my projects became more intricate due to complex designs and multiple development board integrations, I decided to create concise illustrations to improve my tutorials, visualize the special tasks associated with each development board, and delineate the complicated data transfer procedures between different boards or complementary applications. Thus, before proceeding with the following steps, I highly recommend inspecting these illustrations to comprehend the device features and structure better. Note: Since downsizing these high-resolution illustrations is necessary for loading the tutorial page, I noticed the text on the illustrations lost legibility. Therefore, I also added the original image files below for further inspection.

Infographic summarizing XIAO ESP32C6 audio collection, CNC control, and local model inference tasks

51


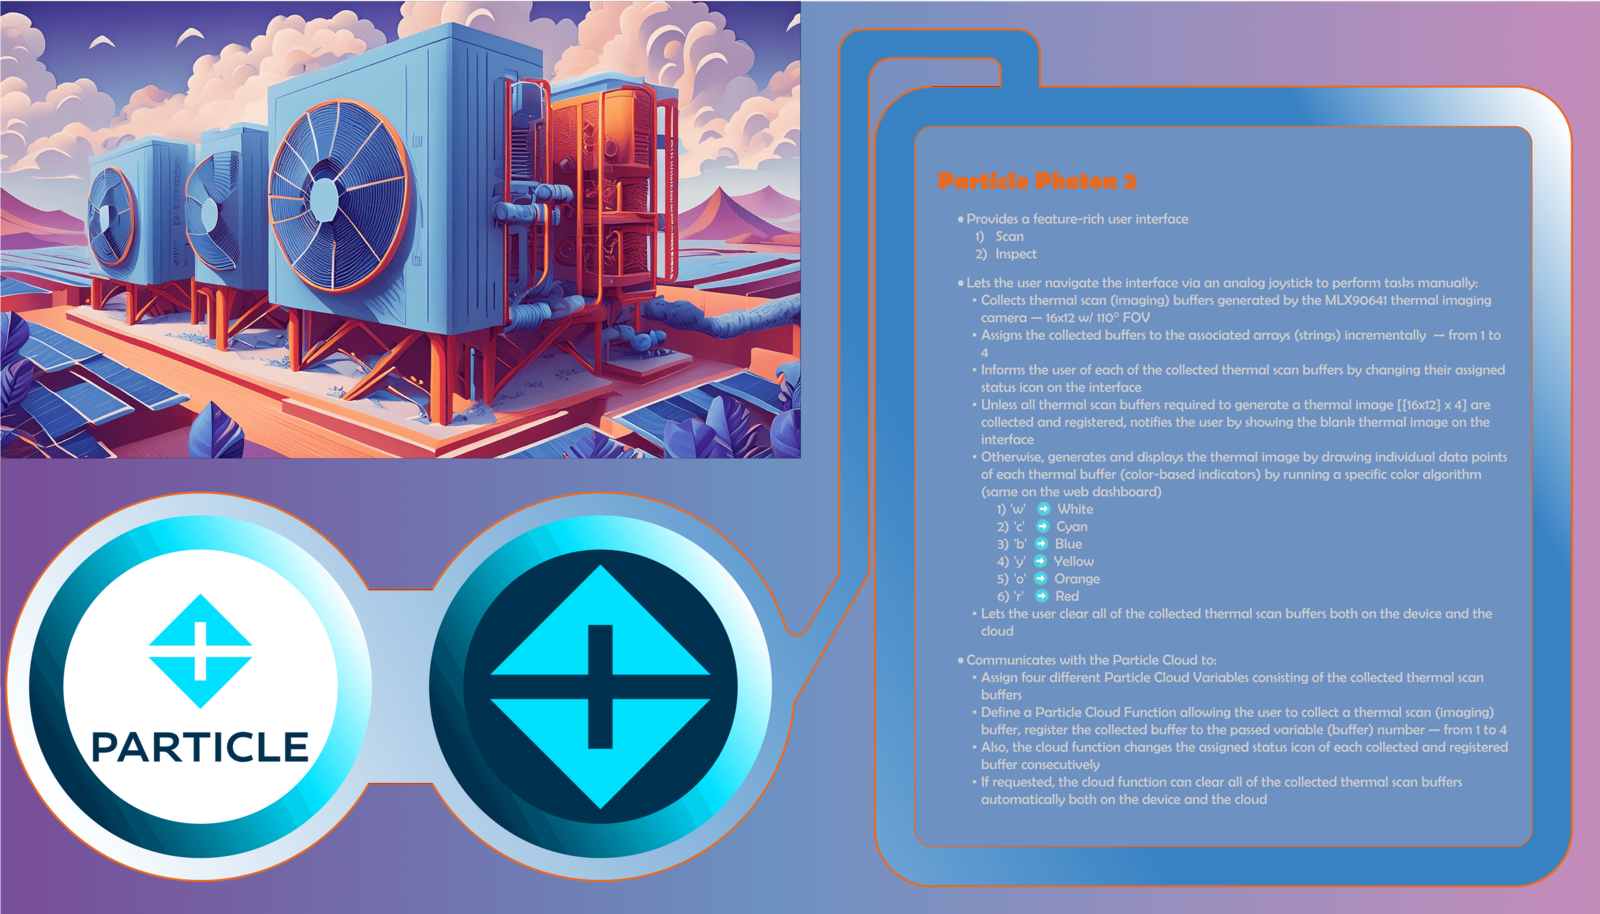
Infographic summarizing Particle Photon 2 thermal scanning, Particle Cloud buffers, and TFT controls

52


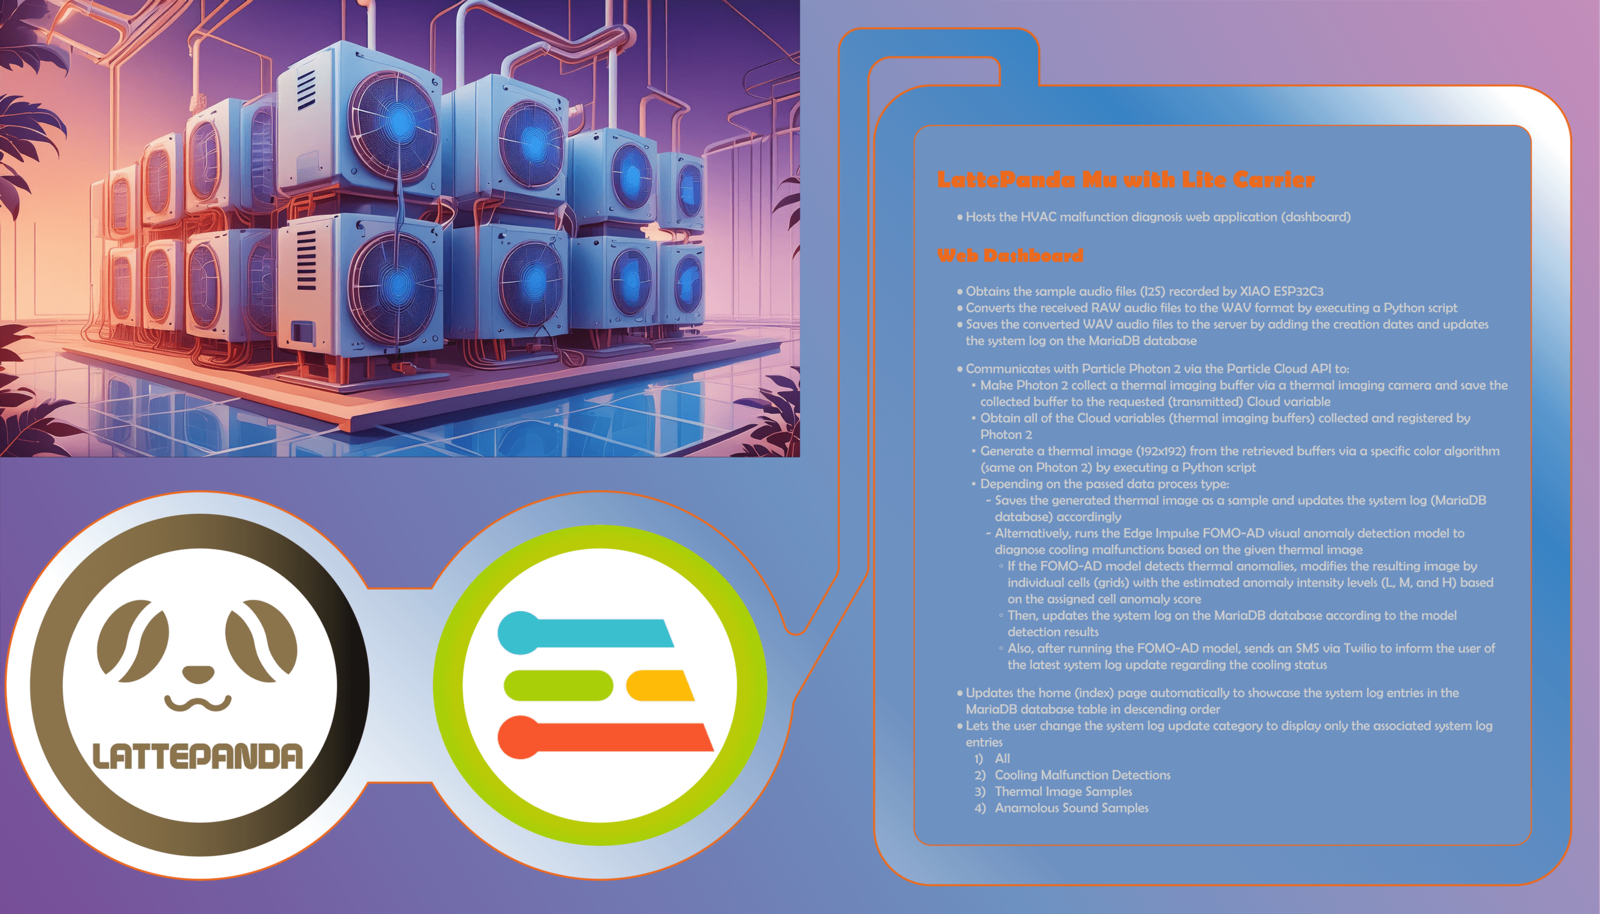
Infographic summarizing LattePanda Mu web dashboard, Python scripts, database, and FOMO-AD inference tasks

53


System infographic connecting XIAO ESP32C6, Arduino Nano, Photon 2, LattePanda Mu, and the dashboard

54

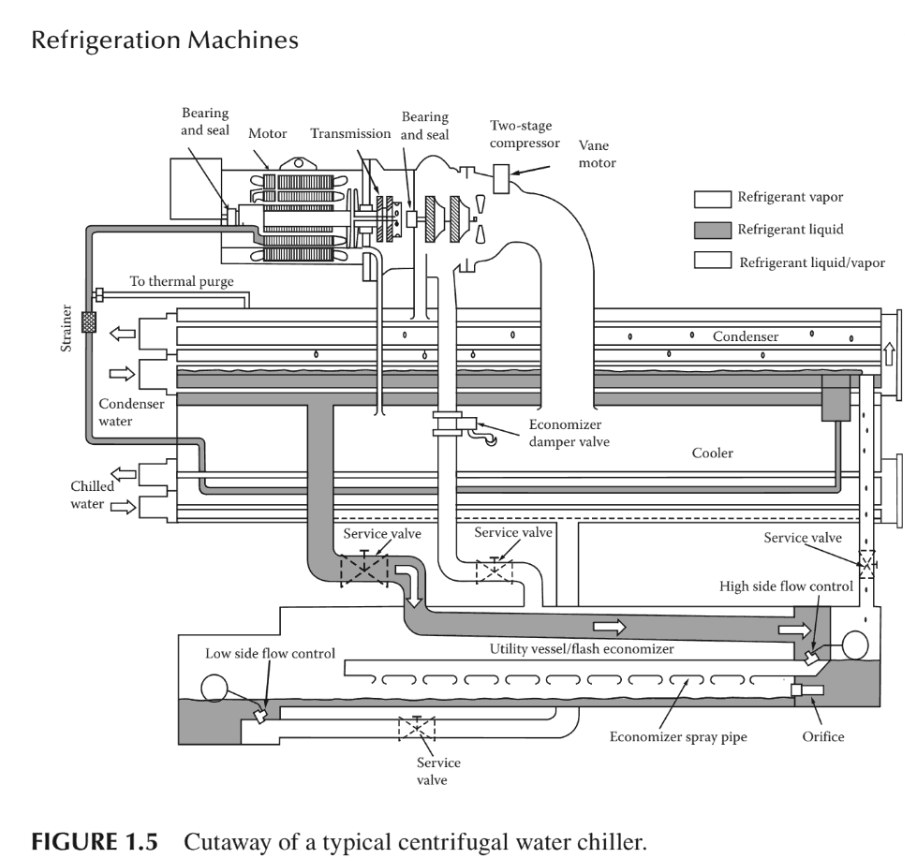
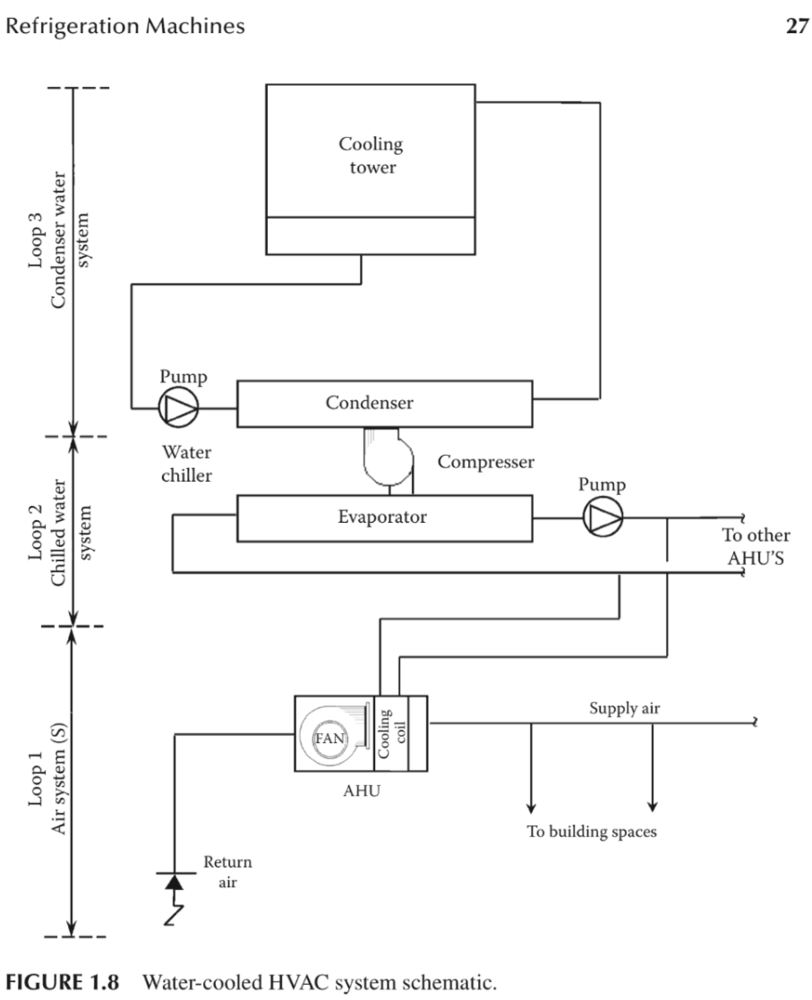
Before designing my simplified water-based HVAC system to simulate the required component failures for data collection and in-field model testing, I thoroughly inspected common water-cooled HVAC mechanisms[^4] to understand the inner workings of applying water as a coolant for transferring excess heat in industrial processes.
Diagram of the simplified water-based HVAC loop with radiator, pump, reservoir, and cooling blocks

55


Thermal scanning diagram showing the CNC camera path over the aluminum cooling blocks

56

Step 1.a: Designing and soldering the Kyogre-inspired PCB

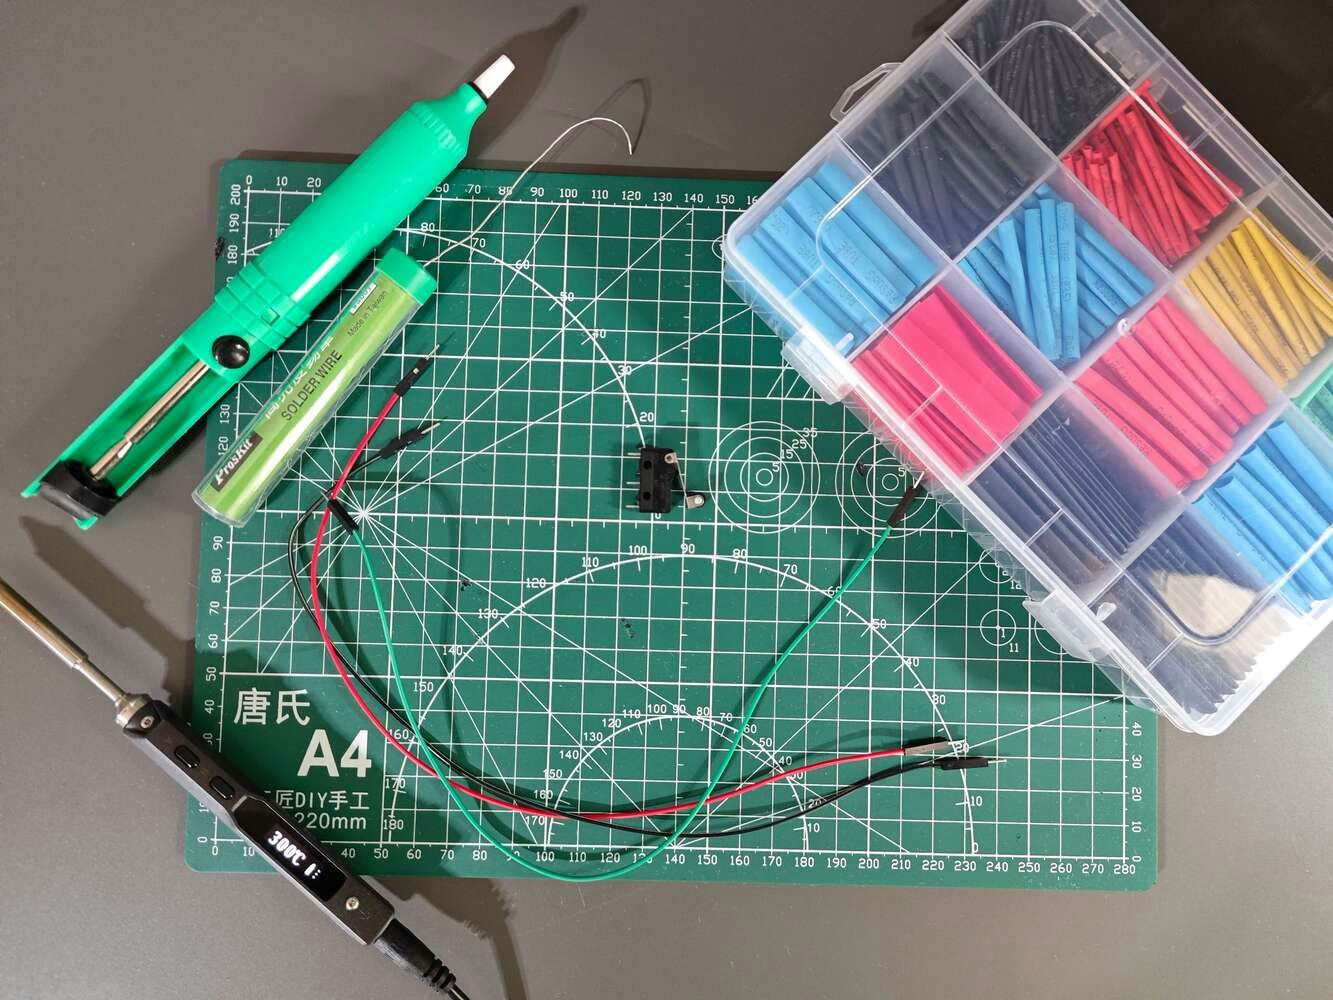
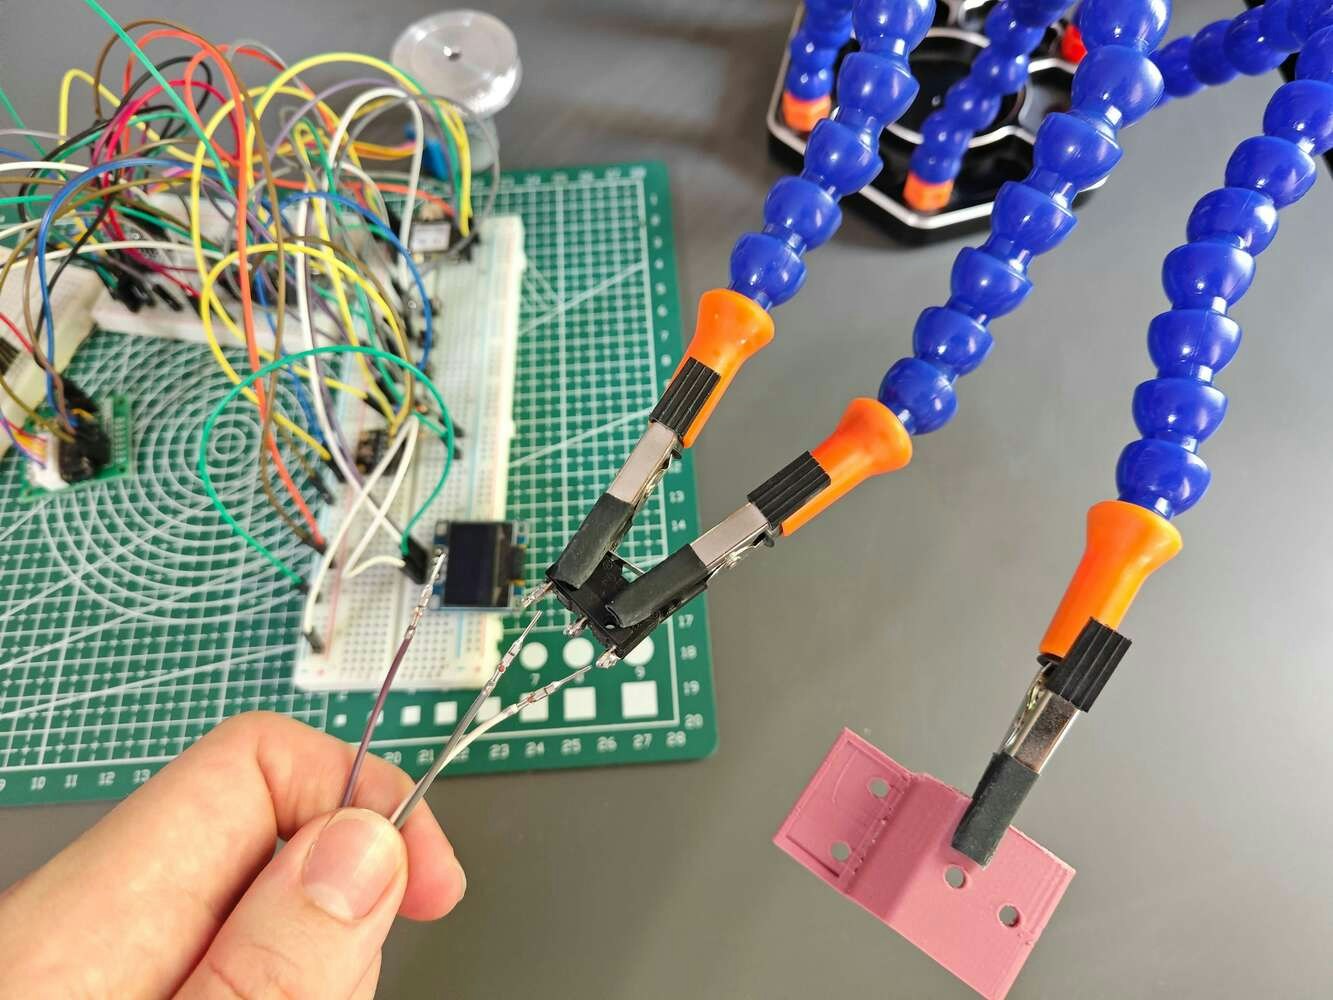
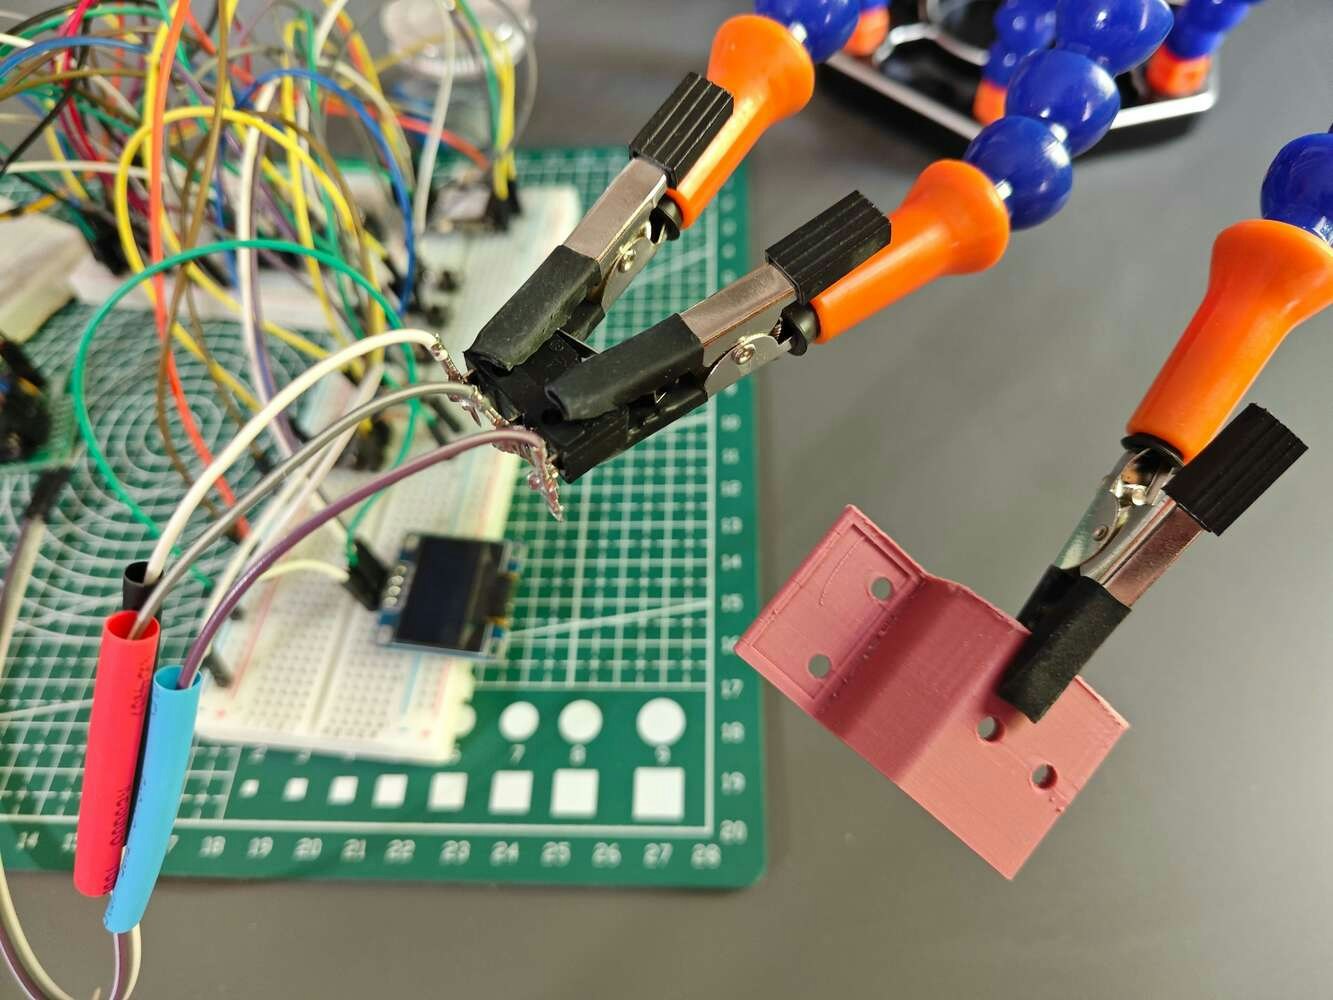
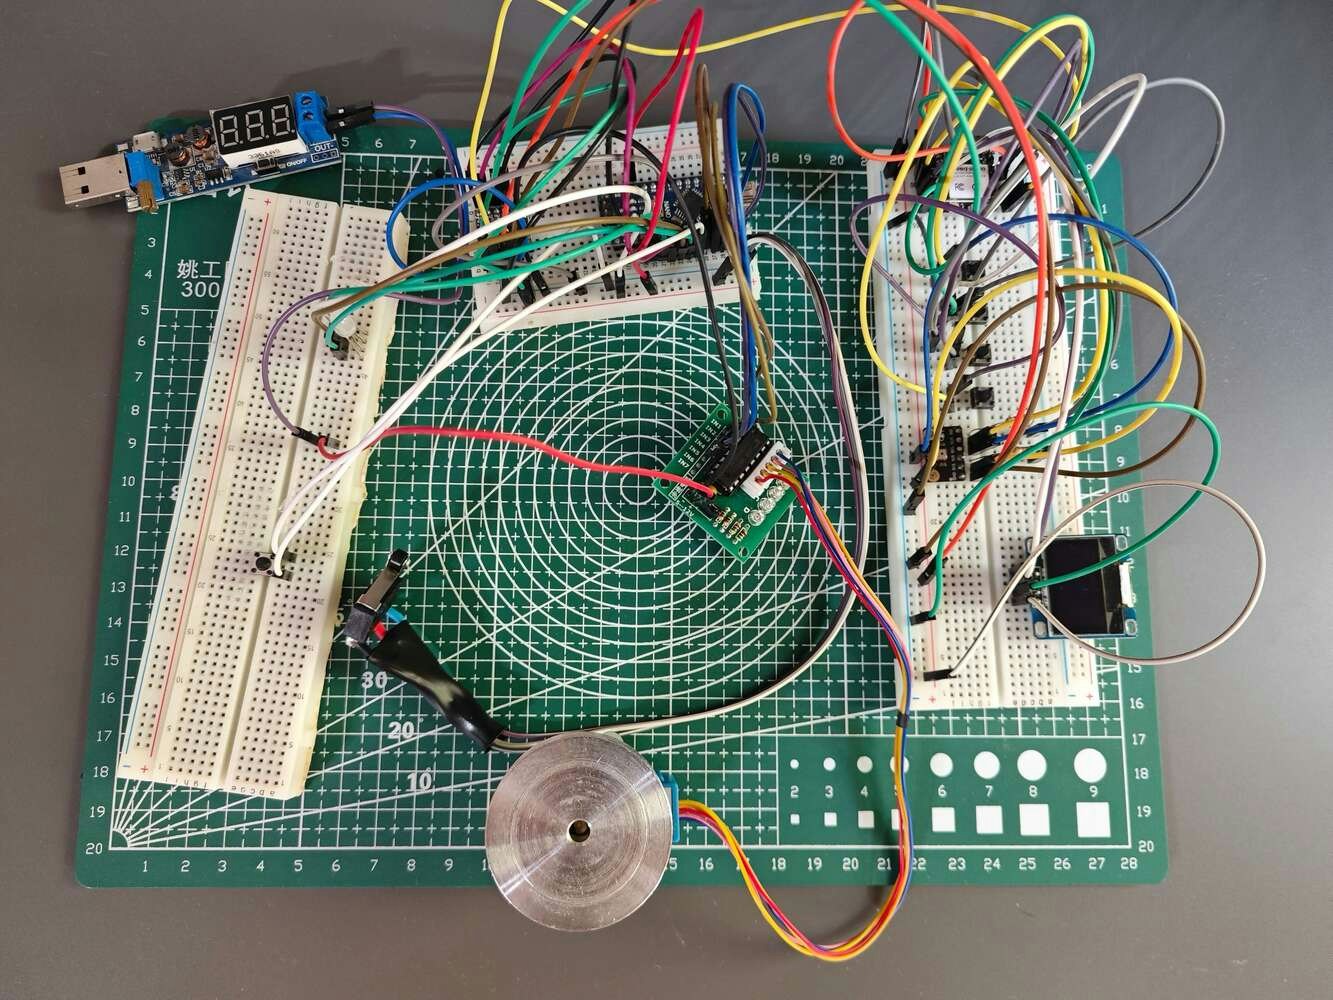
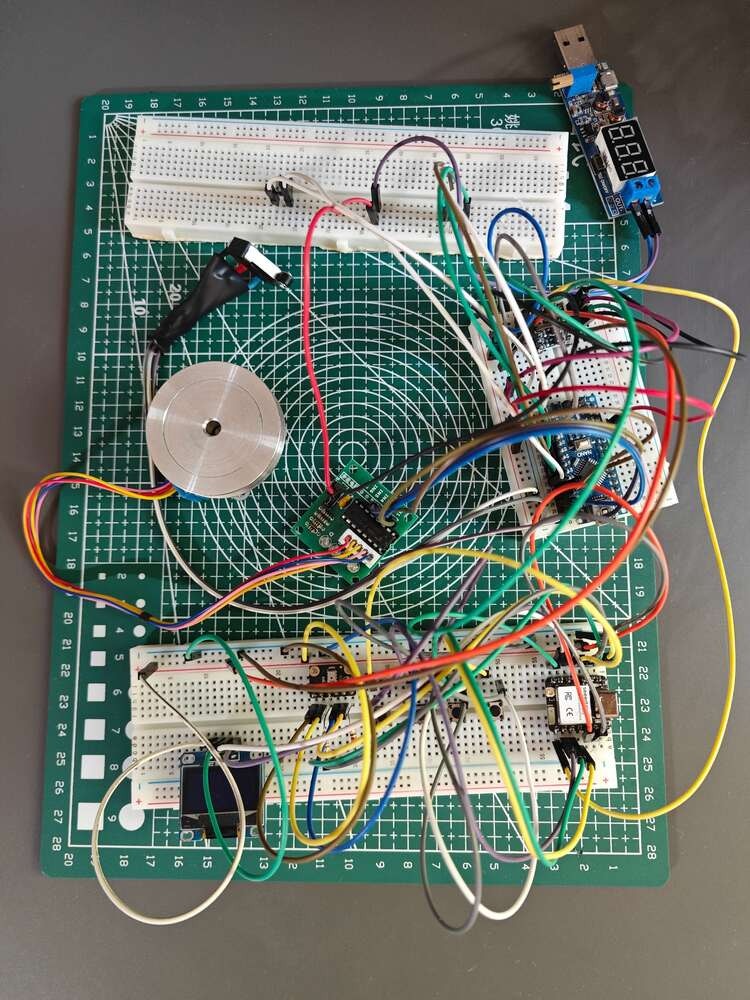
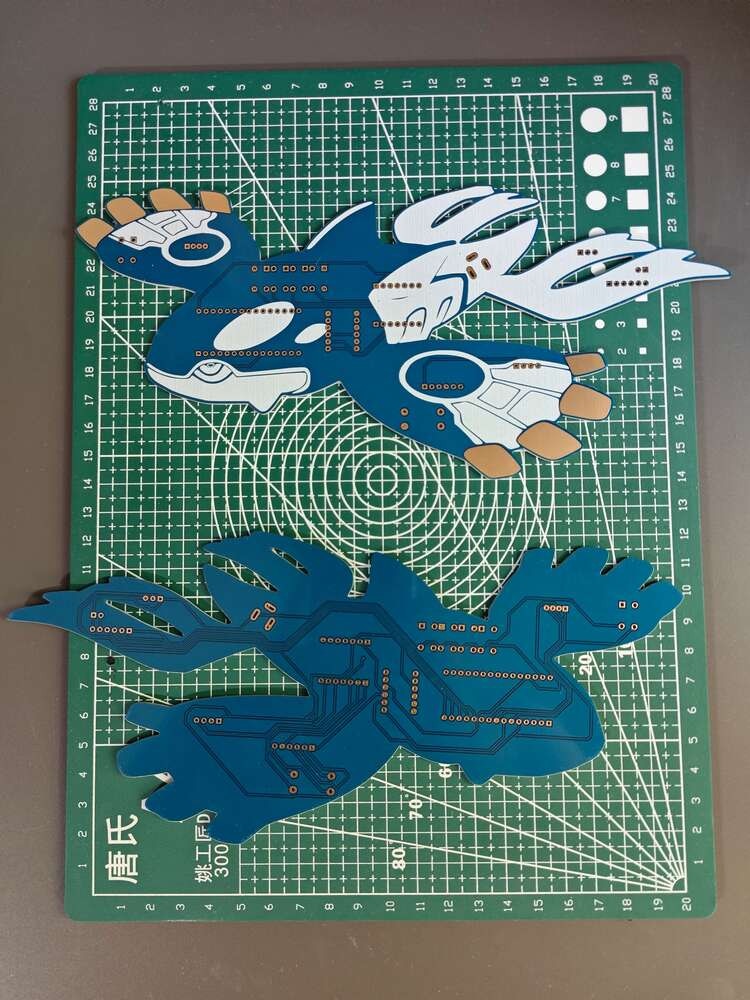
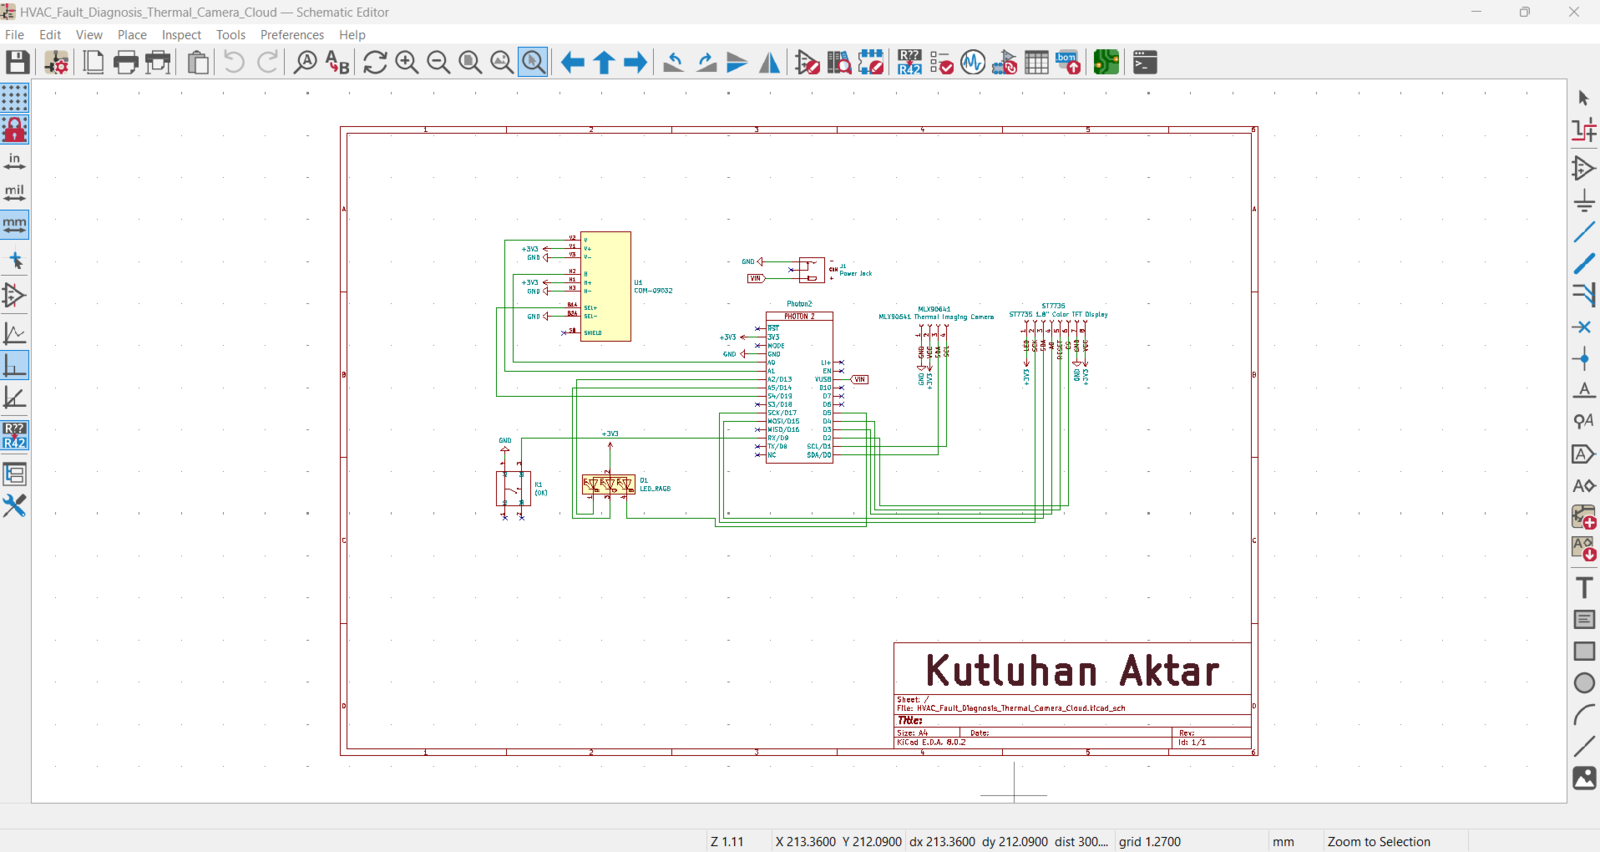
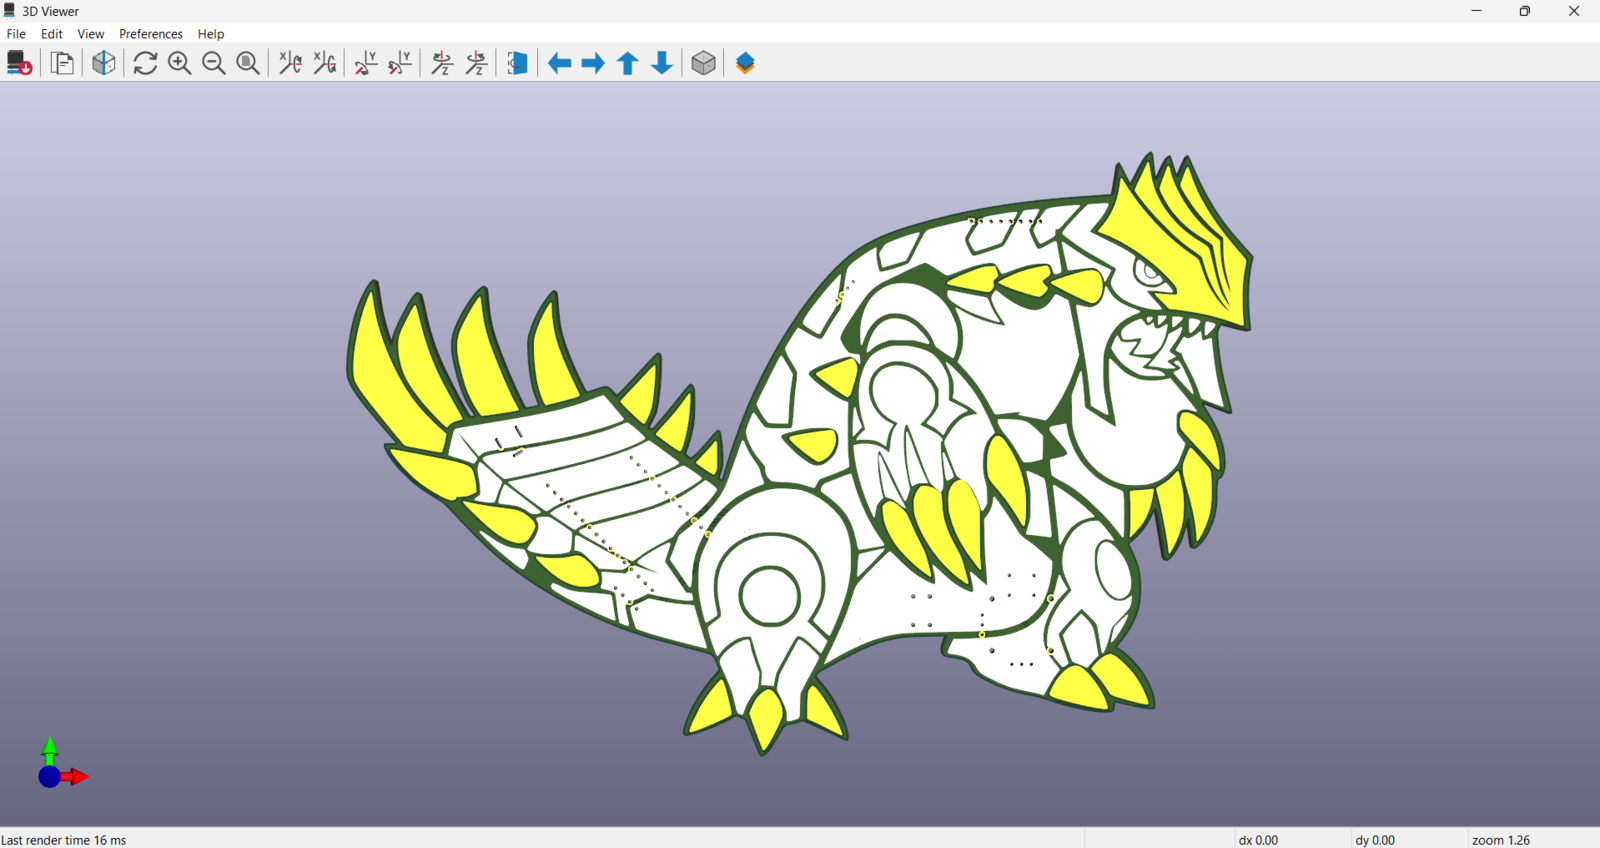
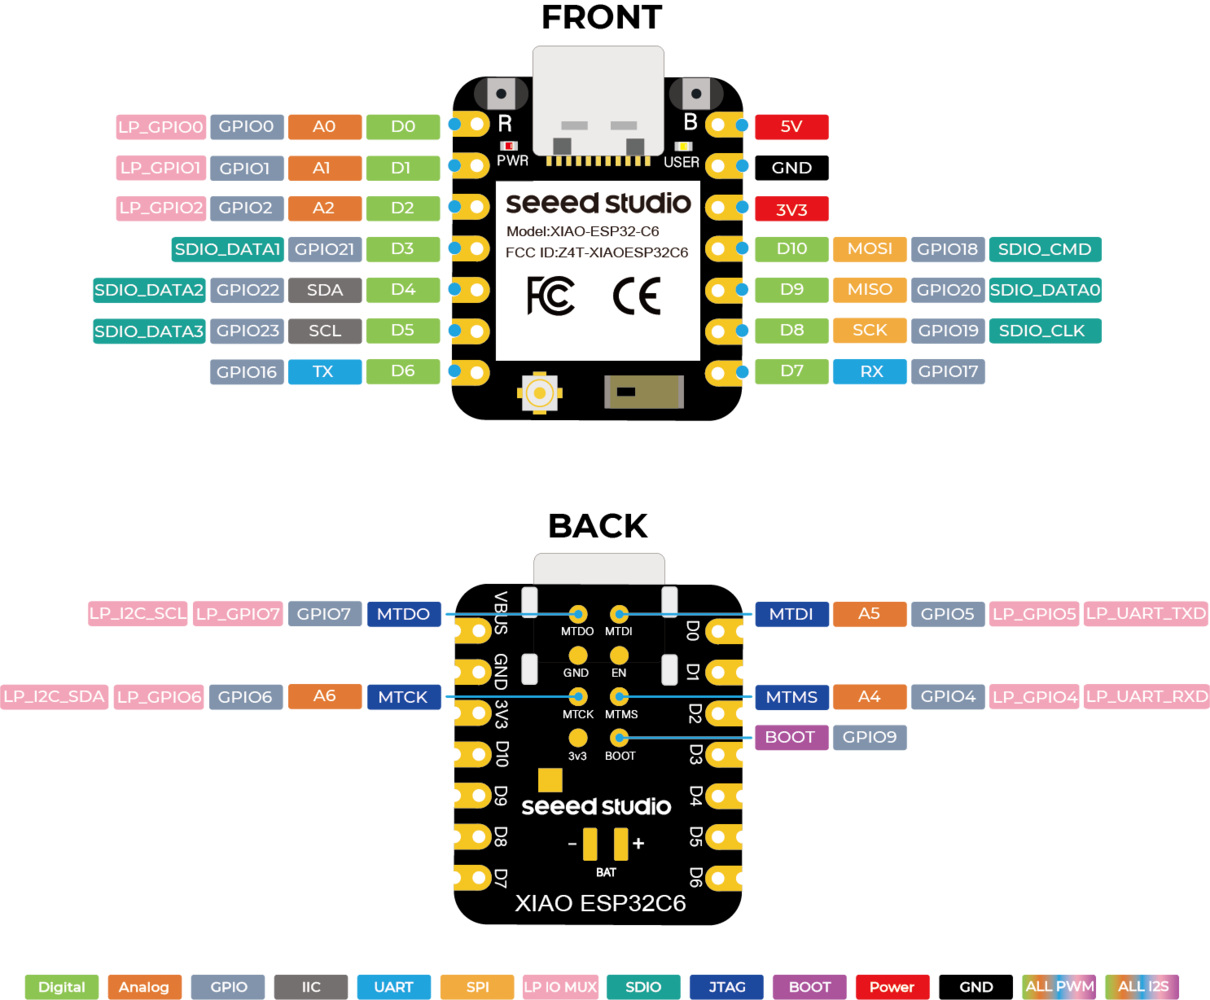
As I was developing device features, I noticed that I needed to run different data collection procedures and machine learning models simultaneously. Therefore, I decided to create two separate PCB designs to run the required tasks conclusively. Since I wanted my PCB designs to represent the equilibrium of cooling fan failures and thermal (heat) malfunctions, I got inspired by two ancient rival Pokémon: Kyogre and Groudon. Their legendary fights depict the epitome of the conflict between water cooling and exuberating heat :) Before prototyping my Kyogre-inspired PCB design, I inspected the detailed pin reference of XIAO ESP32C6 and needed to prepare components requiring soldering for programming. Aside from the other components, I employed a soldering station to solder jumper wires to each leg of the micro switch in order to make it compatible with the custom switch connector on the CNC router, which will be explained in the following steps.
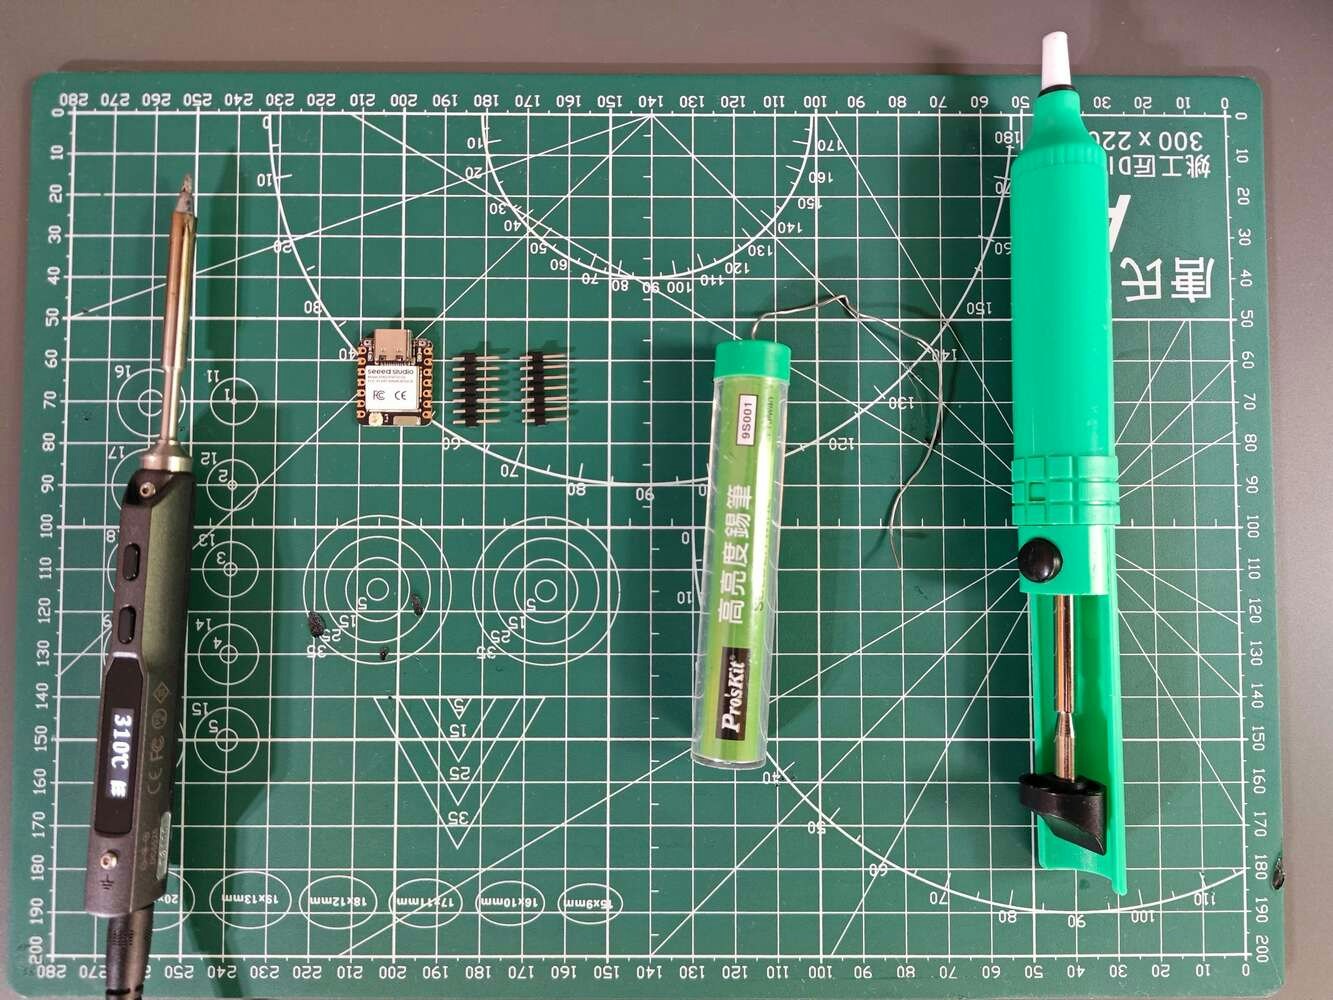
Breadboard prototype of the XIAO ESP32C6 audio controller with loose jumper wiring

57


Close-up of the I2S MEMS microphone wired to the XIAO ESP32C6 prototype

58


OLED display and control buttons connected for the Kyogre PCB prototype

59


Arduino Nano, level shifter, and XIAO ESP32C6 wired for serial communication tests

60

Then, I checked the wireless (Wi-Fi) and serial communication quality between XIAO ESP32C6, Arduino Nano, and the web dashboard (application) while transferring and receiving data packets. In the meantime, I also tested the torque capacity of the 28BYJ-48 stepper motor.
Stepper motor driver and RGB LED connected during CNC control prototyping

61


Complete breadboard sound and CNC prototype running with the connected displays

62

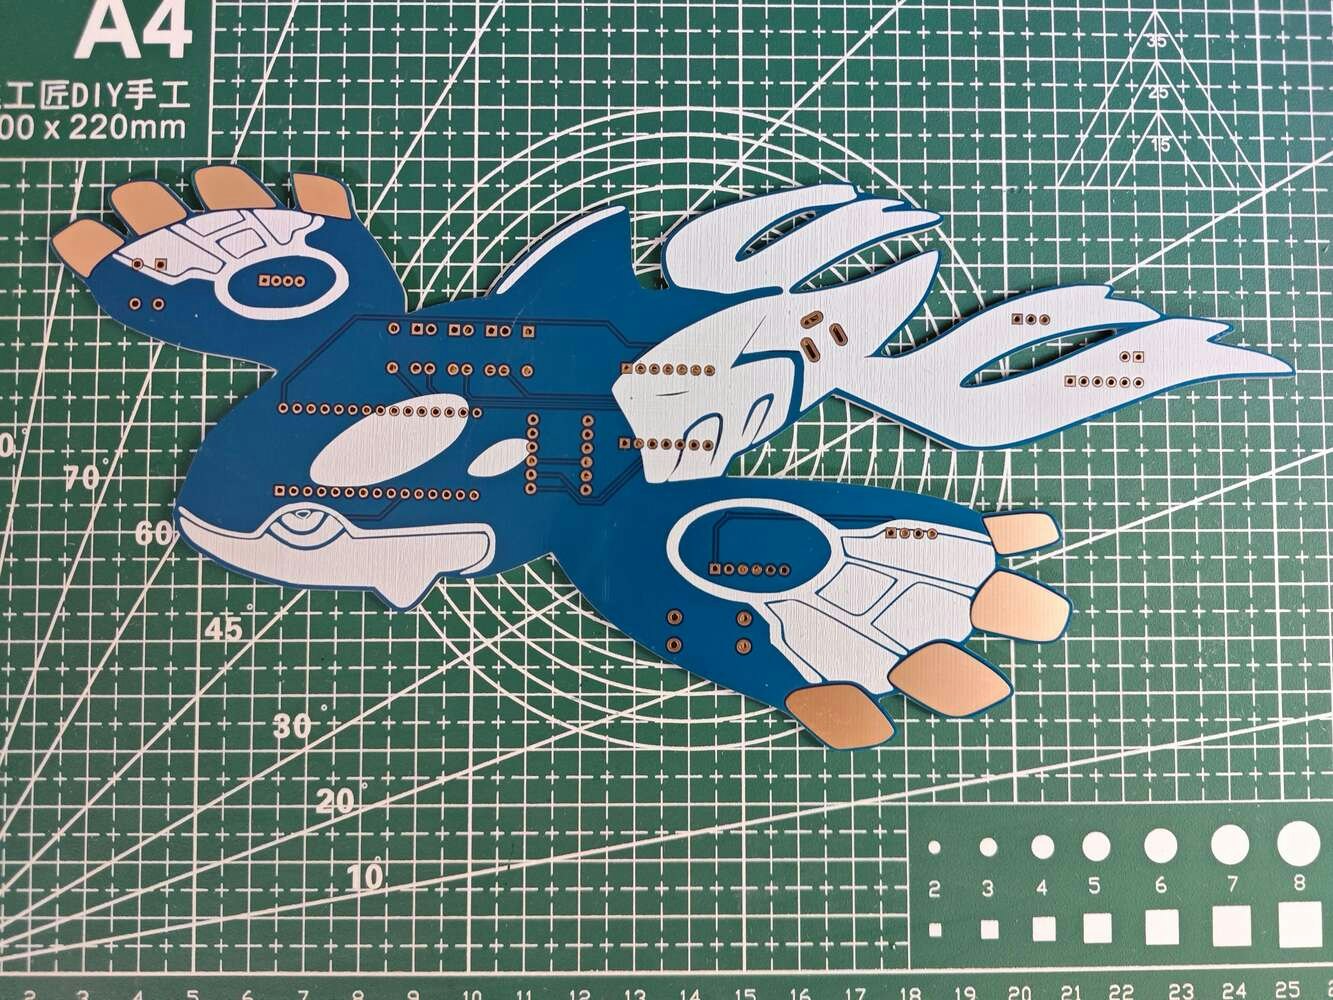
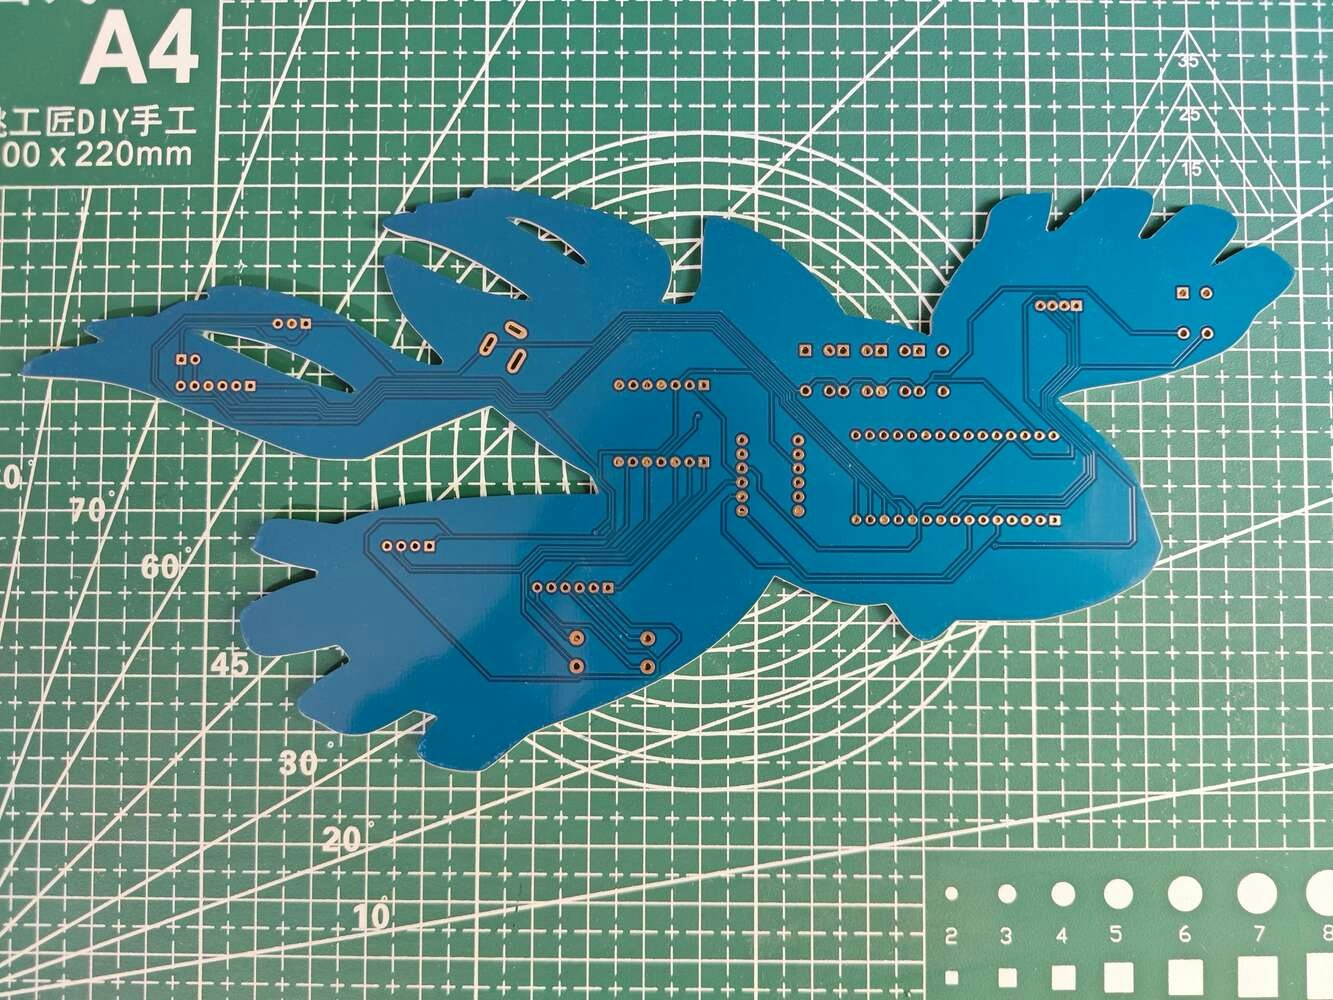
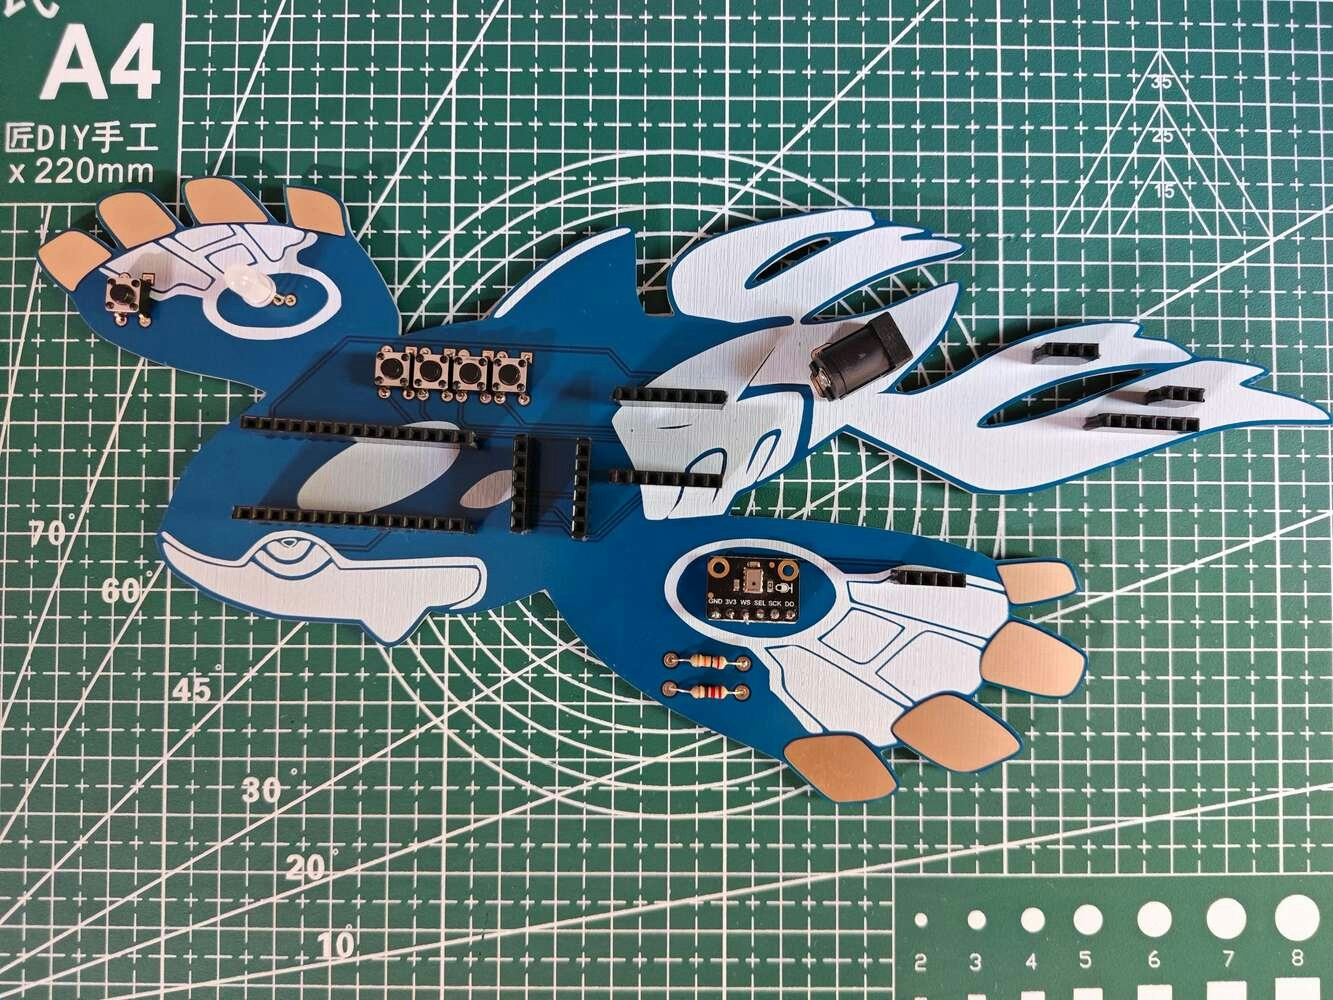
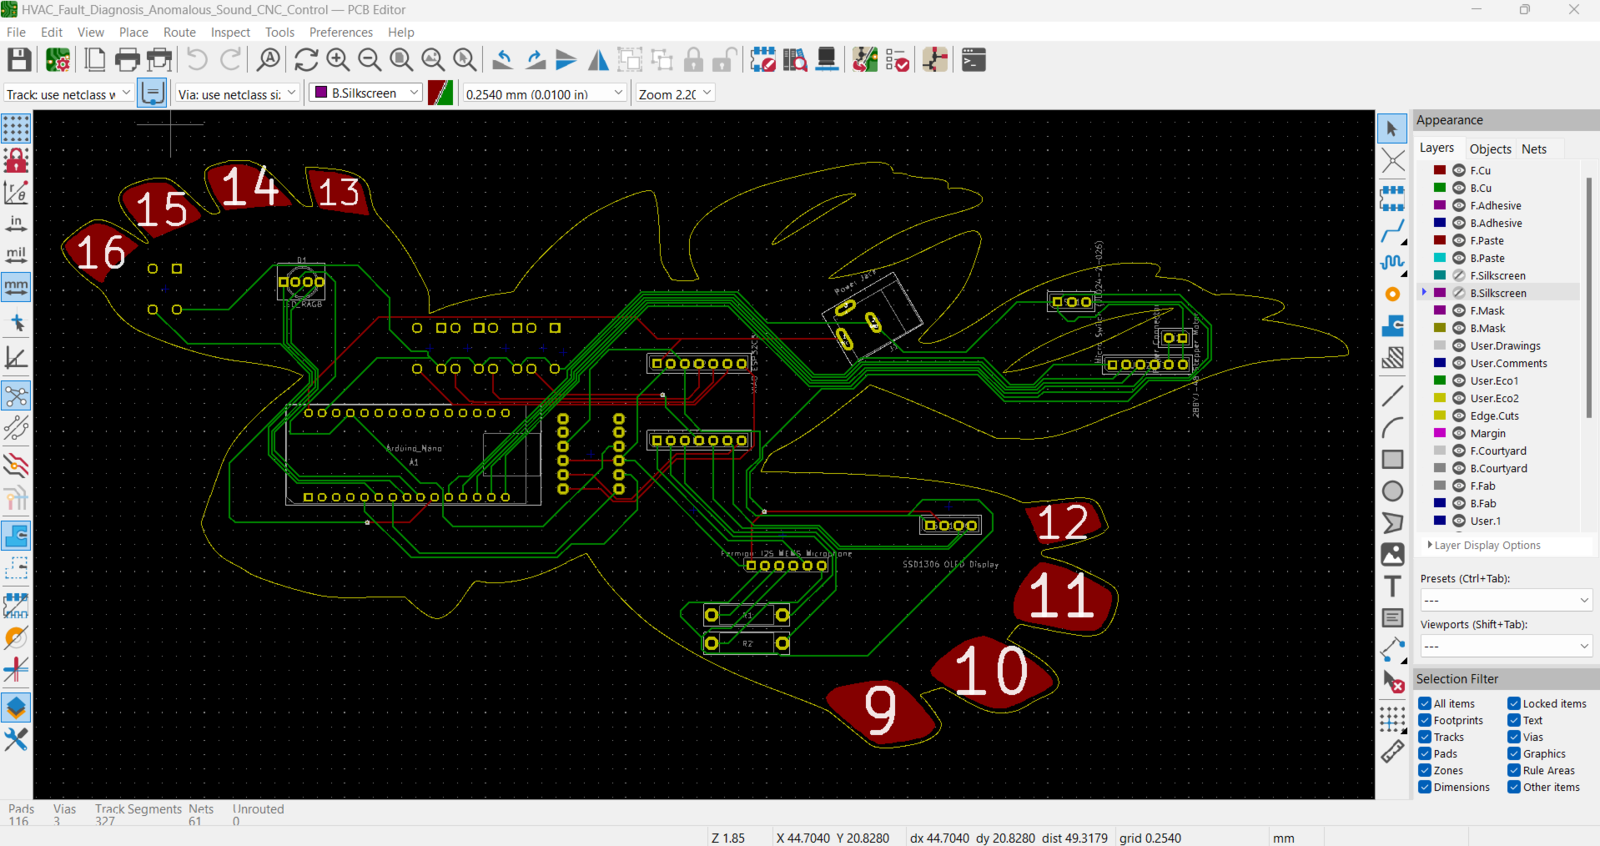
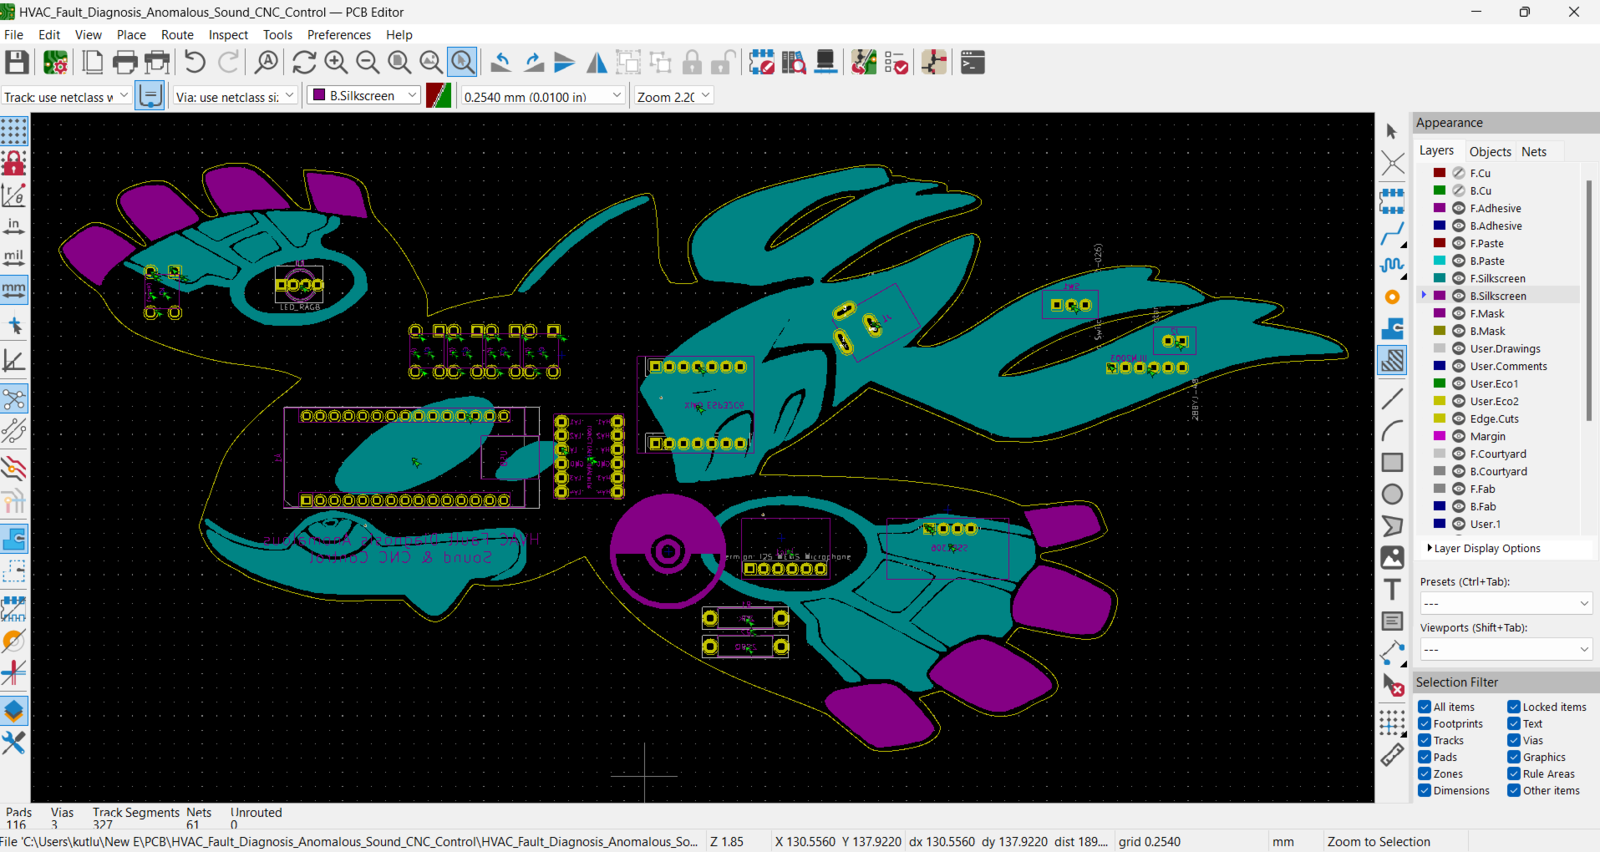
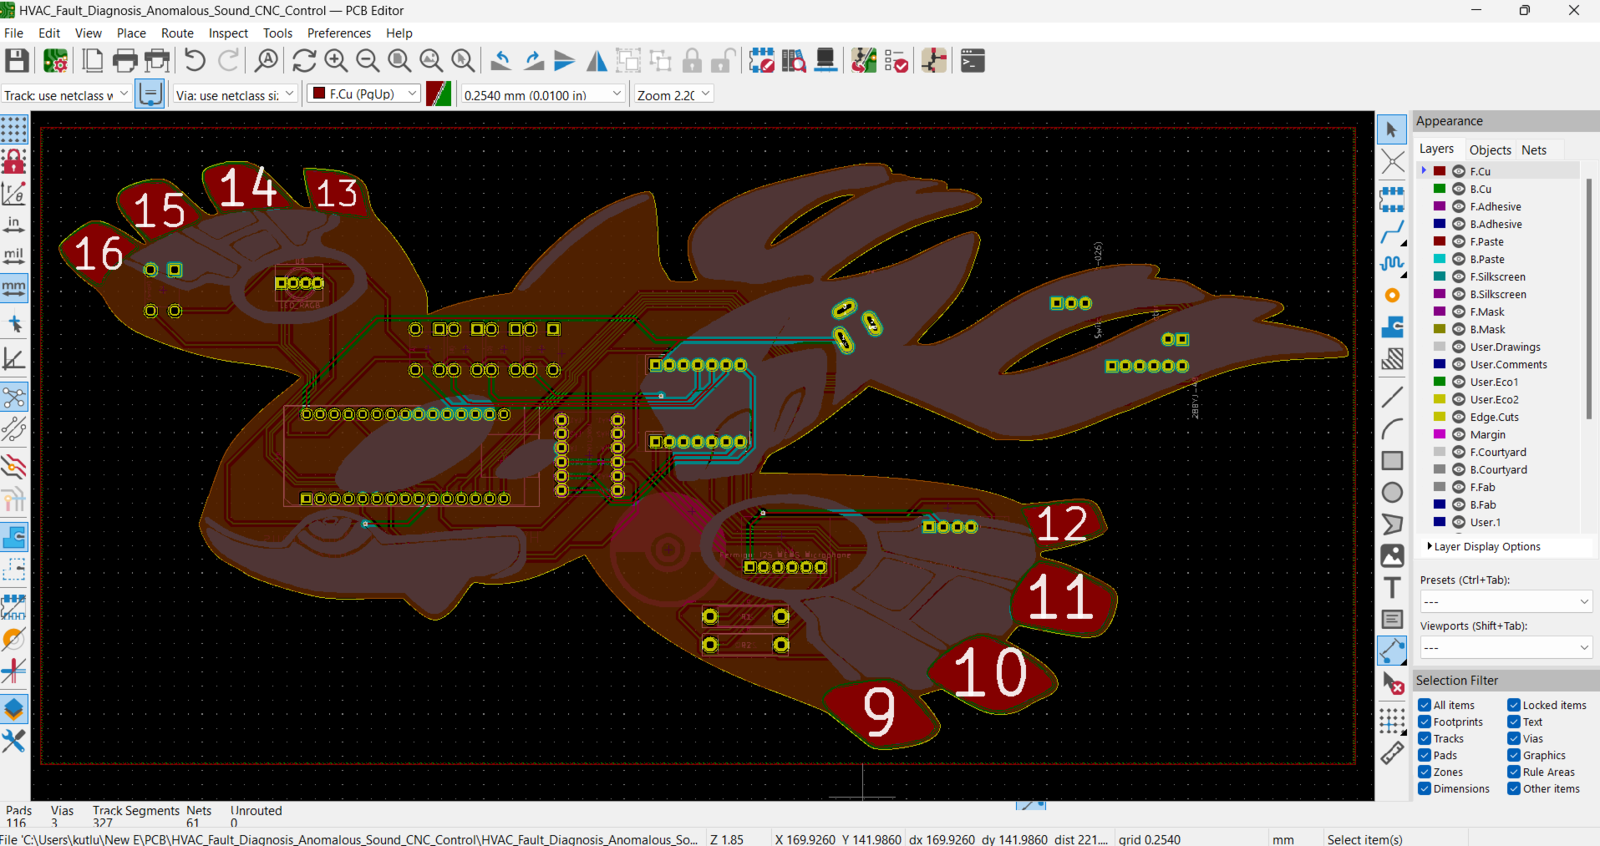
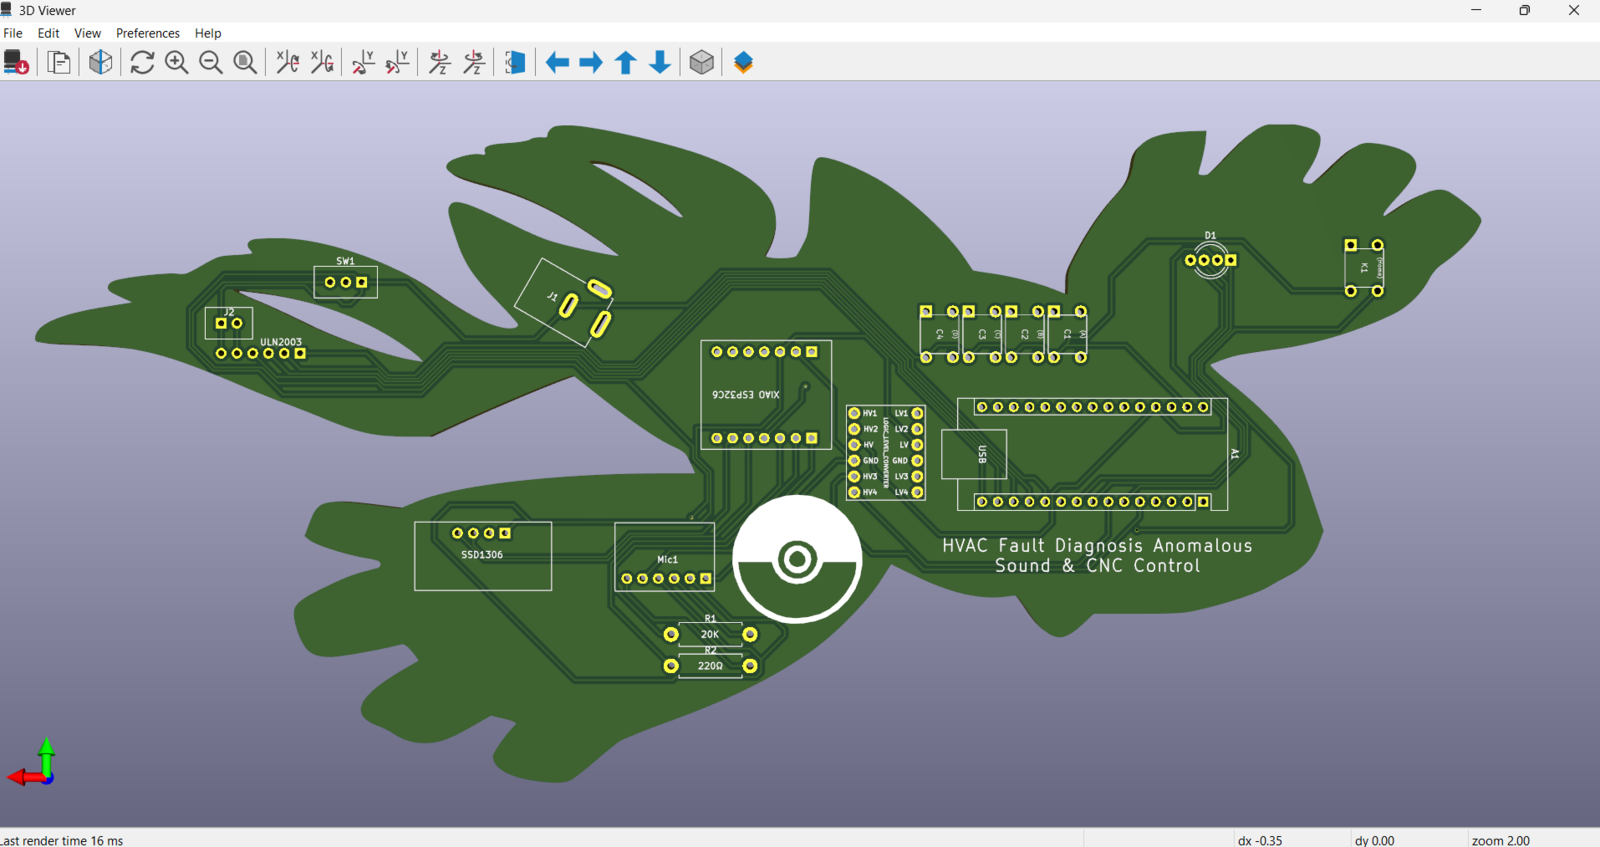
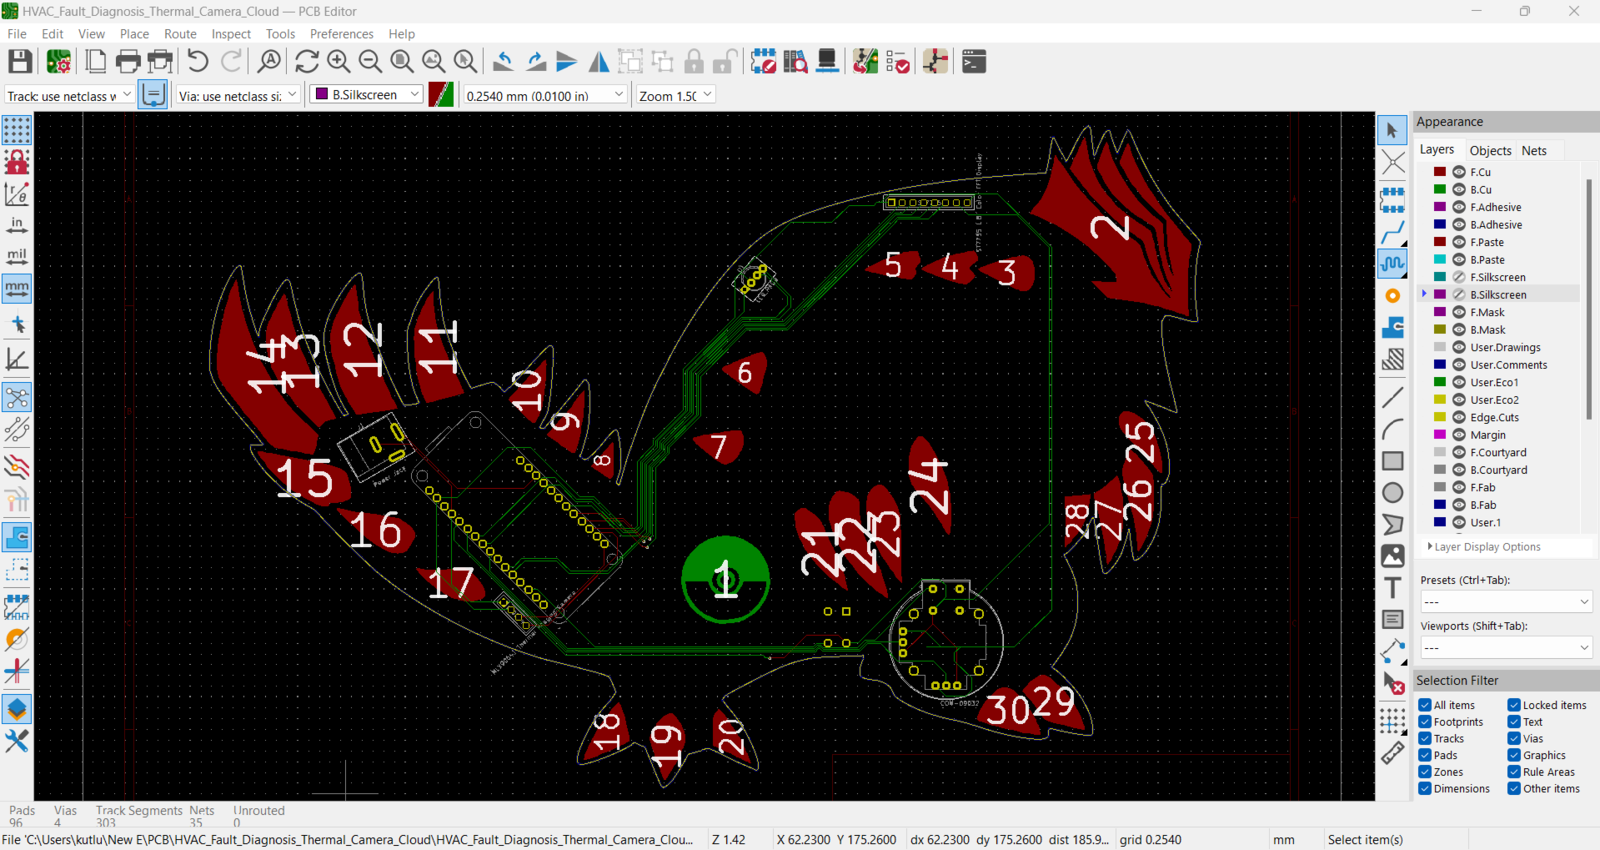
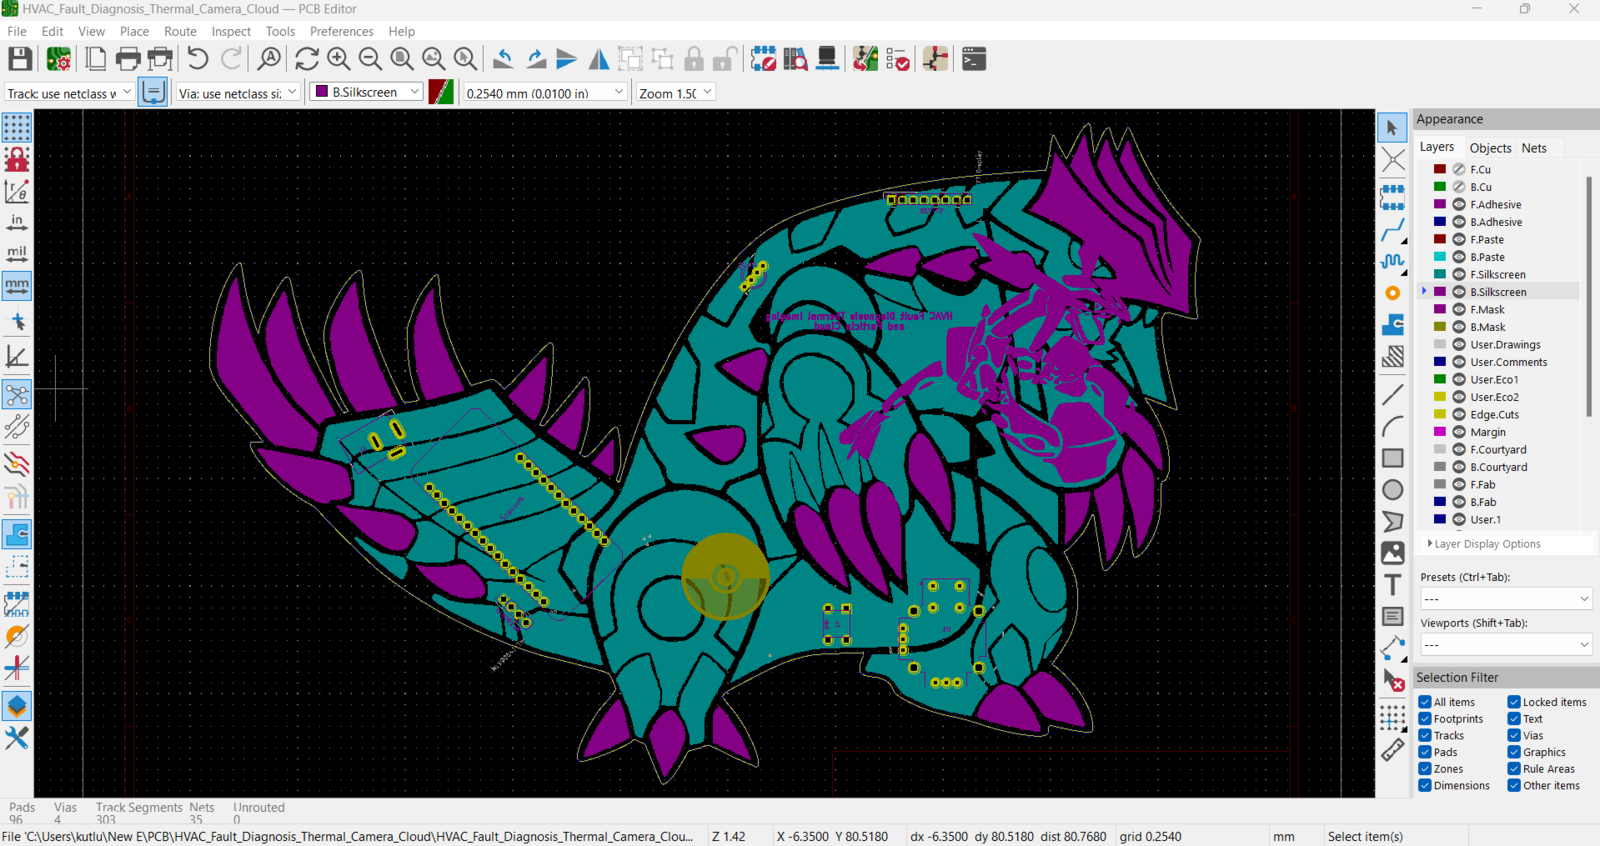
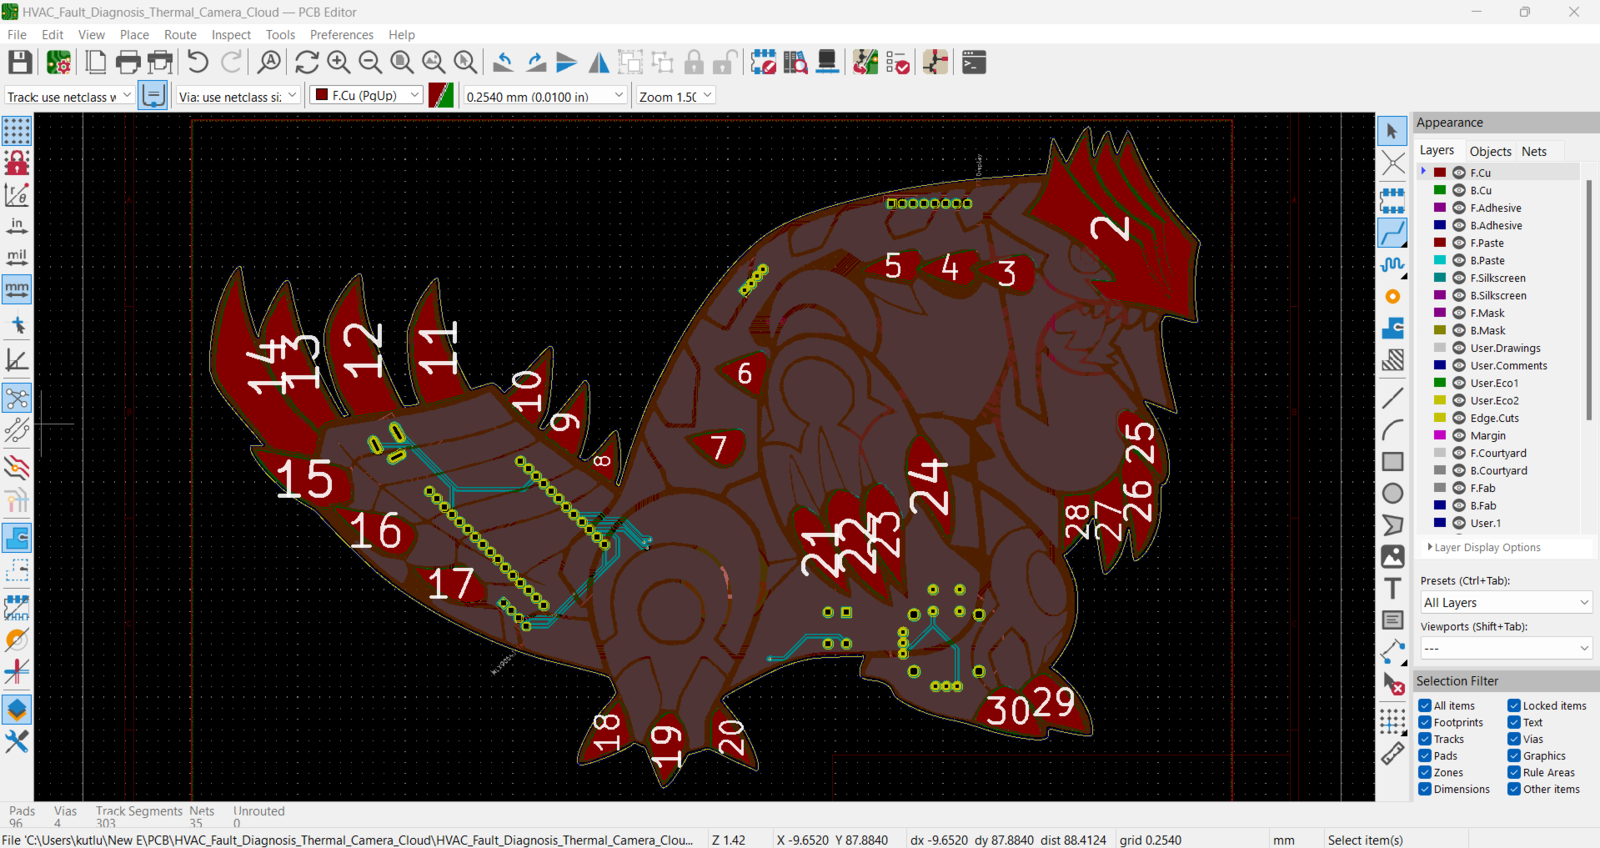
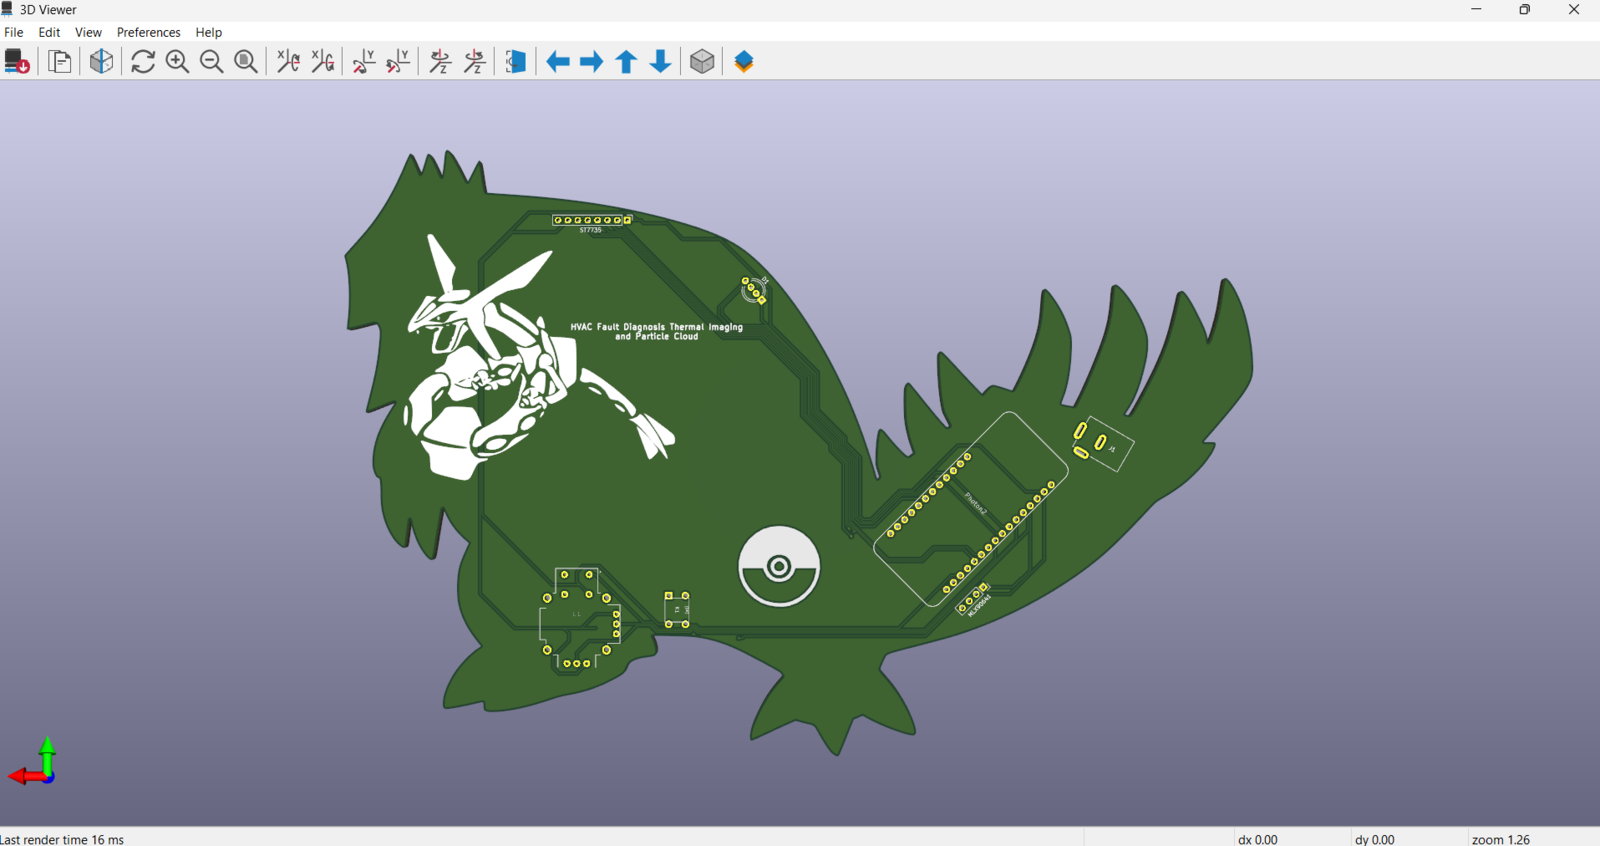
I designed my Kyogre-inspired PCB by utilizing Autodesk Fusion 360 and KiCad in tandem. Since I wanted to design a unique 3D-printed encasement to simplify the PCB integration to the special mounts (also 3D-printed) of the aluminum water cooling radiator, I created the PCB outline (edge) on Fusion 360 and then imported the outline file (DXF) to KiCad. In this regard, I was able to design custom 3D parts compatible with the PCB outline precisely. To replicate this malfunction detection device for water-cooled HVAC systems, you can download the Gerber file below or order the discussed PCB design directly from my ELECROW community page.
KiCad layout view of the Kyogre-shaped sound and CNC PCB

63


Rendered Kyogre PCB showing component placement before fabrication

64


Manufactured Kyogre PCB with blue solder mask and white silkscreen

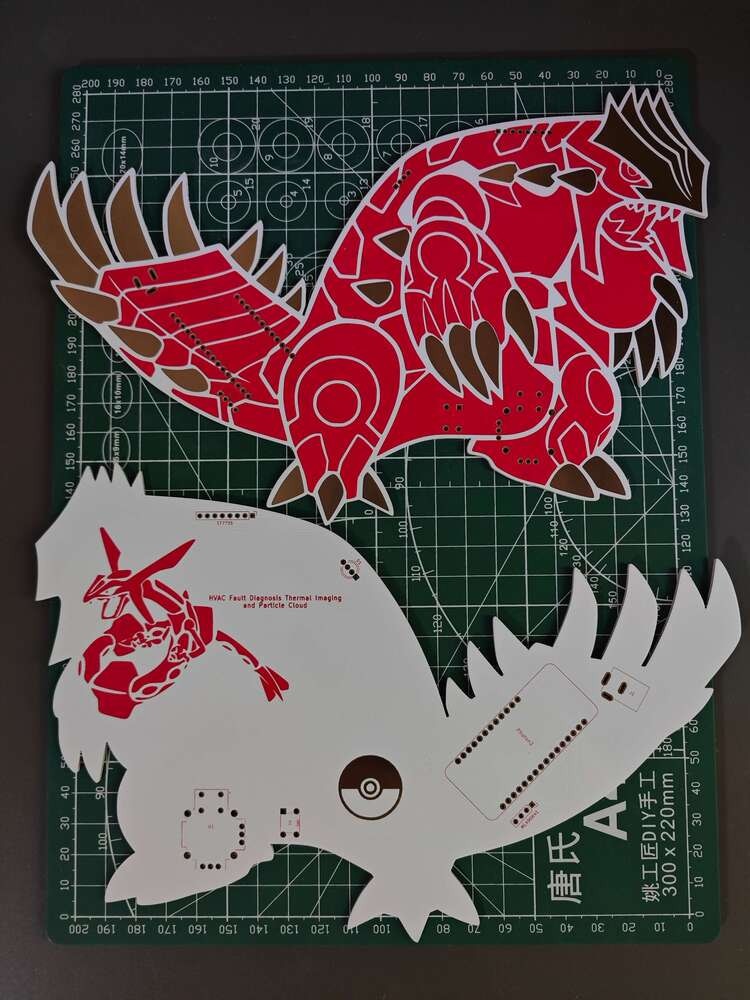
65

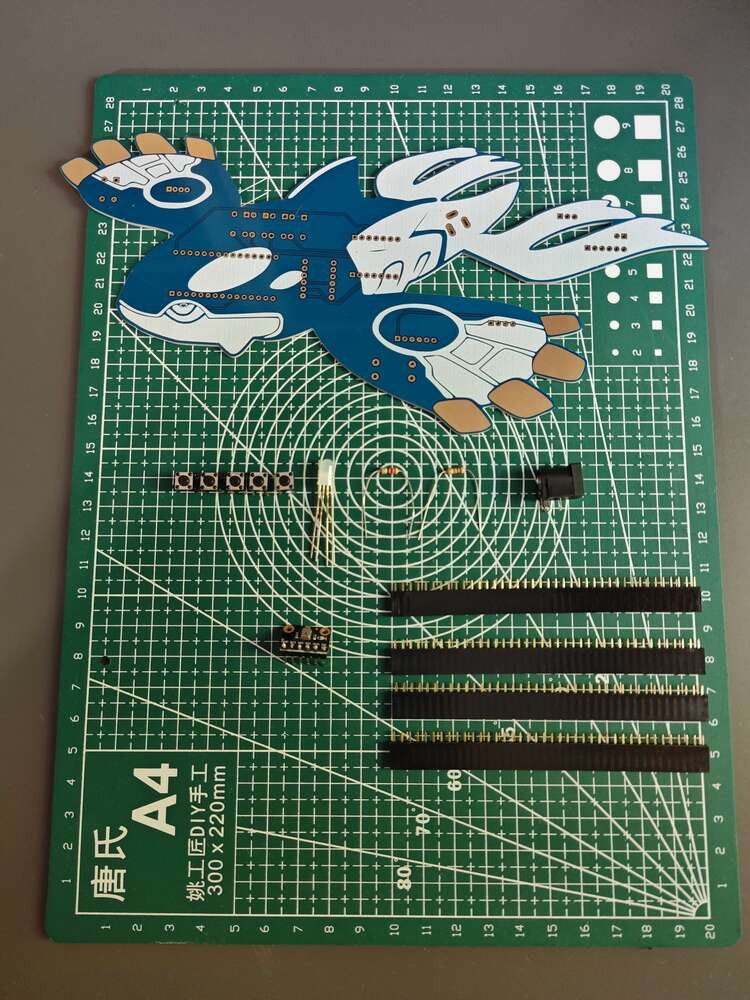
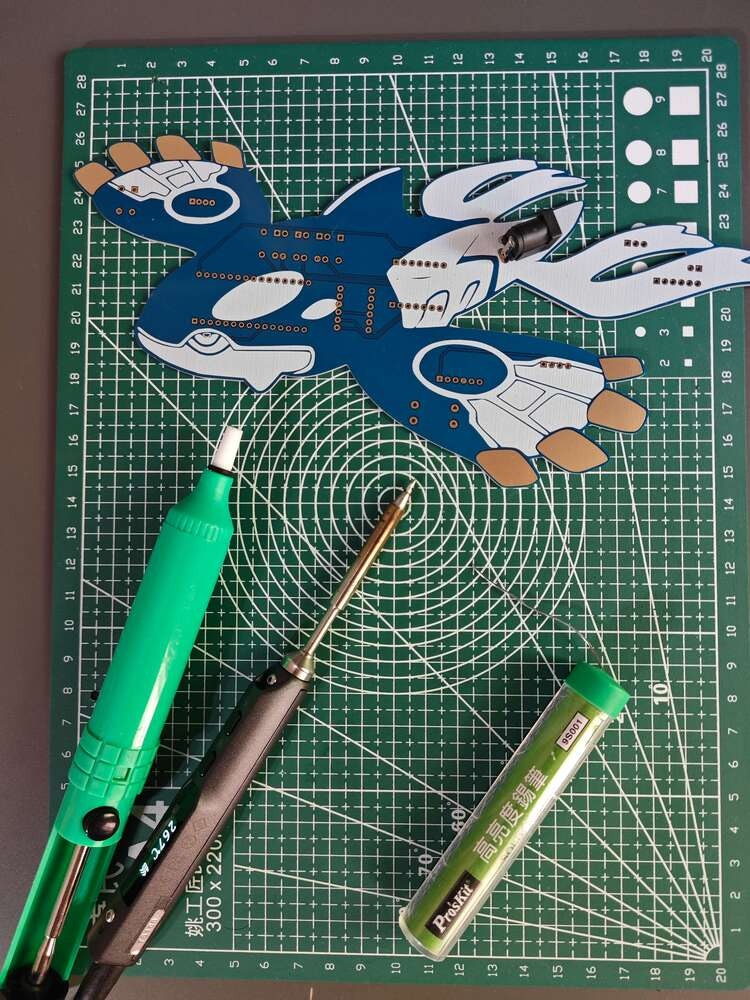
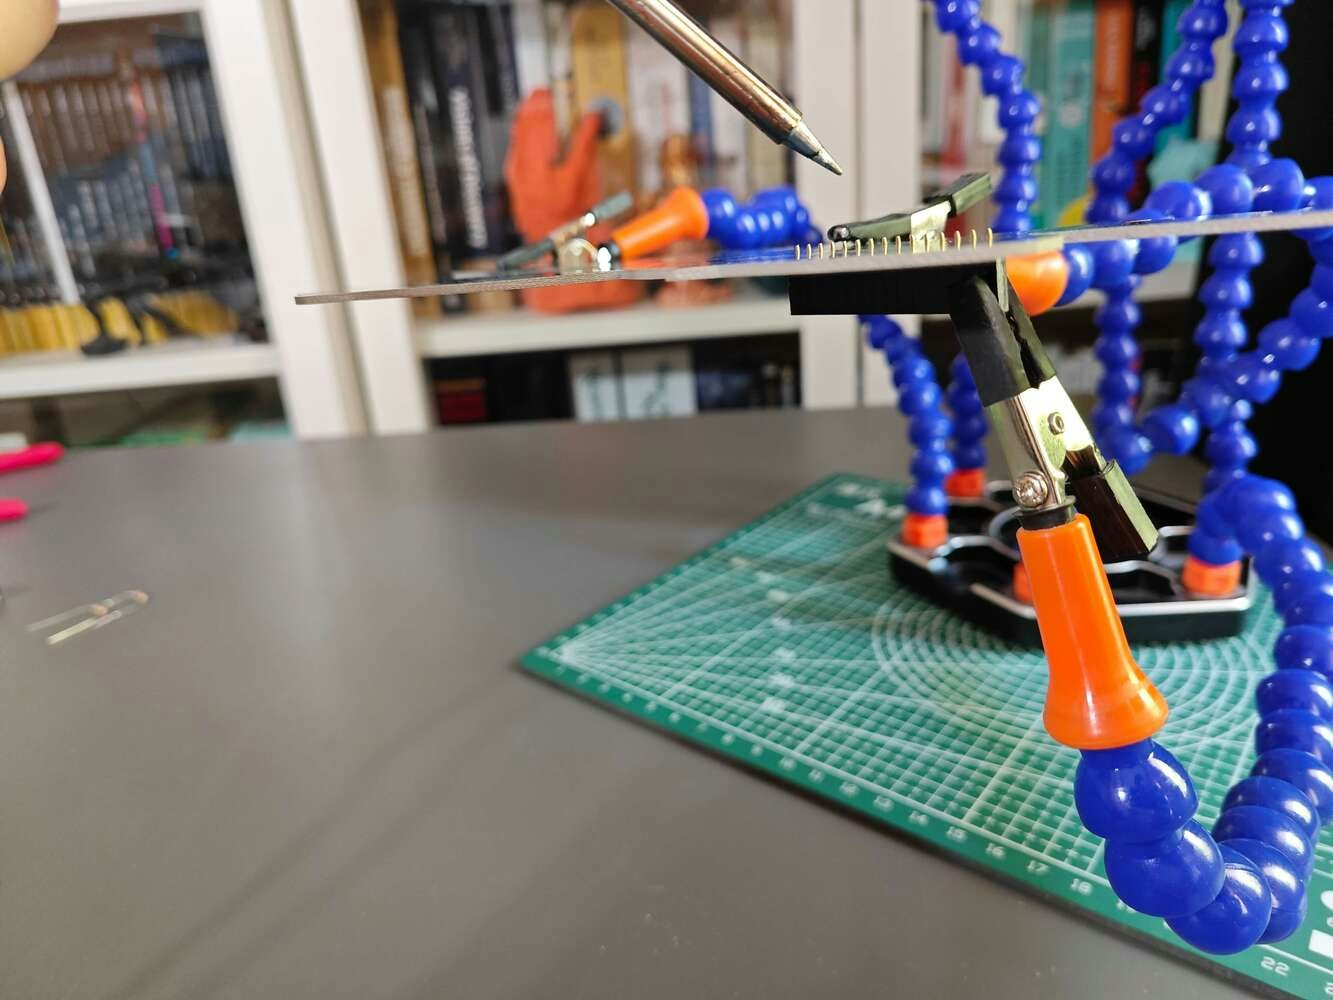
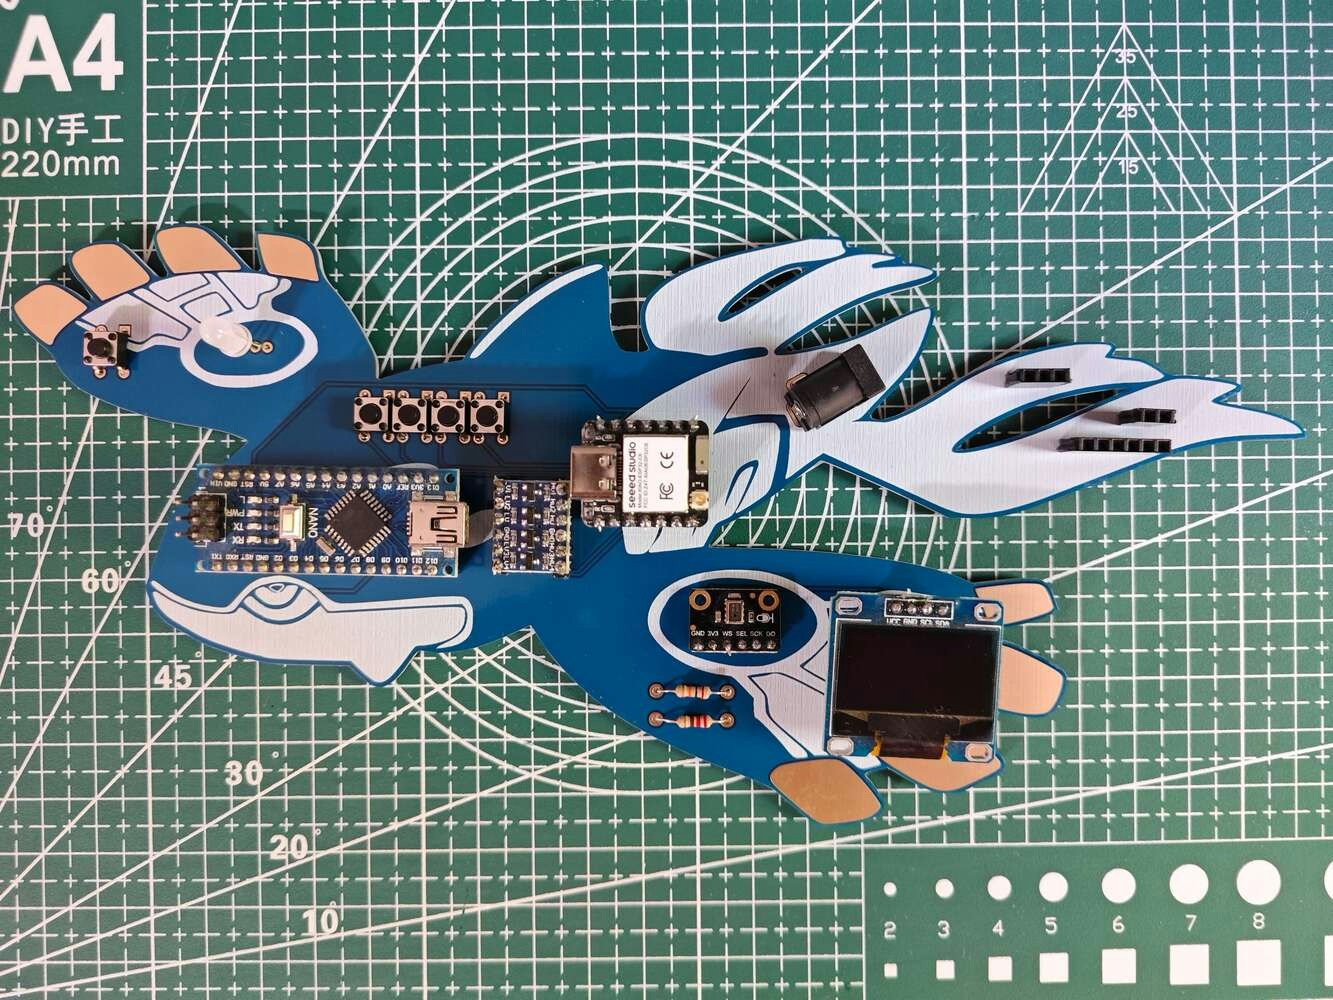
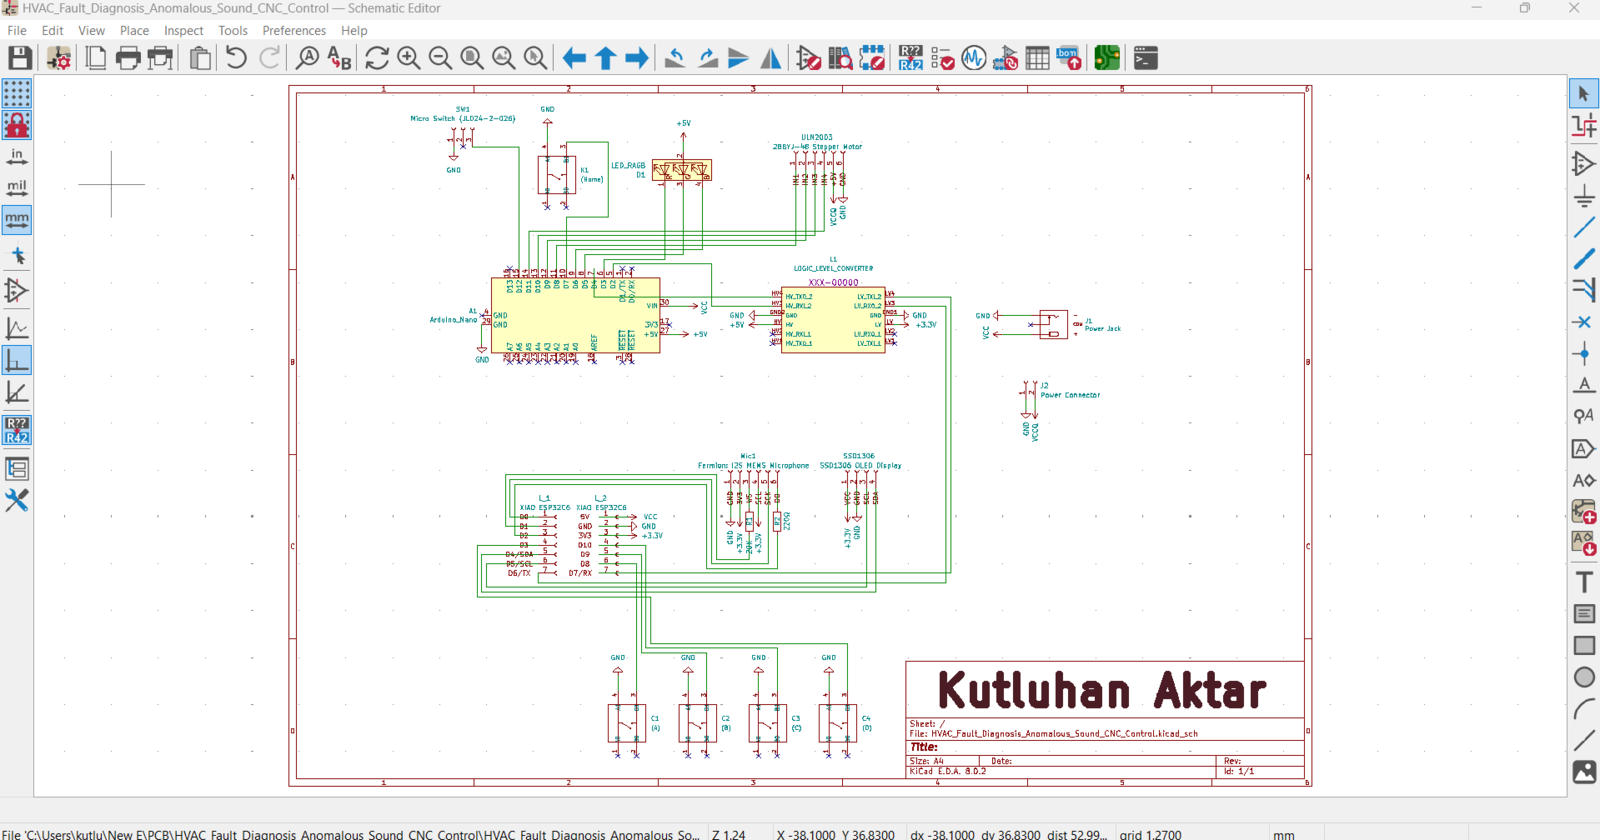
By utilizing a TS100 soldering iron, I attached the component list depicted below. 📌 Component list of the Kyogre PCB: L_1, L_2 (Headers for XIAO ESP32C6) A1 (Headers for Arduino Nano) Mic1 (Fermion: I2S MEMS Microphone) SSD1306 (Headers for SSD1306 OLED Display) L1 (Headers for Bi-Directional Logic Level Converter) SW1 (Micro Switch (JL024-2-026)) ULN2003 (Headers for 28BYJ-48 Stepper Motor) R1 (20K Resistor) R2 (220Ω Resistor) C1, C2, C3, C4, K1 (6x6 Pushbutton) D1 (5 mm Common Anode RGB LED) J2 (Headers for Additional Stepper Motor Power Supply) J1 (Power Jack) Since some components were tricky to solder due to the unique structure of the Kyogre PCB, I utilized the soldering station to hold the problematic parts.
Kyogre PCB laid out with unsoldered headers, buttons, and level shifter parts

66


Soldered Kyogre PCB with XIAO ESP32C6 and Arduino Nano headers installed

67


Kyogre PCB close-up showing the OLED connector and control button row

68


Kyogre PCB with display, microphone, and CNC control wiring attached

69


Kyogre PCB with display, microphone, and CNC control wiring attached

70

After concluding soldering all components, I tested whether the Kyogre PCB operated as expected or was susceptible to electrical issues.
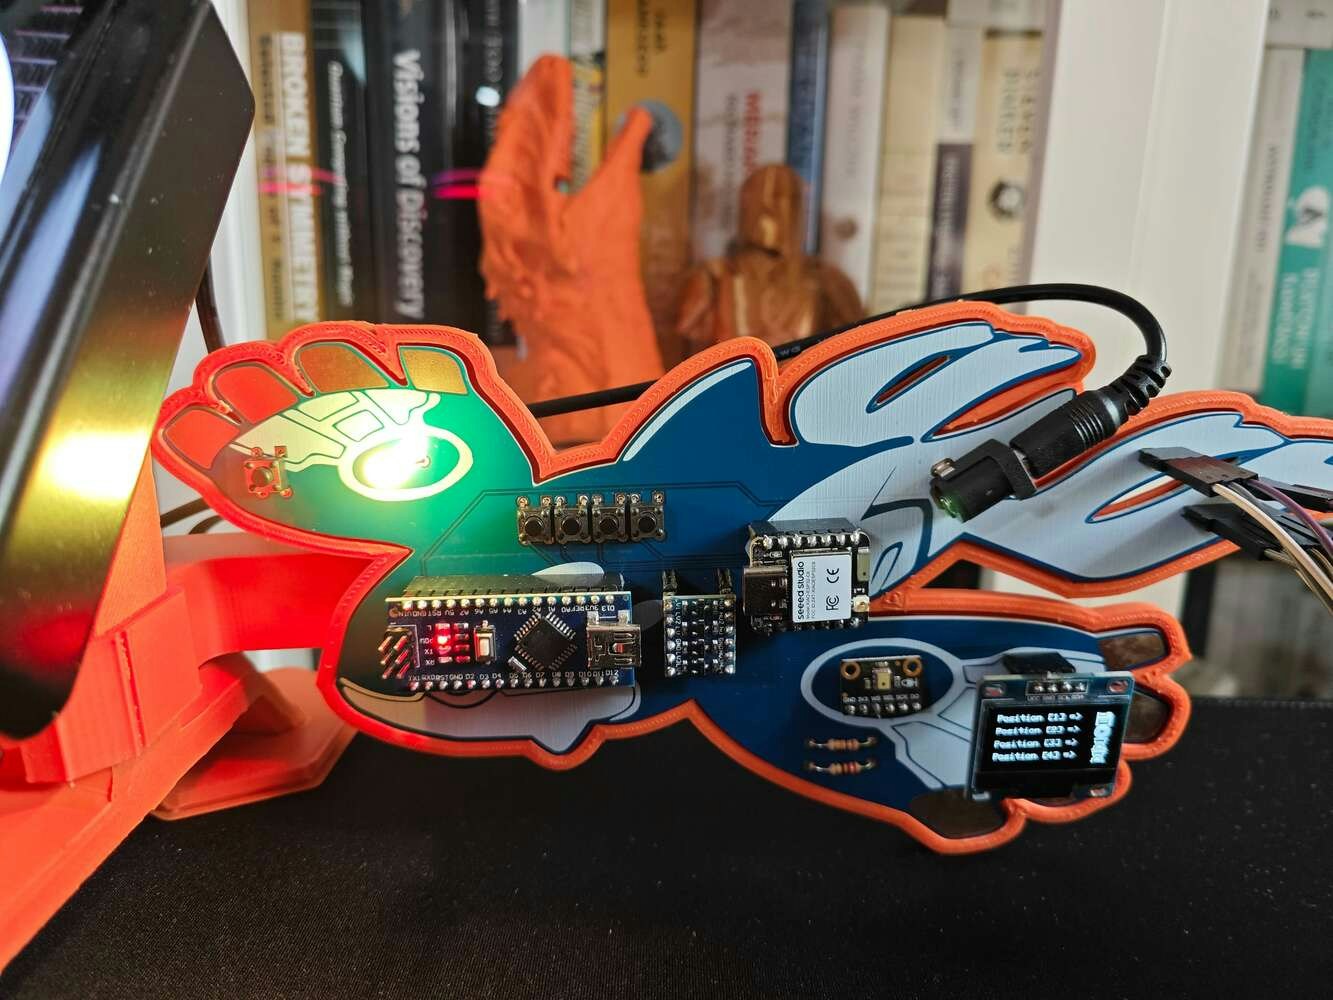
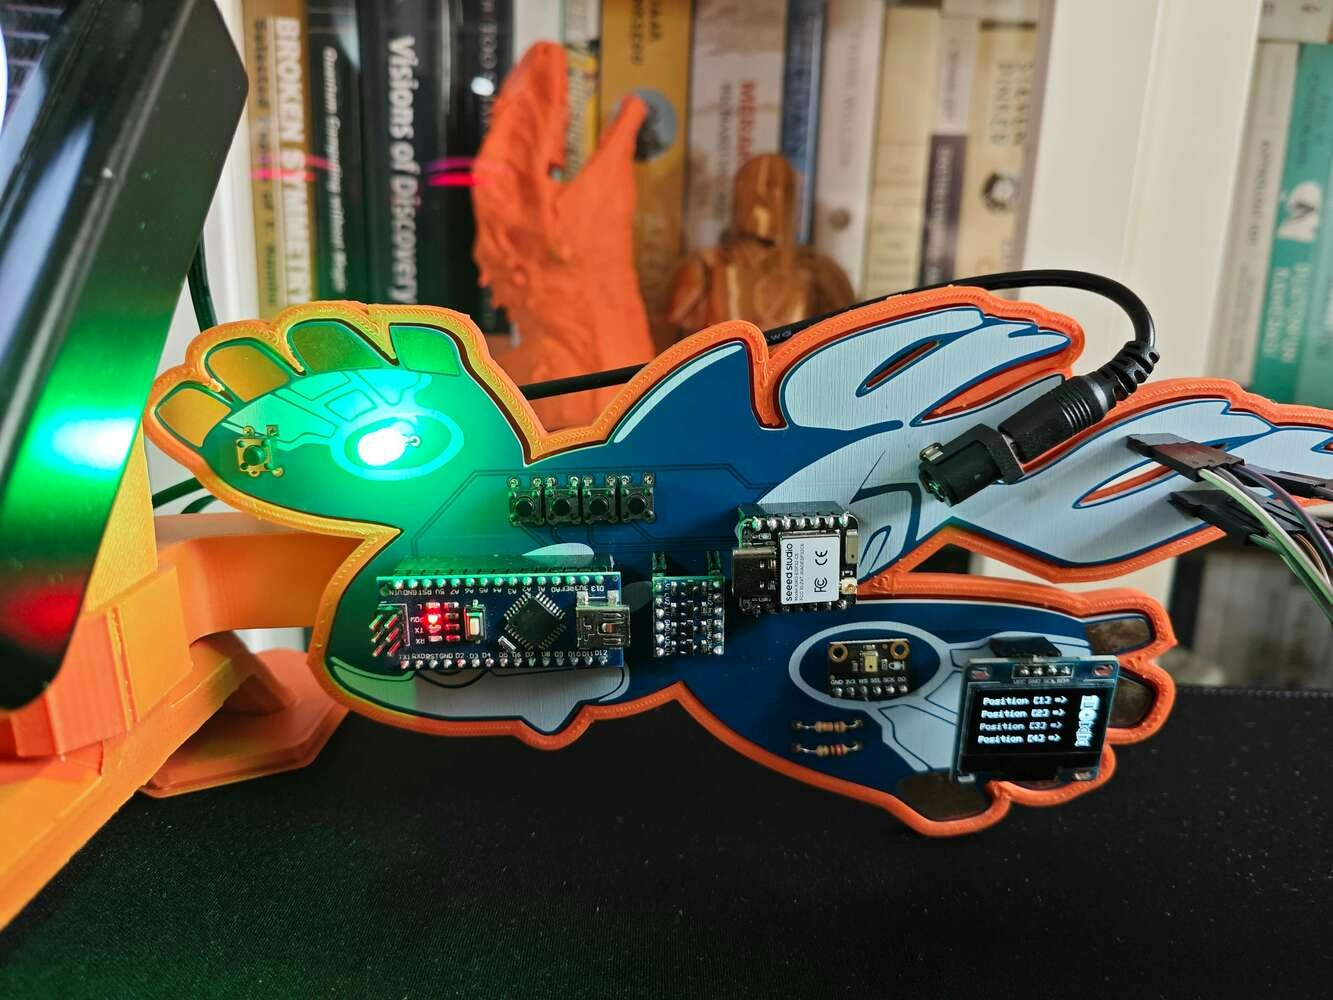
Completed Kyogre PCB mounted in its orange printed enclosure

71

Step 1.a.1: Making connections and adjustments on the Kyogre PCB
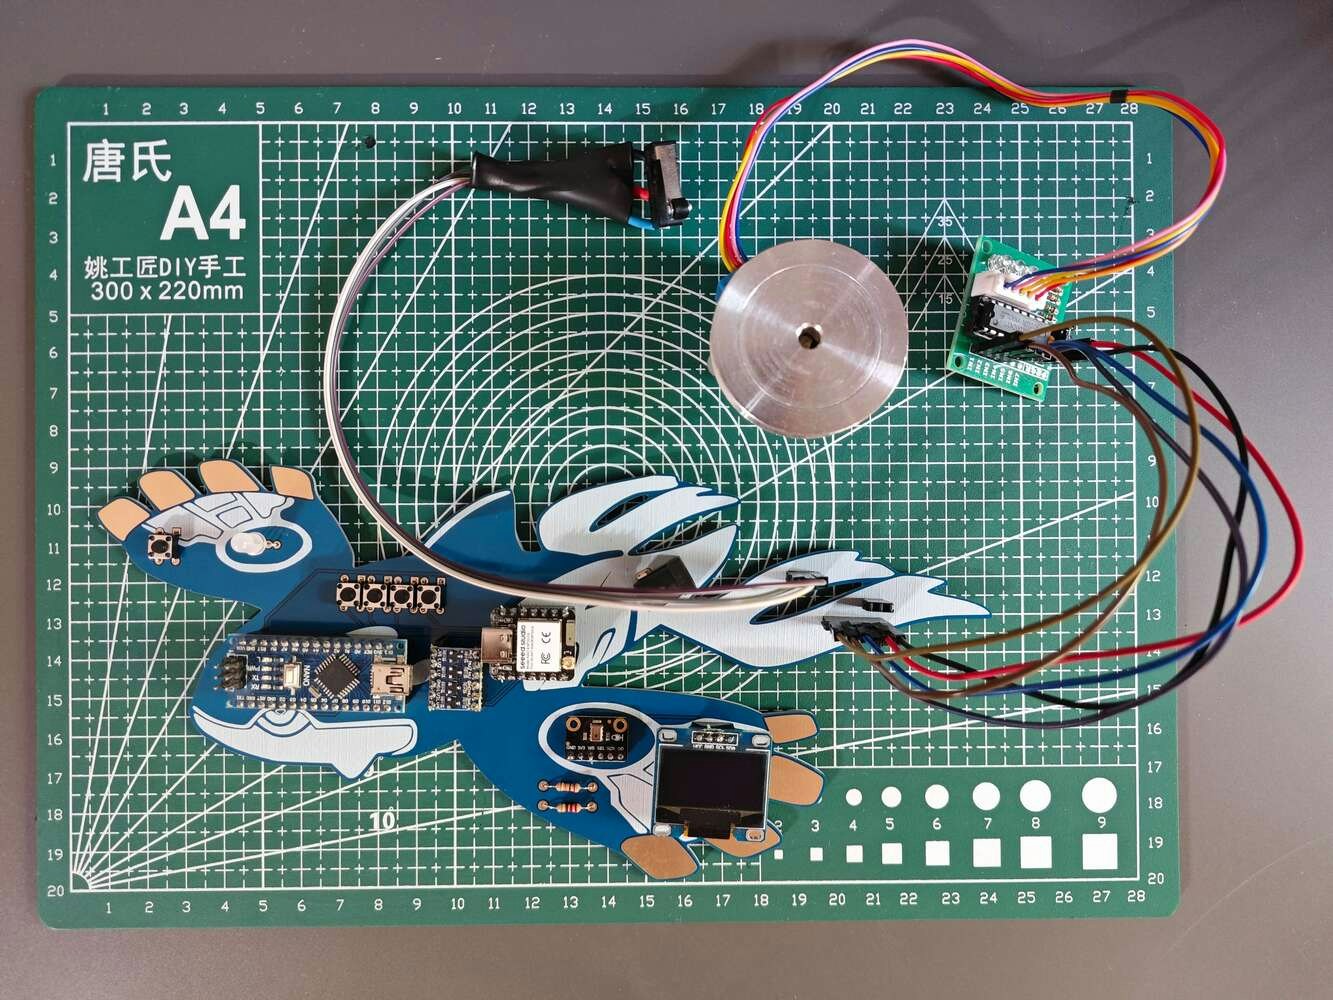
:hash: Since XIAO ESP32C6 is a feature-rich development board providing an I2S port, I was able to connect a Fermion I2S MEMS microphone to collect raw audio buffers easily. Nevertheless, after conducting some experiments, I noticed the produced audio buffers were noisy or completely inaccurate. Therefore, I added additional resistors to the WS (+20K) and DO (+220Ω) pins of the I2S microphone. Then, I managed to obtain precise raw audio buffers. :hash: To provide the user with a feature-packed interface, I connected an SSD1306 OLED display and four control buttons to XIAO ESP32C6. I also connected an RGB LED to Arduino Nano to inform the user of the CNC router status while performing operations according to the CNC commands transferred by XIAO ESP32C6. :hash: Since Arduino Nano operates at 5V and XIAO ESP32C6 requires 3.3V logic level voltage, their pins cannot be connected directly, even for serial communication. Therefore, I utilized a bi-directional logic level converter to shift the voltage for the connections between XIAO ESP32C6 and Arduino Nano. :hash: To control the CNC router effortlessly, I connected a 28BYJ-48 stepper motor to Arduino Nano via its built-in ULN2003 driver module. Since I wanted to implement automatic homing sequence to the CNC router, I connected a micro switch with pulley (JL024-2-026) to Arduino Nano, similar to a 3D printer switch. :hash: Since the 28BYJ-48 stepper motor can be current-demanding on full load, I connected an additional 5V battery to supply the stepper motor without damaging other components.
Kyogre PCB connection diagram for the microphone, OLED, buttons, and CNC serial wiring

72

Step 1.b: Designing and soldering the Groudon-inspired PCB

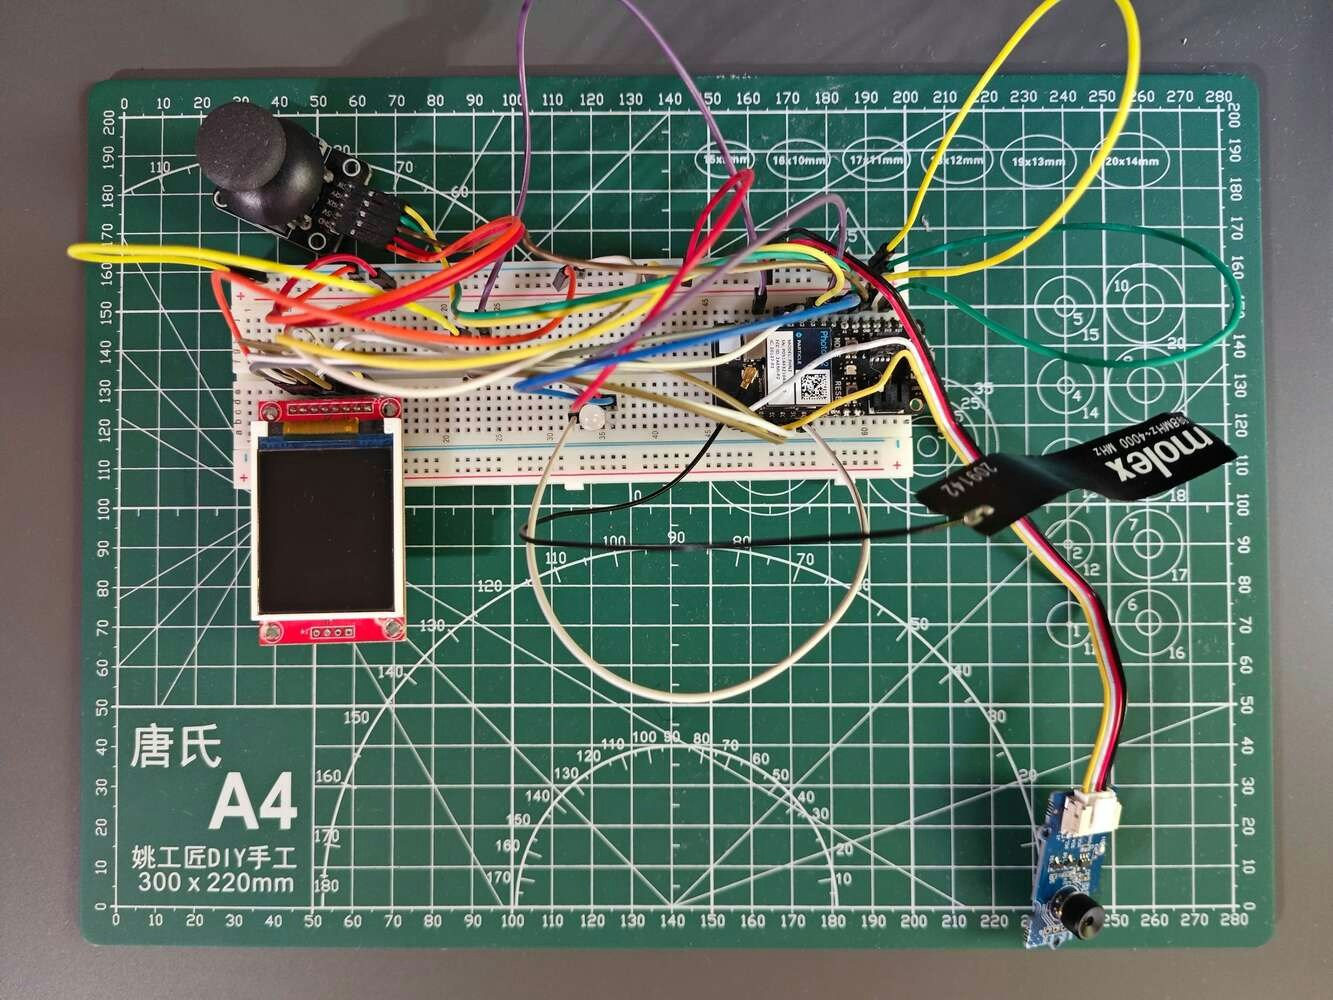
Before prototyping my Groudon-inspired PCB design, I inspected the detailed pin reference of Particle Photon 2 and needed to prepare components requiring soldering for programming. Then, I checked the wireless (Wi-Fi) and cloud communication quality between Photon 2, the Particle Cloud, and the web dashboard (application) while transferring and receiving data packets.
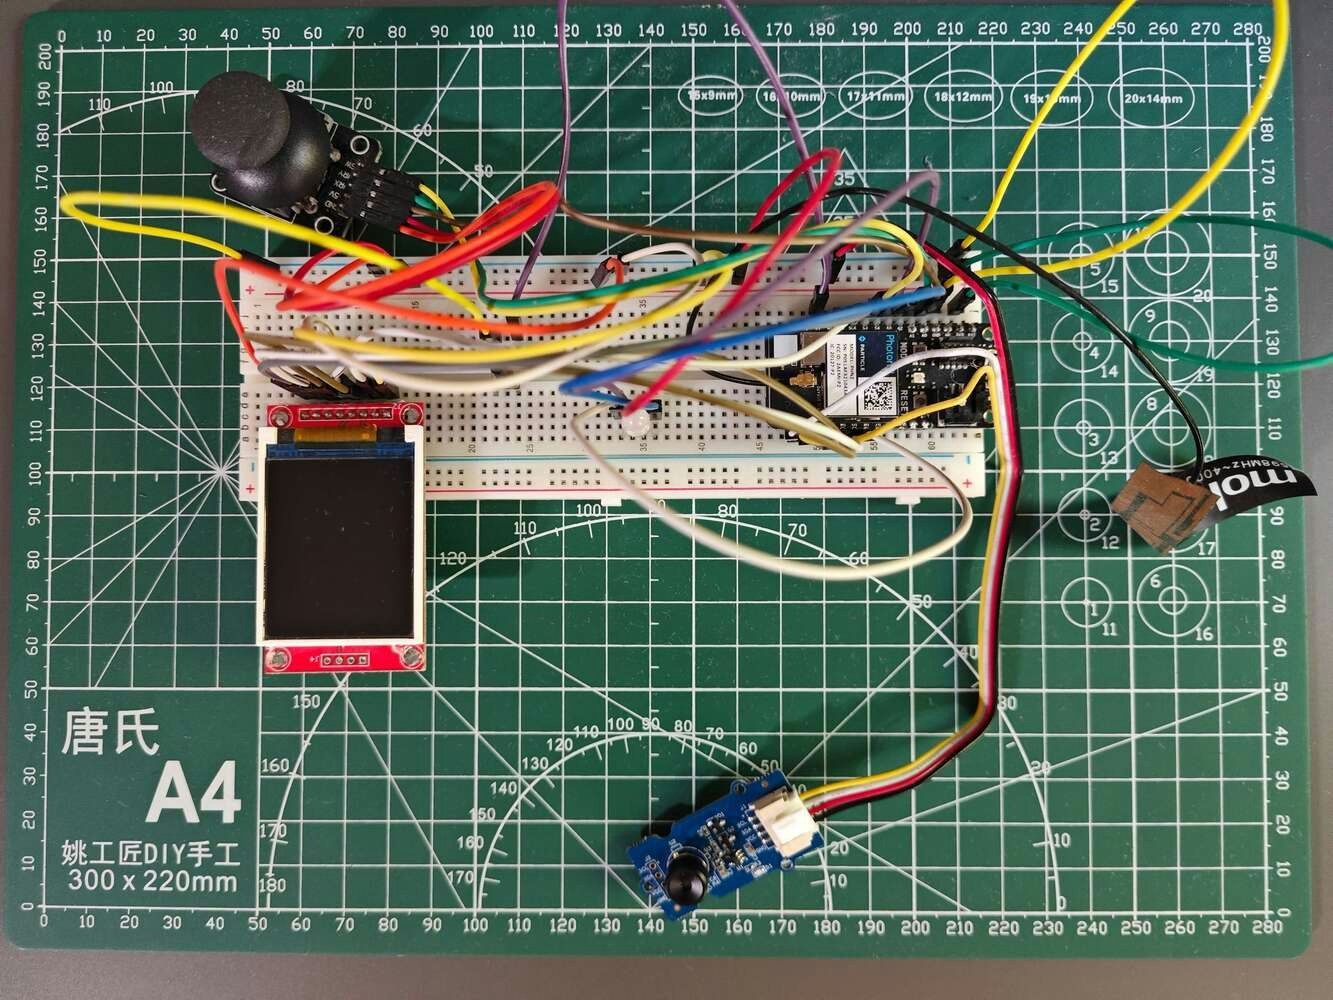
Breadboard prototype of Particle Photon 2 with MLX90641 thermal camera wiring

73


Photon 2 prototype connected to the TFT display and analog joystick for thermal controls

74

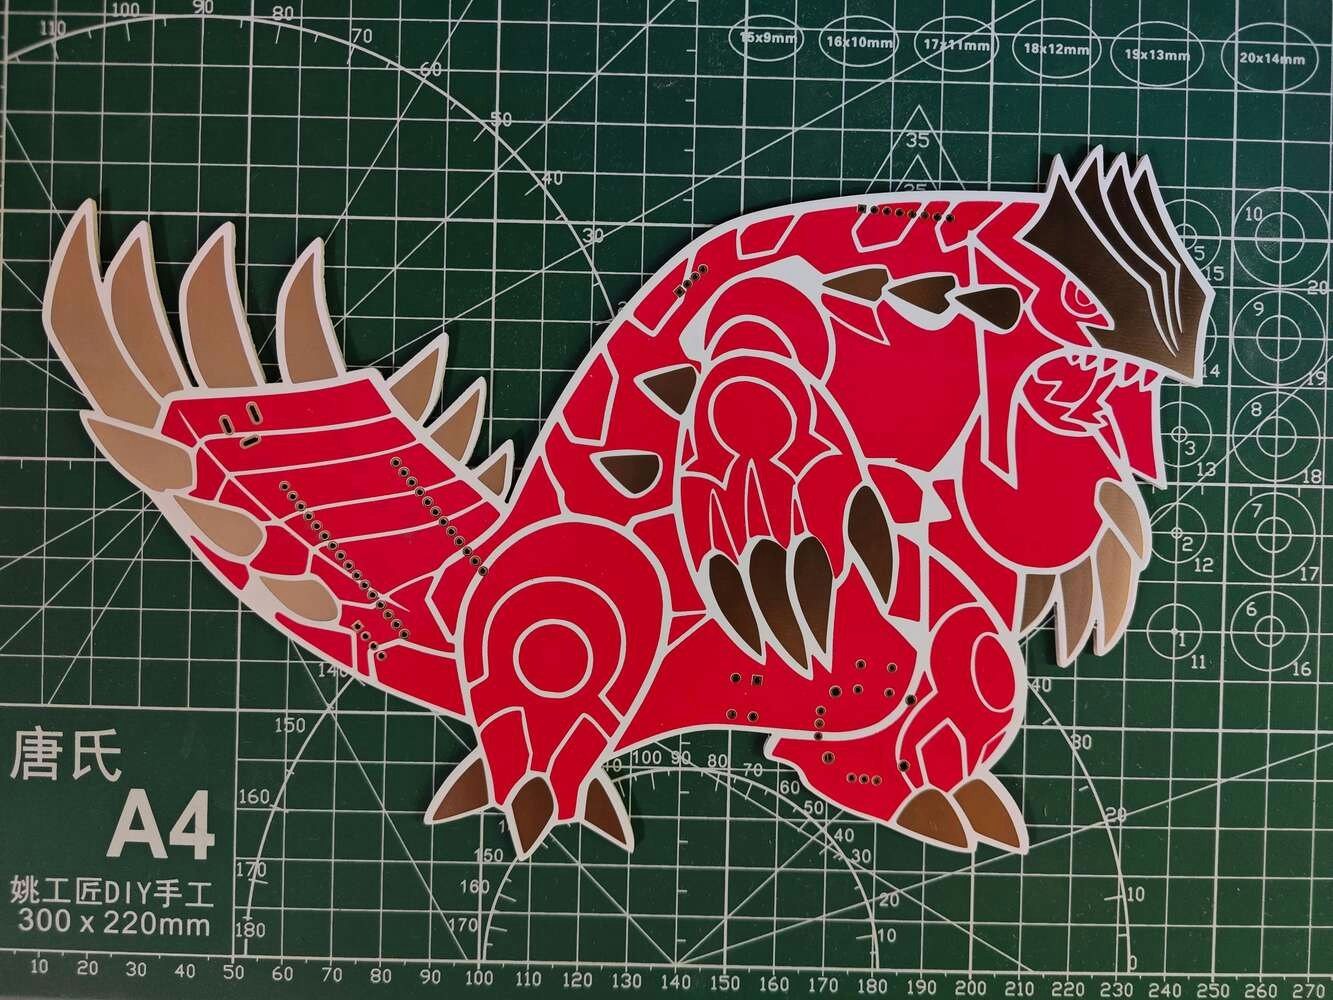
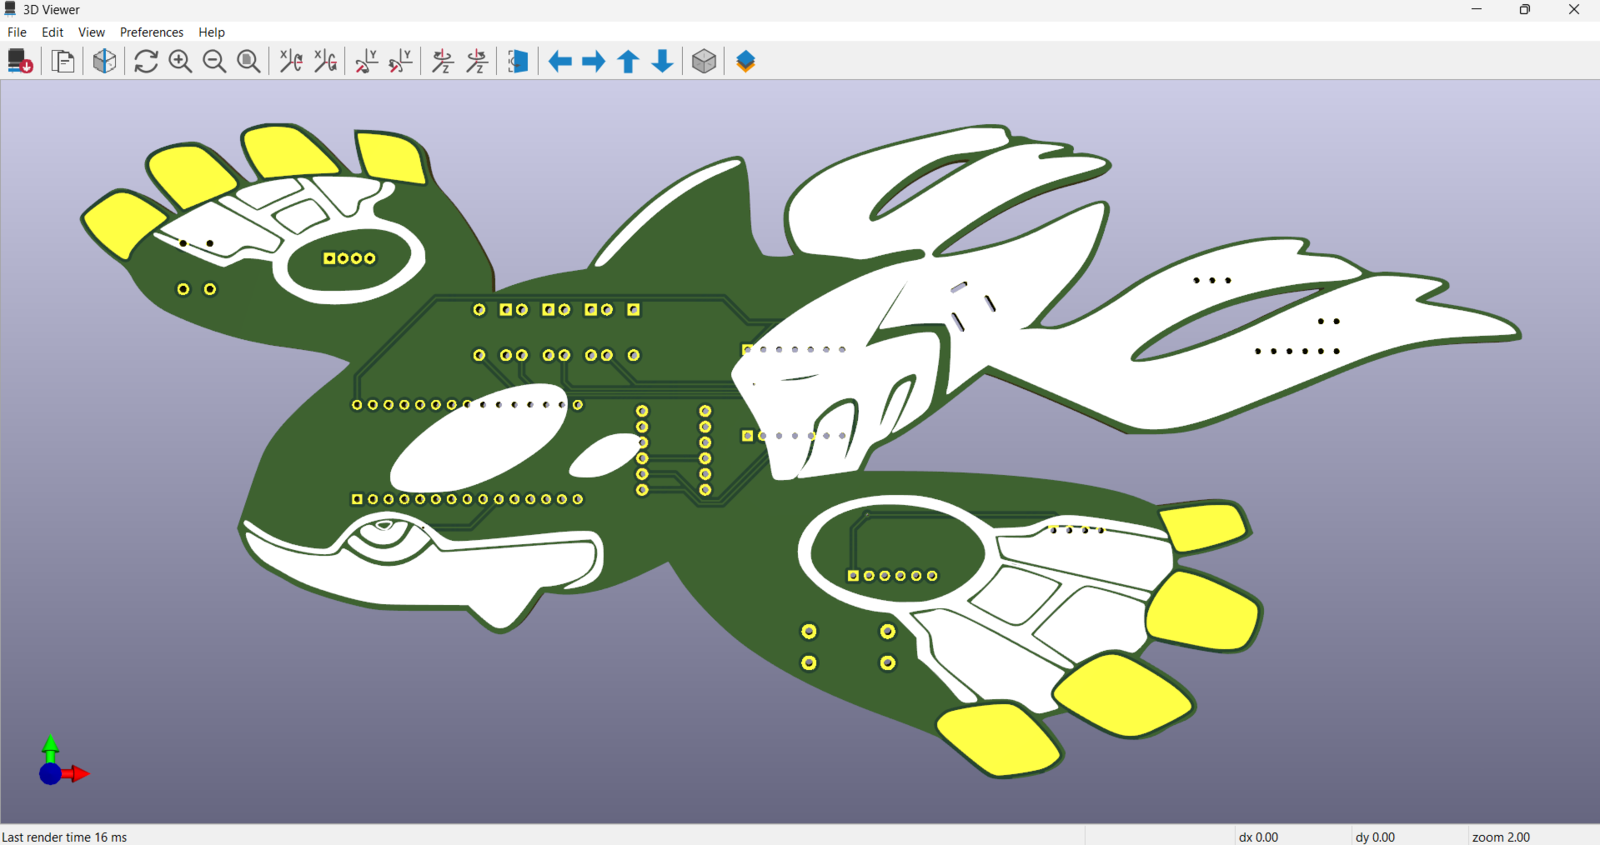
I designed my Groudon-inspired PCB by utilizing Autodesk Fusion 360 and KiCad in tandem. Since I wanted to design a unique 3D-printed encasement to simplify the PCB integration to the custom CNC router (also 3D-printed) moving the thermal camera container head, I created the PCB outline (edge) on Fusion 360 and then imported the outline file (DXF) to KiCad. In this regard, I was able to design custom 3D parts compatible with the PCB outline precisely. To replicate this malfunction detection device for water-cooled HVAC systems, you can download the Gerber file below or order the discussed PCB design directly from my ELECROW community page.
KiCad layout view of the Groudon-shaped thermal and cloud PCB

75


Rendered Groudon PCB showing Photon 2 and thermal camera component placement

76


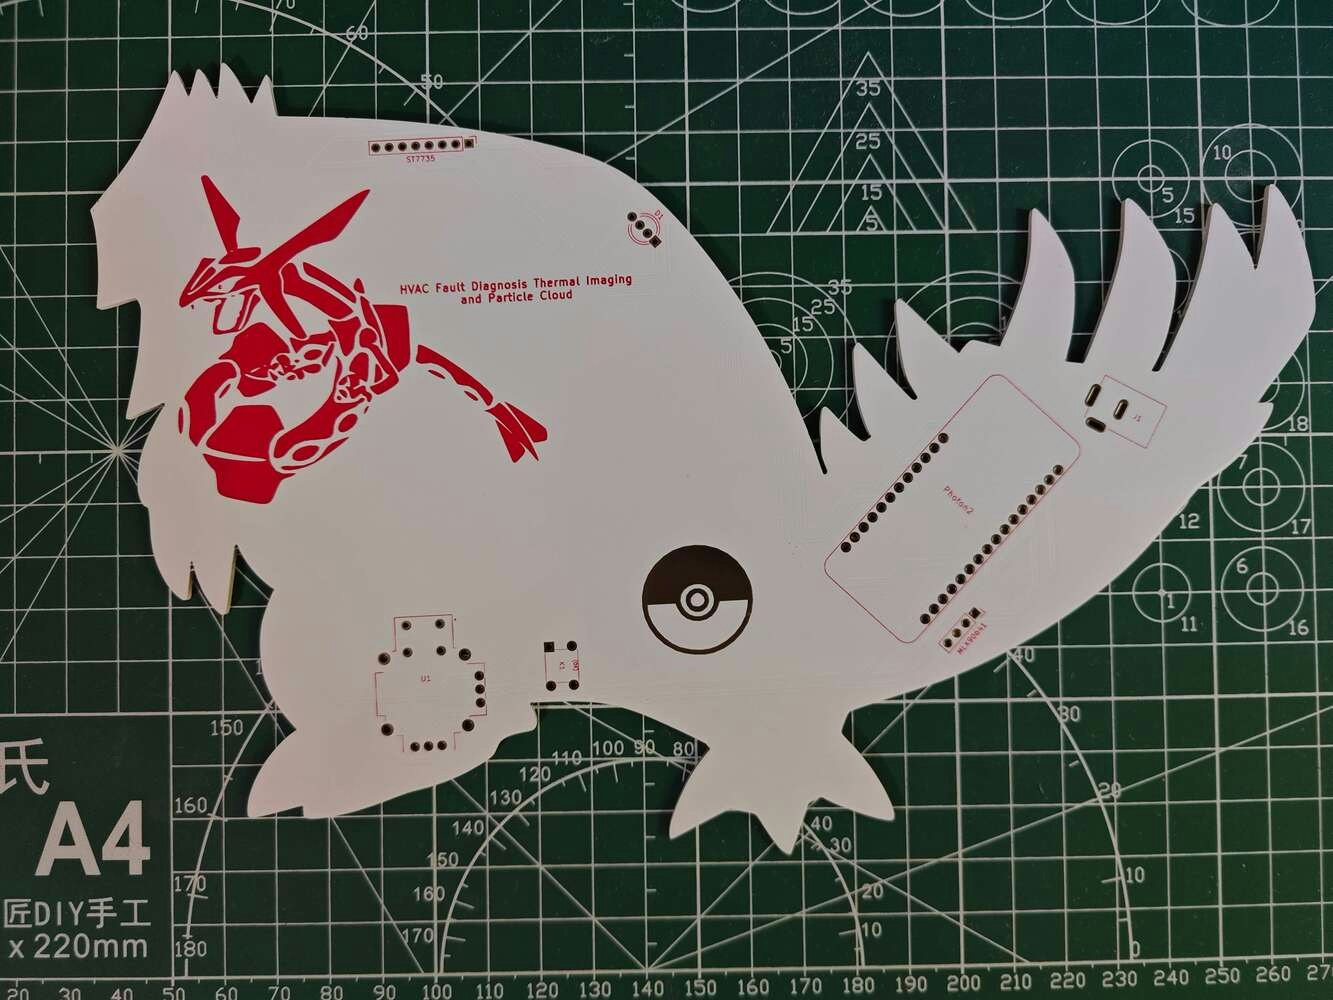
Manufactured Groudon PCB with red solder mask and white silkscreen

77

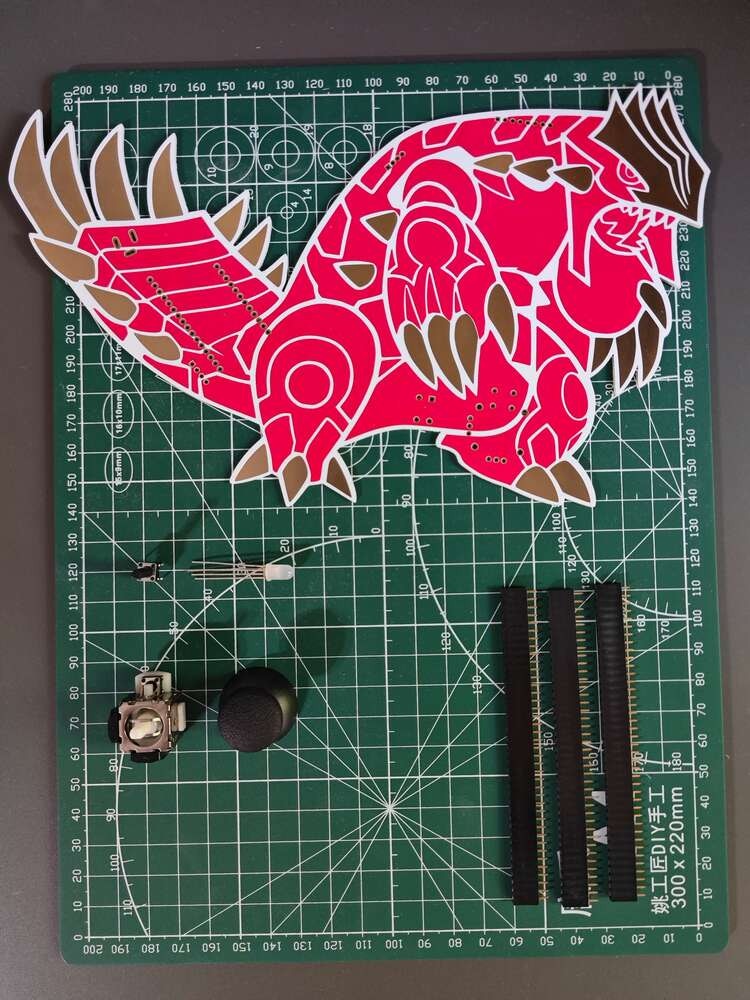
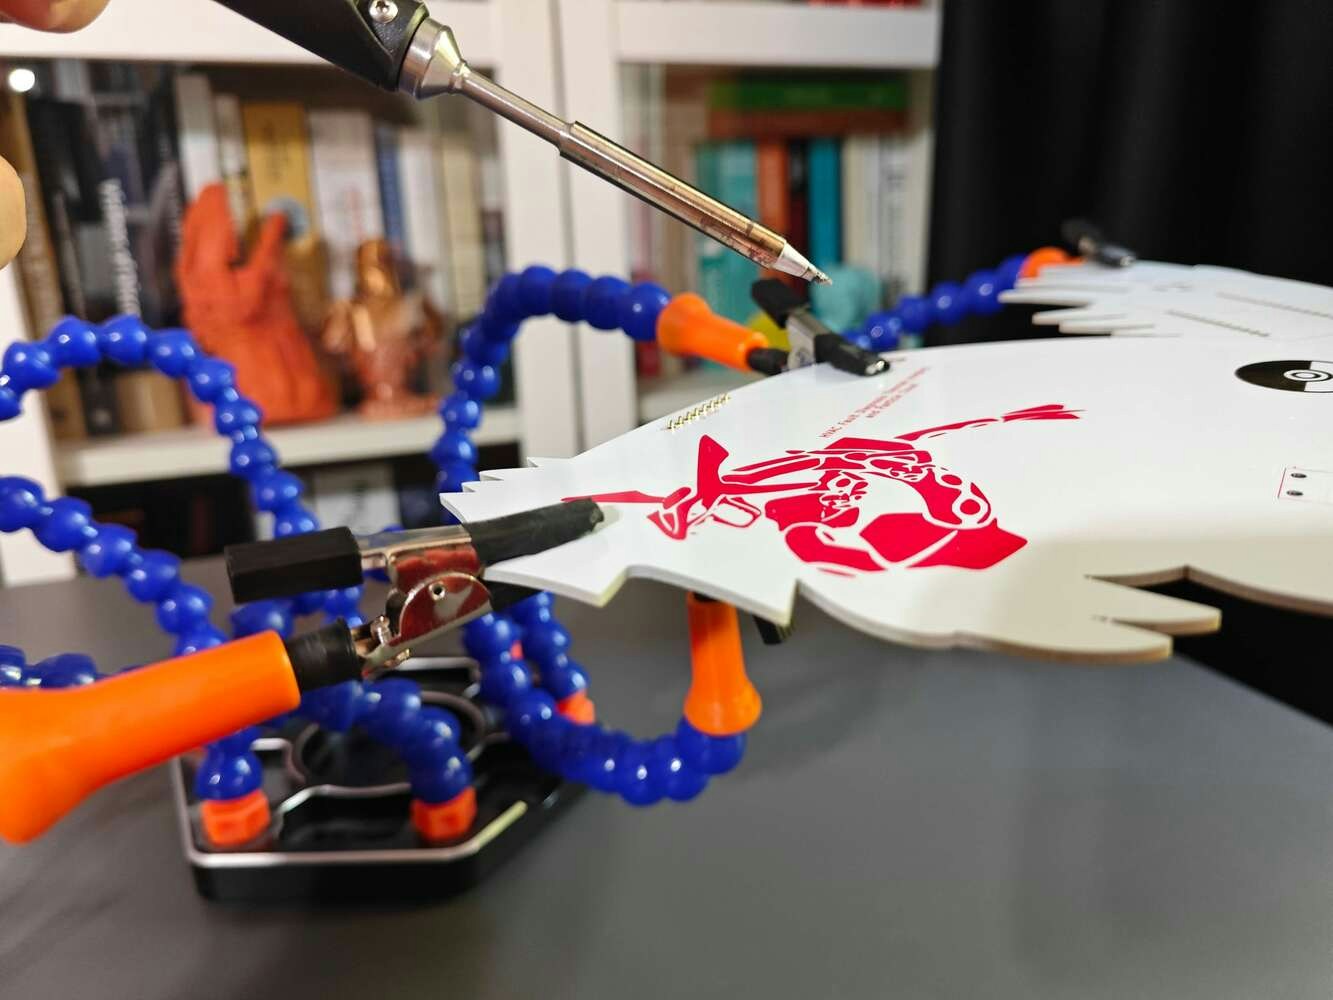
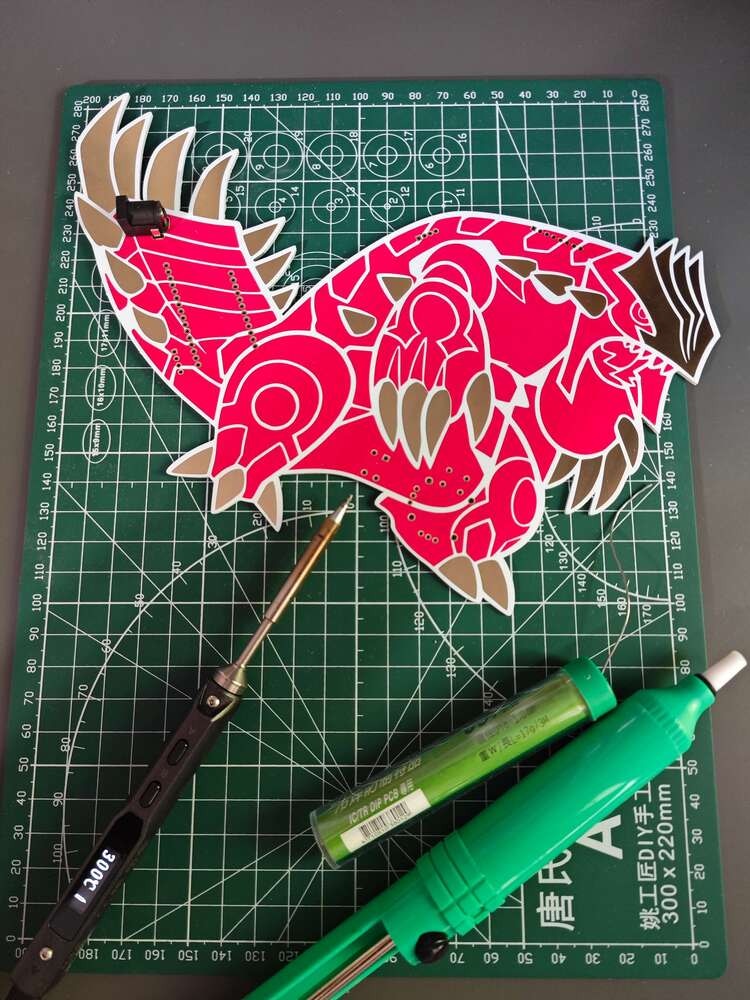
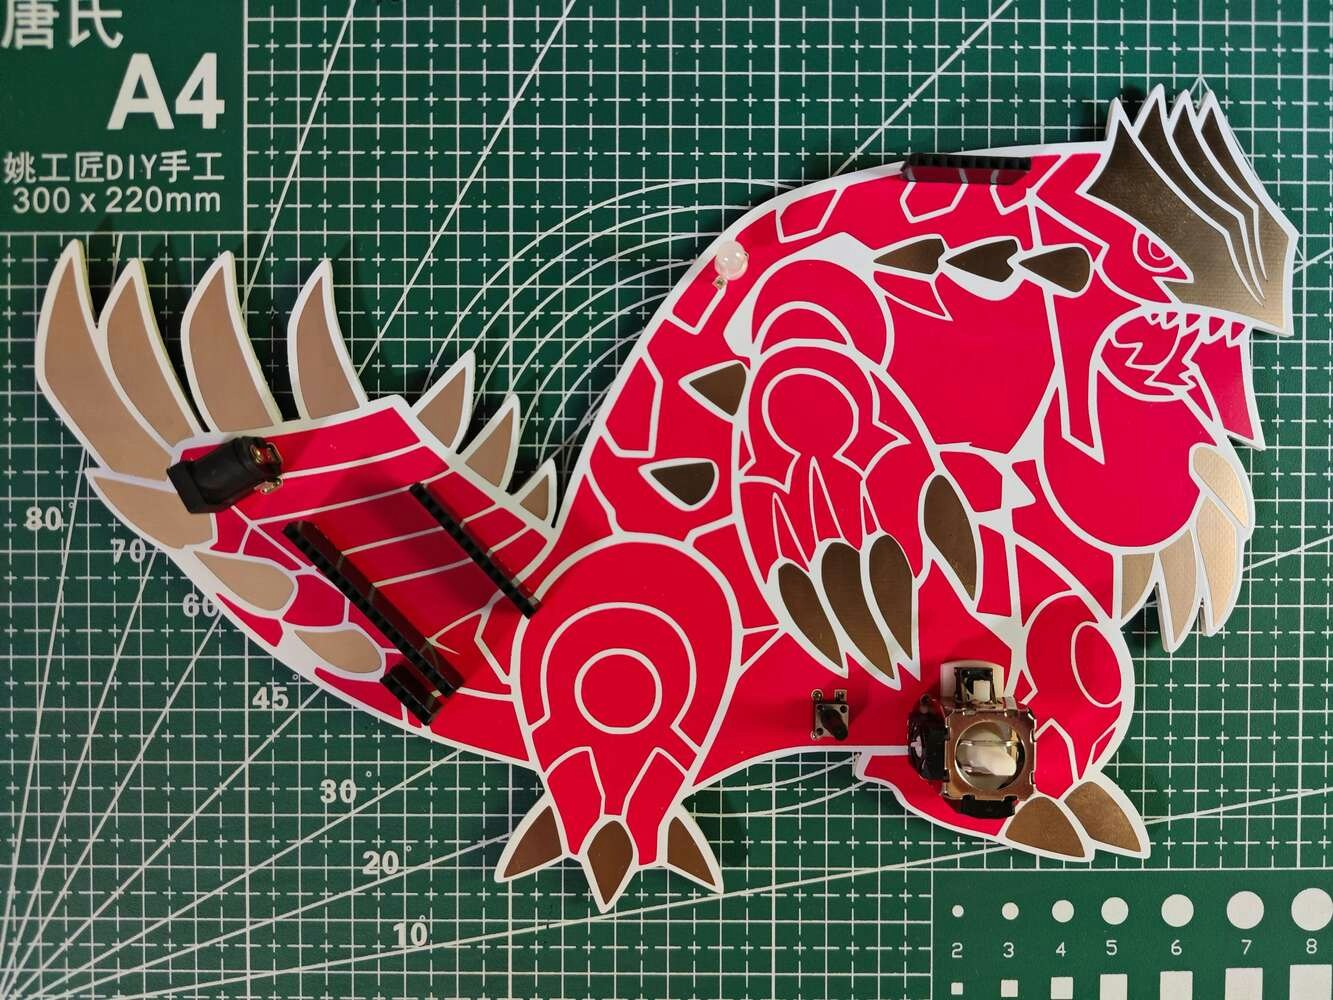
By utilizing a TS100 soldering iron, I attached the component list depicted below. 📌 Component list of the Groudon PCB: Photon2 (Headers for Particle Photon 2) MLX90641 (Headers for MLX90641 Thermal Imaging Camera) ST7735 (Headers for ST7735 1.8” TFT Display) U1 (COM-09032 Analog Joystick) K1 (6x6 Pushbutton) D1 (5 mm Common Anode RGB LED) J1 (Power Jack) Since some components were tricky to solder due to the unique structure of the Groudon PCB, I utilized the soldering station to hold the problematic parts.
Soldered Groudon PCB with Photon 2 headers and TFT connector installed

78


Groudon PCB close-up showing the analog joystick and thermal camera port

79


Groudon PCB with wiring attached for the TFT display and MLX90641 camera

80

After concluding soldering all components, I tested whether the Groudon PCB operated as expected or was susceptible to electrical issues.
Completed Groudon PCB mounted in its pink printed CNC enclosure

81

Step 1.b.1: Making connections and adjustments on the Groudon PCB
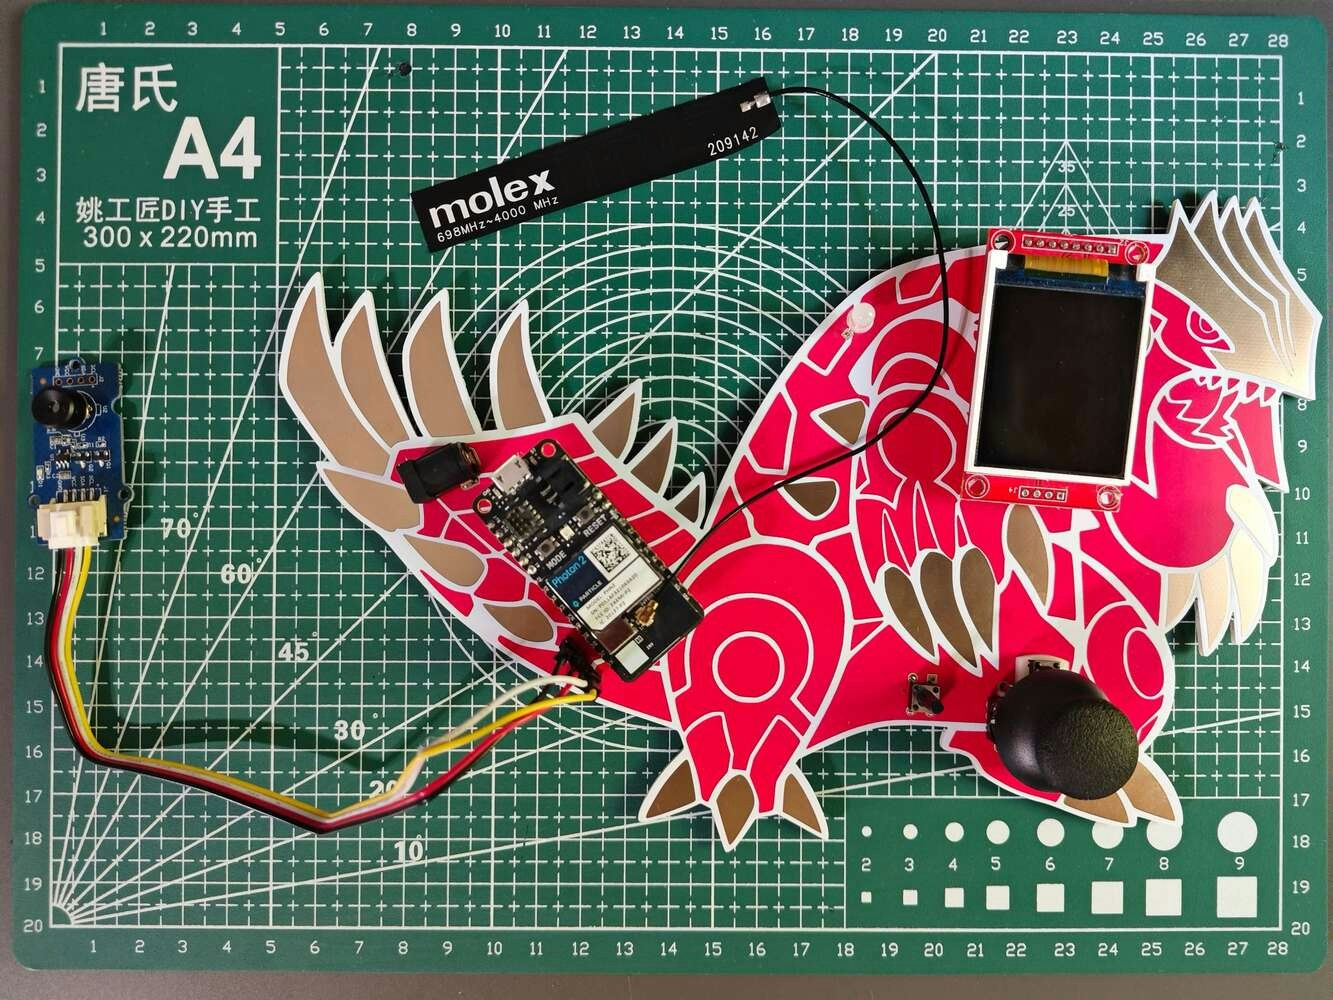
:hash: Since Particle Photon 2 is a capable IoT development board providing Particle Cloud compatibility out of the box, I was able to set up cloud variables and functions effortlessly to communicate with Photon 2 via the Particle Cloud API through the web dashboard. :hash: To obtain accurate thermal scan (imaging) buffers, I connected an MLX90641 thermal imaging camera to Photon 2 via a Grove 4-pin connection cable. Since the MLX90641 camera produces 16x12 IR arrays (buffers) with fully calibrated 110° FOV (field-of-view), I was able to generate considerably large thermal images by combining four sequential buffers and adjusting pixel size. :hash: Although Photon 2 is a powerful development board, it is not suitable for generating thermal images, saving image samples, and running a demanding visual anomaly detection model simultaneously due to memory limitations. Therefore, the web dashboard, hosted by LattePanda Mu, handles all of the mentioned operations after Photon 2 registers the produced thermal scan (imaging) buffers to the associated Particle Cloud variables. :hash: To provide the user with a feature-rich interface, I connected an ST7735 TFT display and a COM-09032 analog joystick to Photon 2. I also added an RGB LED to inform the user of the device status while performing operations related to thermal buffer collection and registration.
Groudon PCB connection diagram for Photon 2, TFT display, joystick, and thermal camera

82

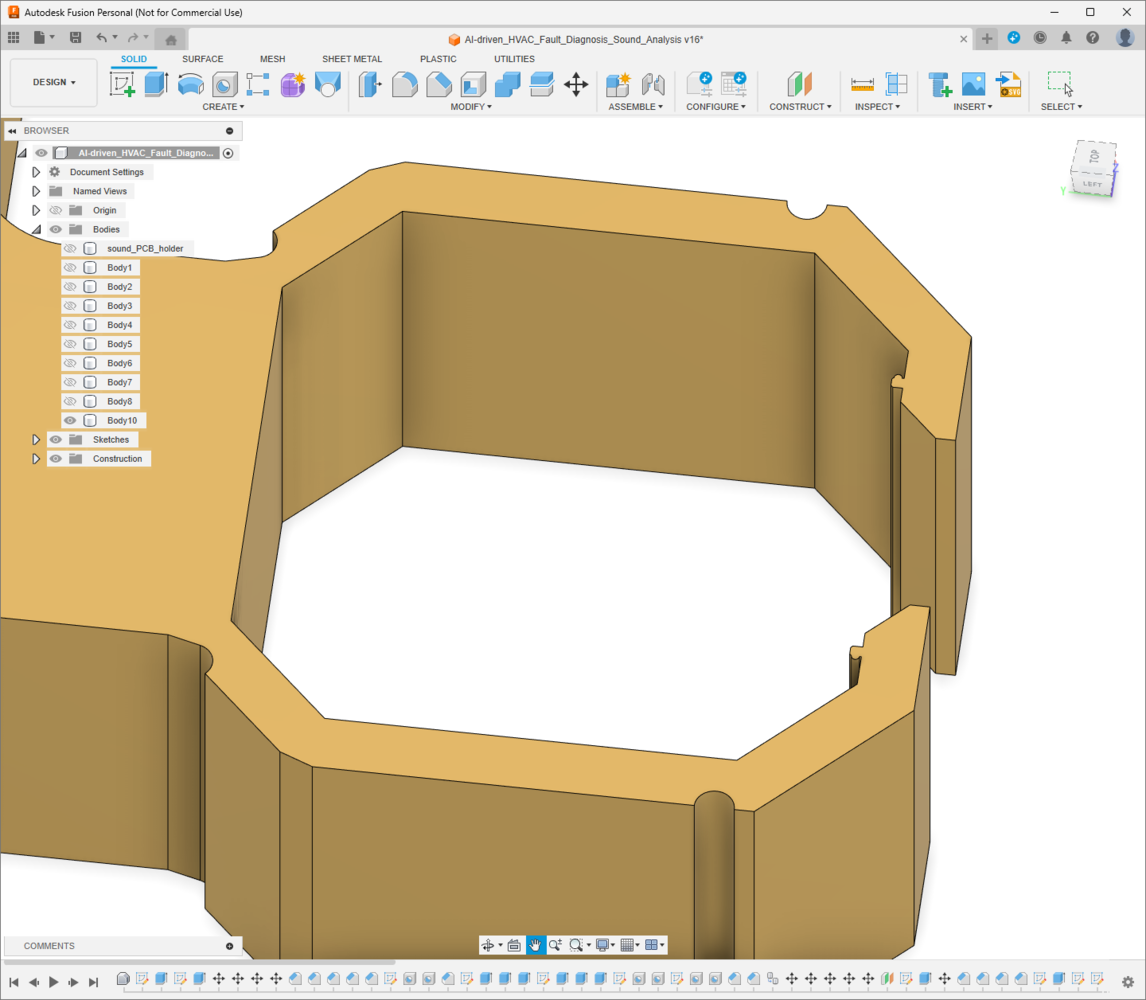
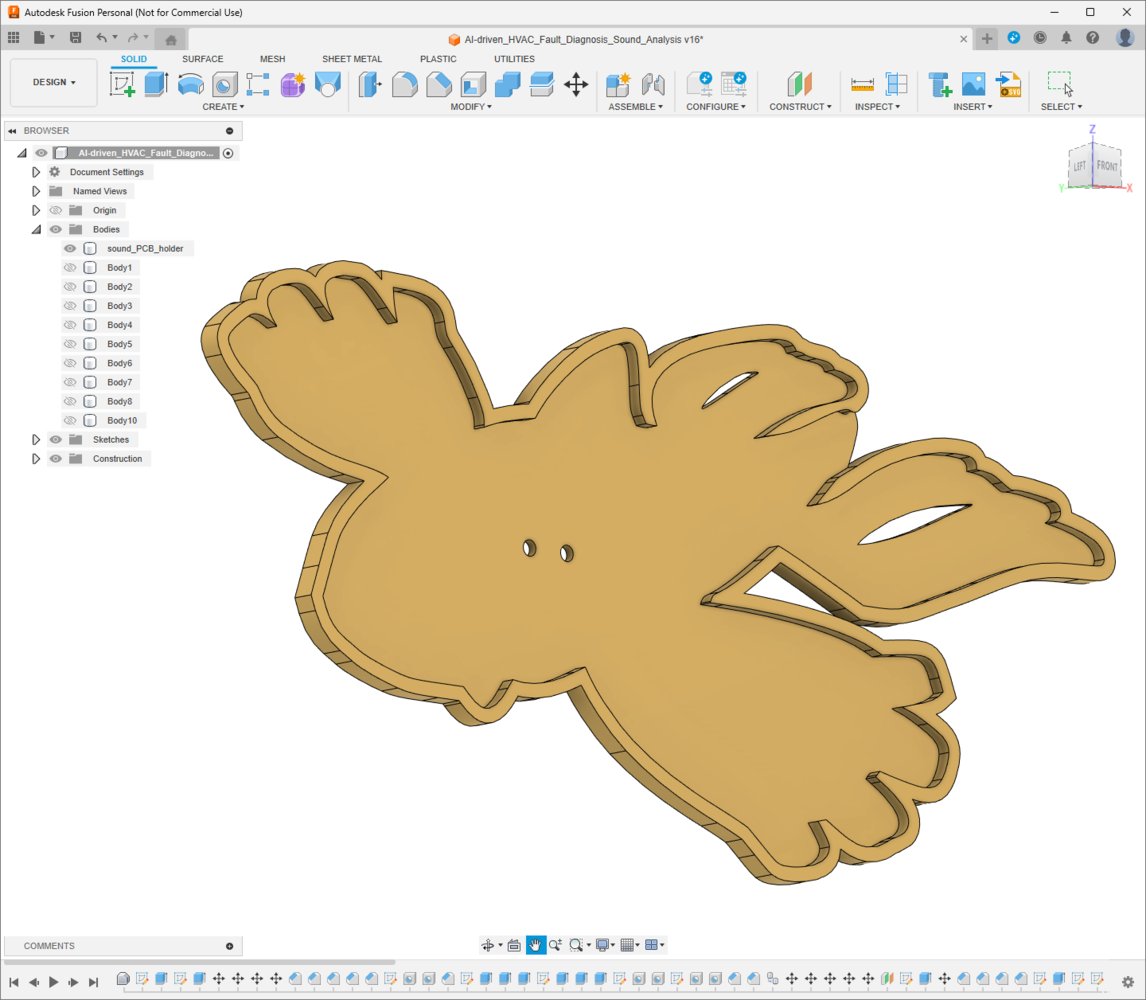
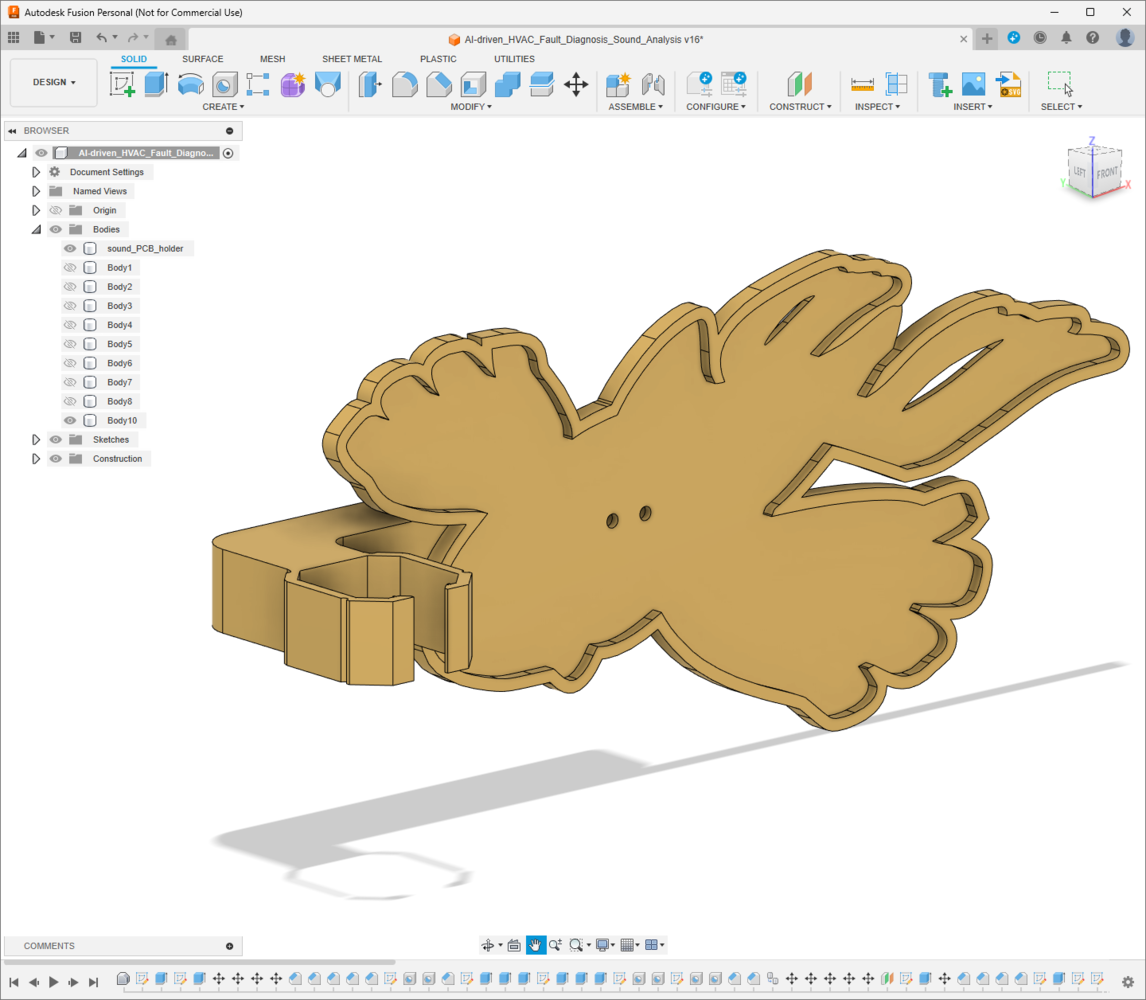
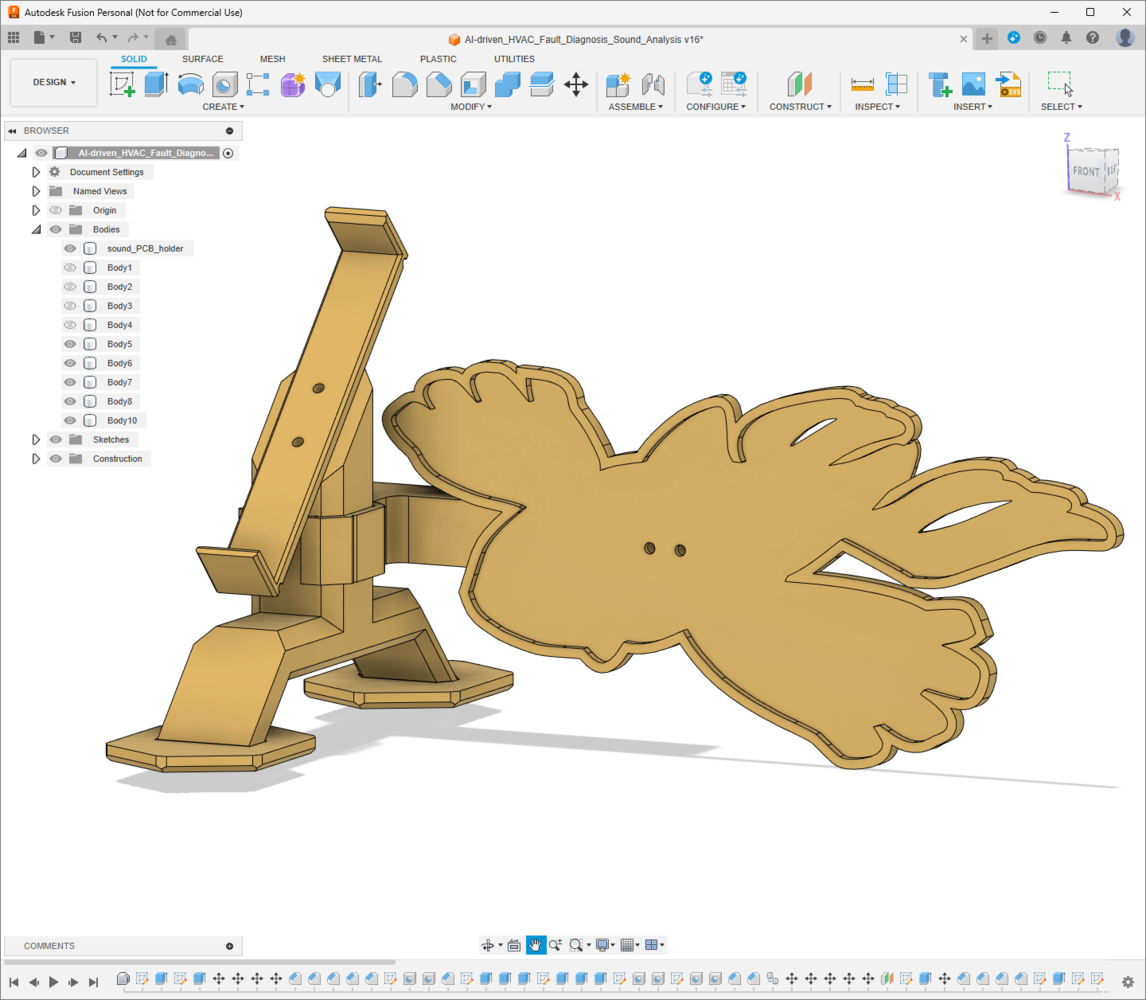
Step 2.a: Designing and printing the aluminum radiator mounts and the Kyogre PCB encasement

Since I focused on building a versatile and accessible AI-driven device that identifies the faulty cooling components via anomalous sound detection and diagnoses ensuing thermal cooling malfunctions via visual anomaly detection based on thermal images, I decided to design complementary 3D-printable parts that improve the robustness, compatibility, and capabilities of the device considering harsh operating conditions of industrial plants. First, I wanted to fix the large aluminum radiator position and integrate the Kyogre PCB as close as possible to the radiator. Thus, I designed these parts:
  • the main body of the right radiator mount,
  • the main body of the left radiator mount,
  • two tilted snap-fit joints perfectly sized for the radiator,
  • four special legs (back and front) supporting the radiator mounts,
  • the unique PCB encasement derived from the Kyogre PCB outline,
  • the PCB encasement connector providing a buckle-shaped joint interlocking with the right radiator mount.
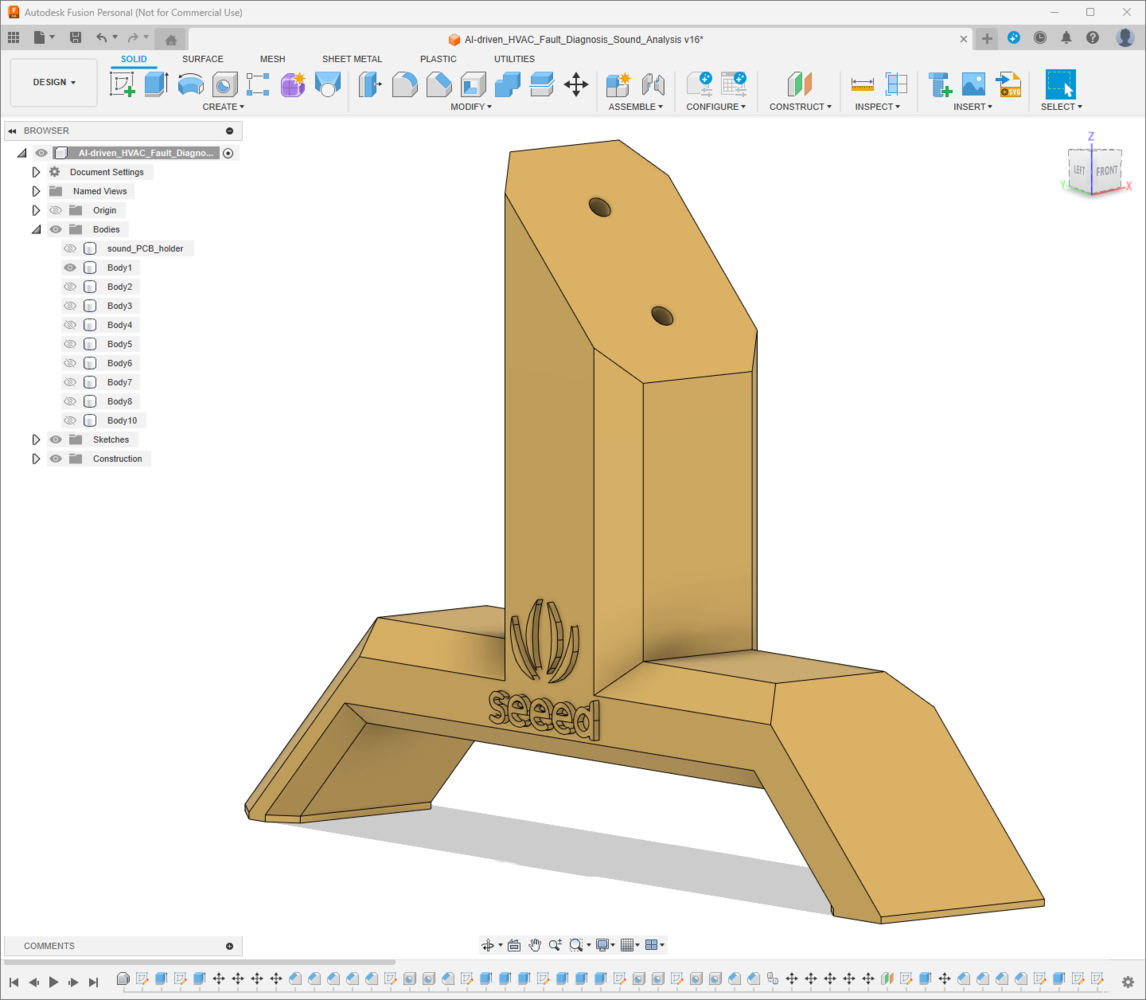
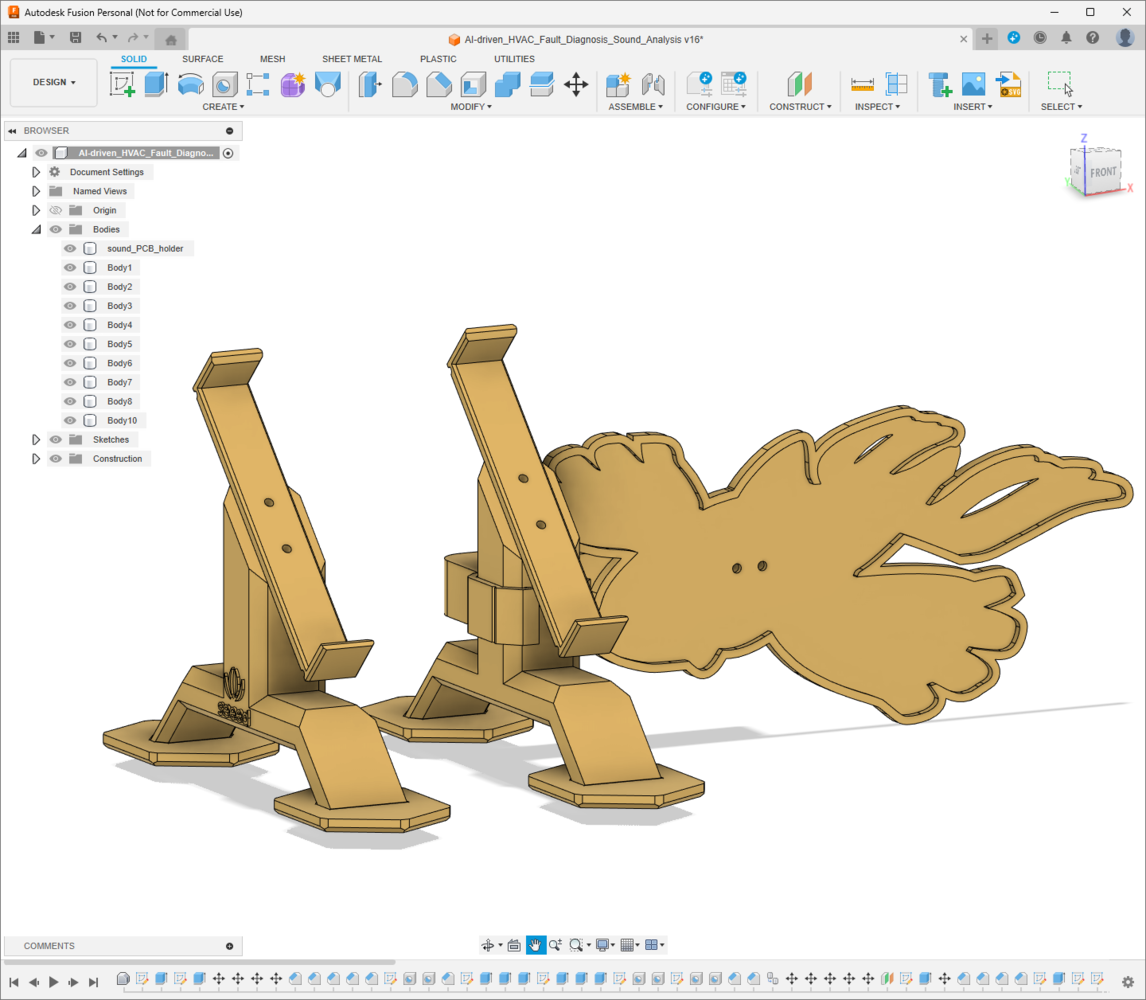
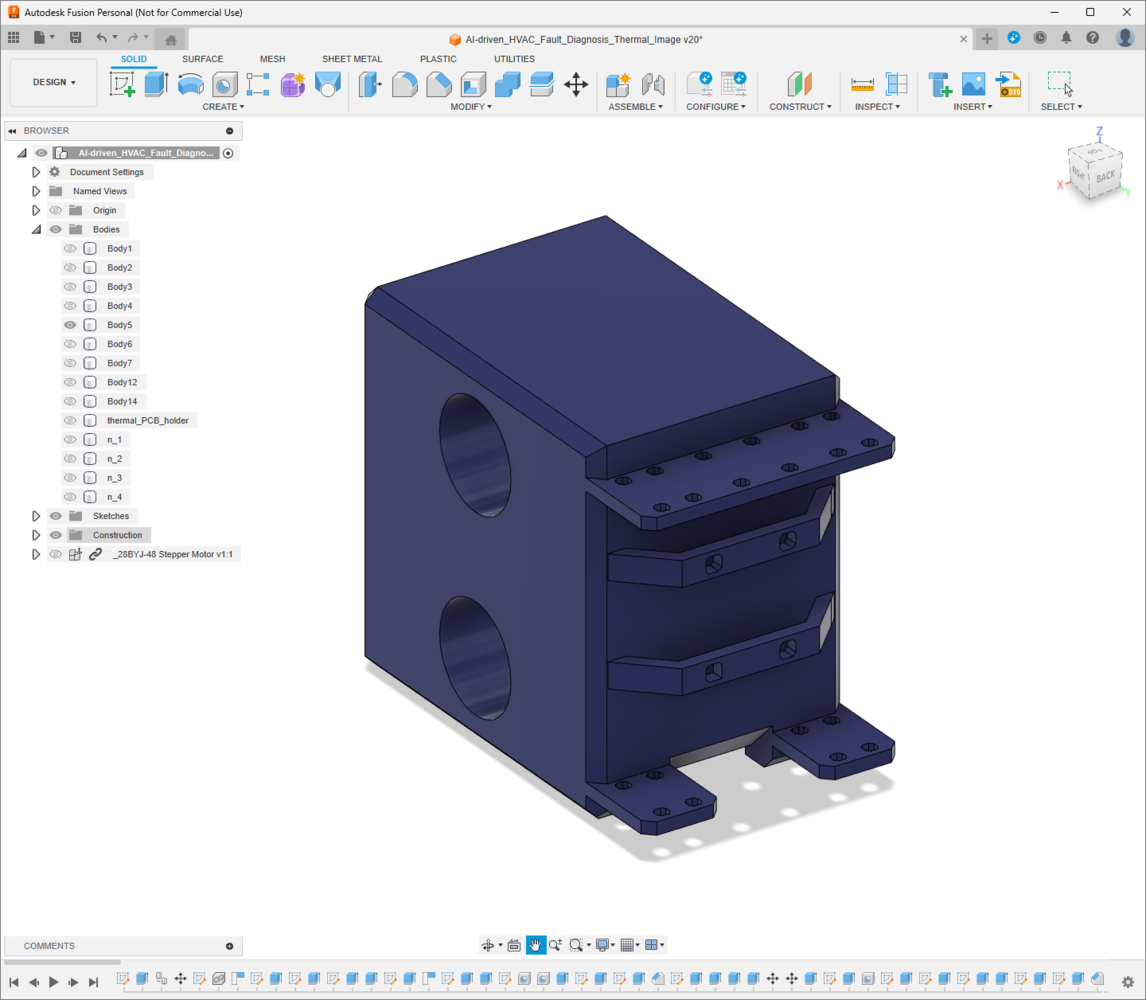
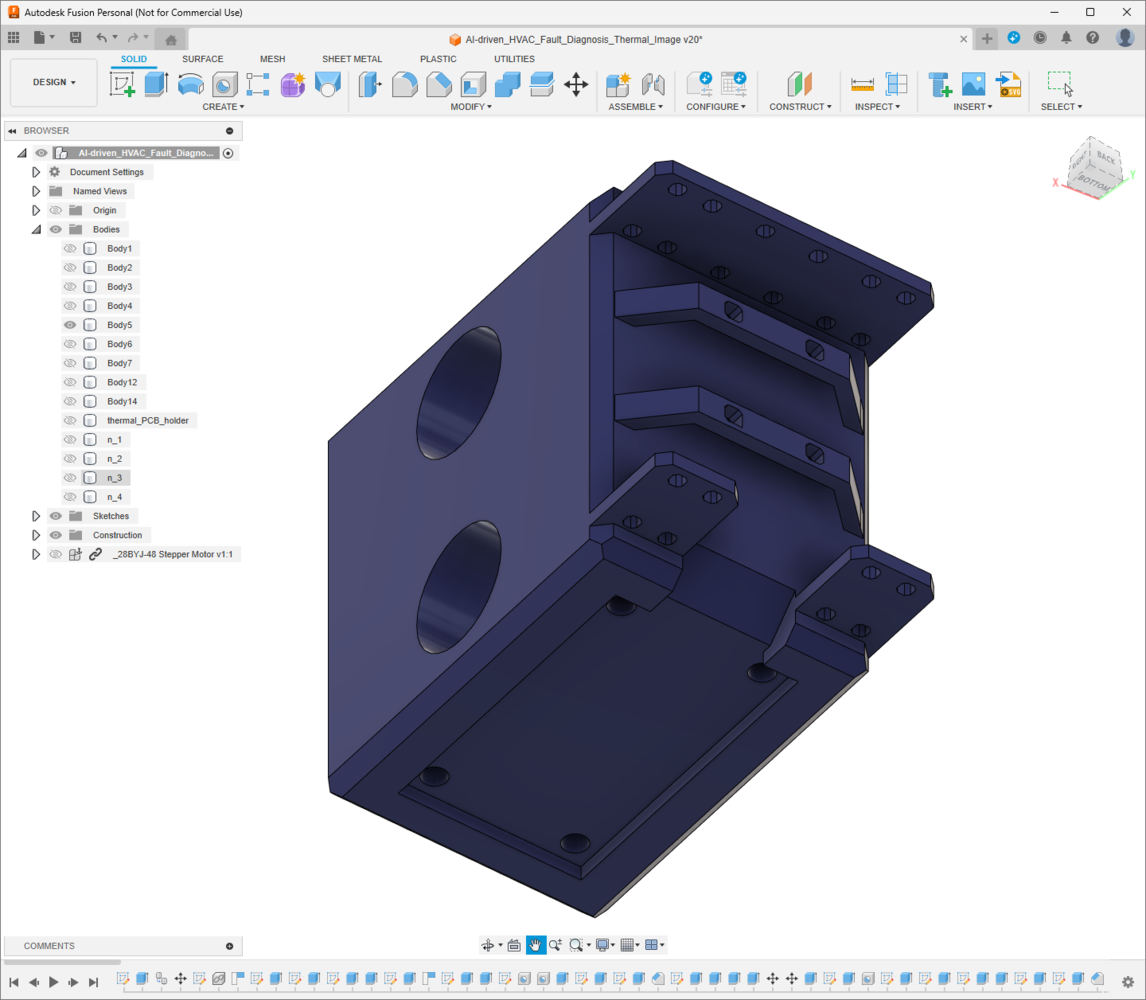
Furthermore, I decided to emboss the Seeed logo on the main body of the left radiator mount to highlight the qualifications of this segment of the AI-powered HVAC malfunction detection device. I utilized Autodesk Fusion 360 to model all of the mentioned 3D-printable parts and test their clearances to print flawless joints. For further examination, you can download their STL files below.
Fusion 360 angled view of the right radiator mount body with snap-fit slots

83


Fusion 360 top view of the left radiator mount body and support legs

84


Fusion 360 side view of the tilted snap-fit joint for the radiator frame

85


Fusion 360 close-up of the front radiator support leg

86


Fusion 360 fit-check view of the rear radiator support leg

87


Fusion 360 mounted view of the Kyogre PCB encasement outline

88


Fusion 360 rear view of the PCB connector with a buckle-shaped joint

89


Fusion 360 exploded view of the radiator mount assembly without electronics

90


Fusion 360 detail view of the radiator seated between both printed mounts

91


Fusion 360 front view of the side clearance around the aluminum radiator

92


Fusion 360 angled view of the Kyogre PCB case aligned to the right mount

93


Fusion 360 top view of the enclosure connector locked into the radiator stand

94

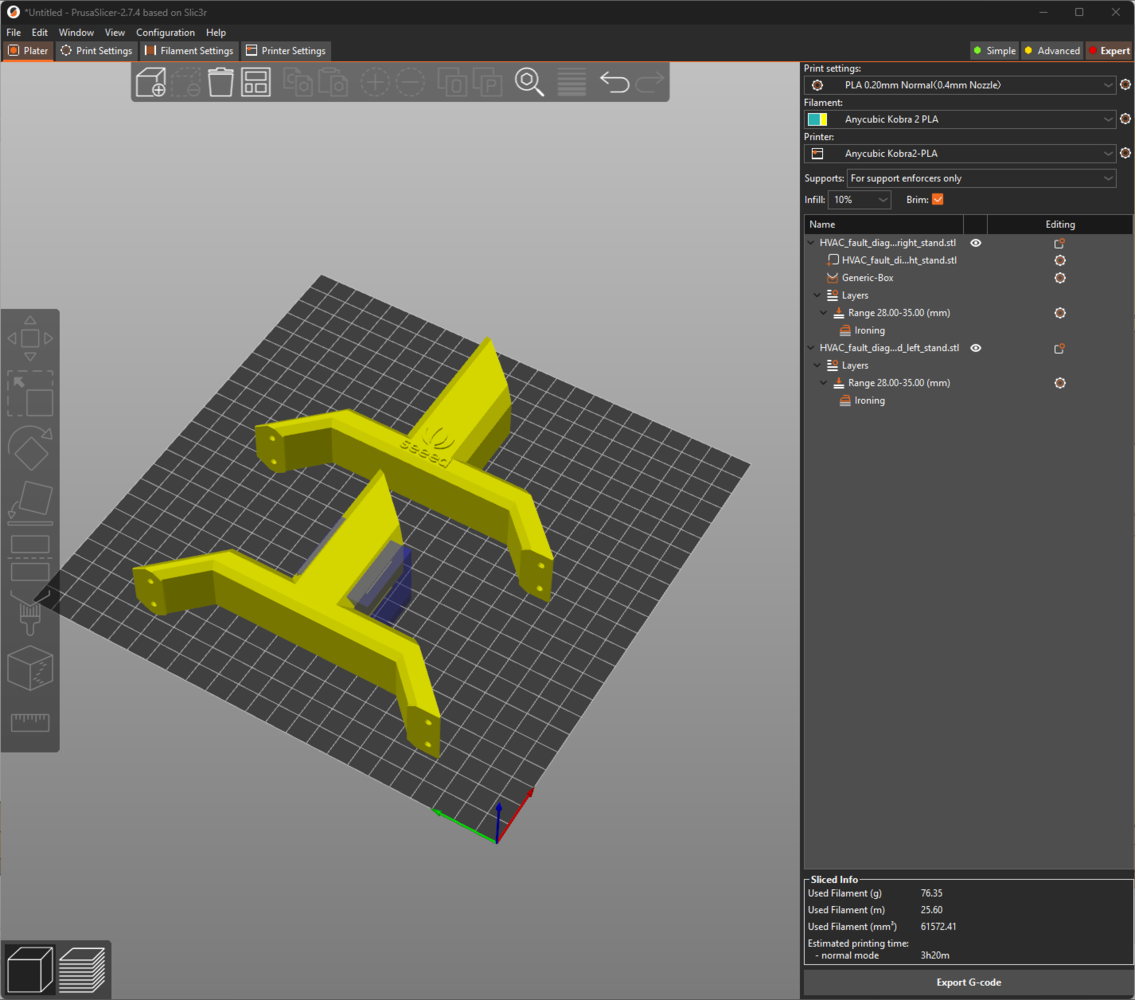
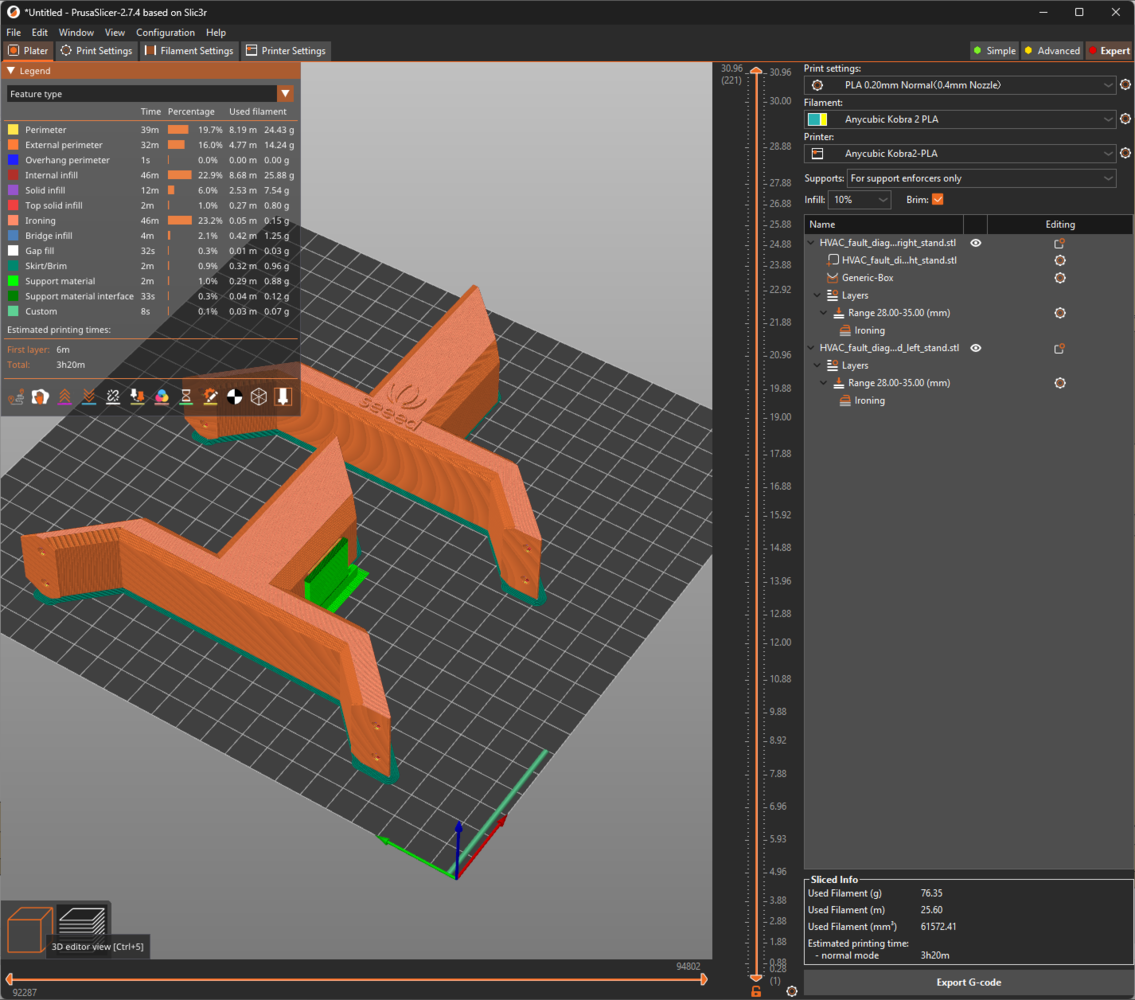
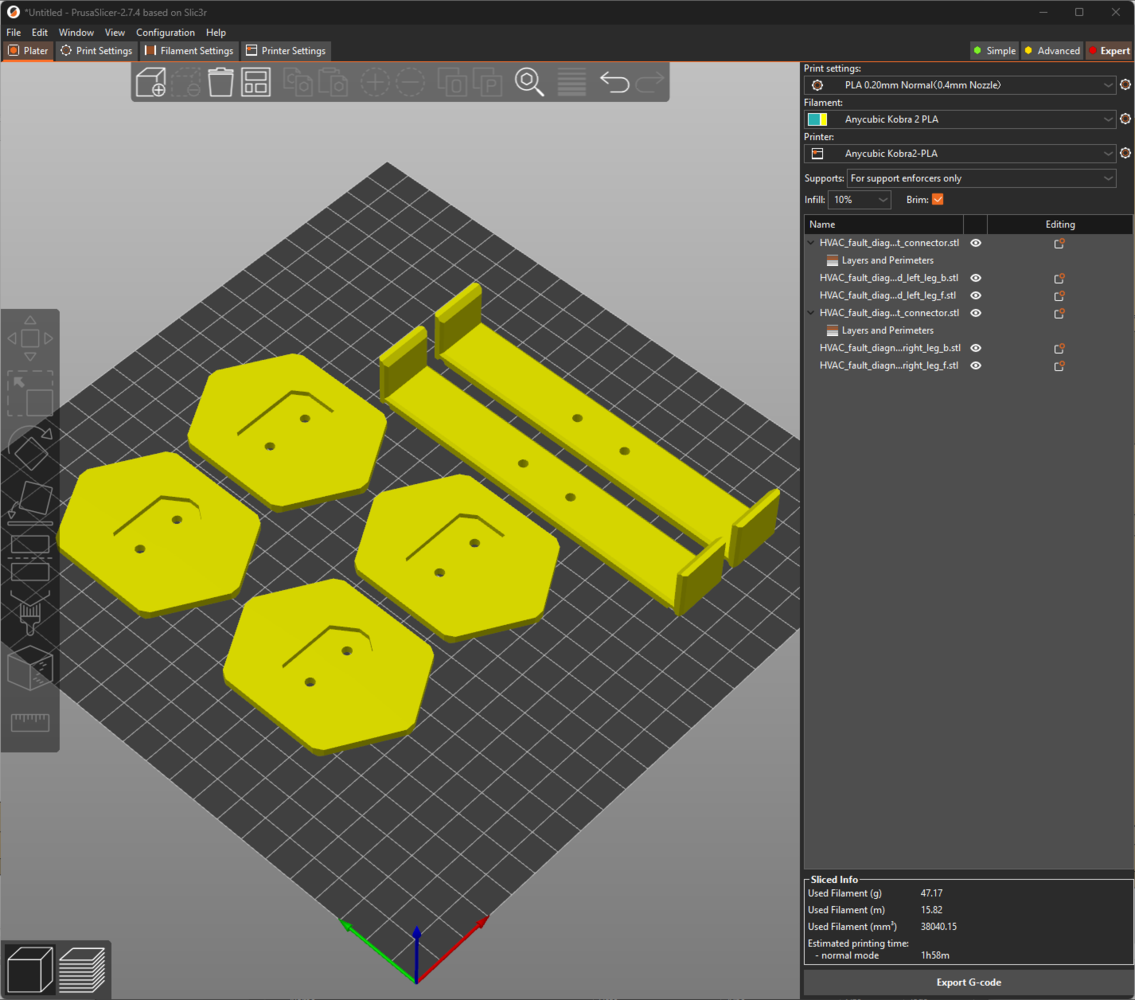
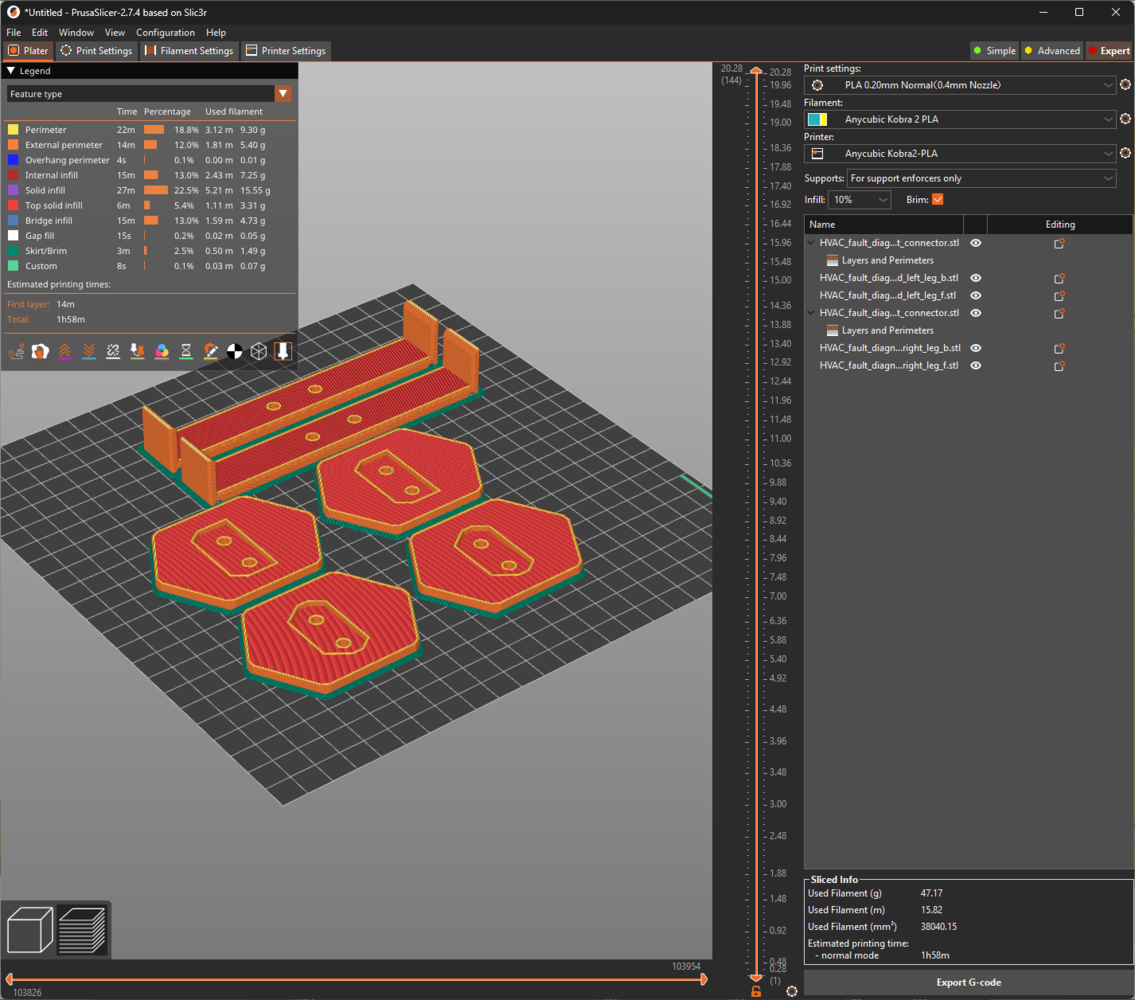
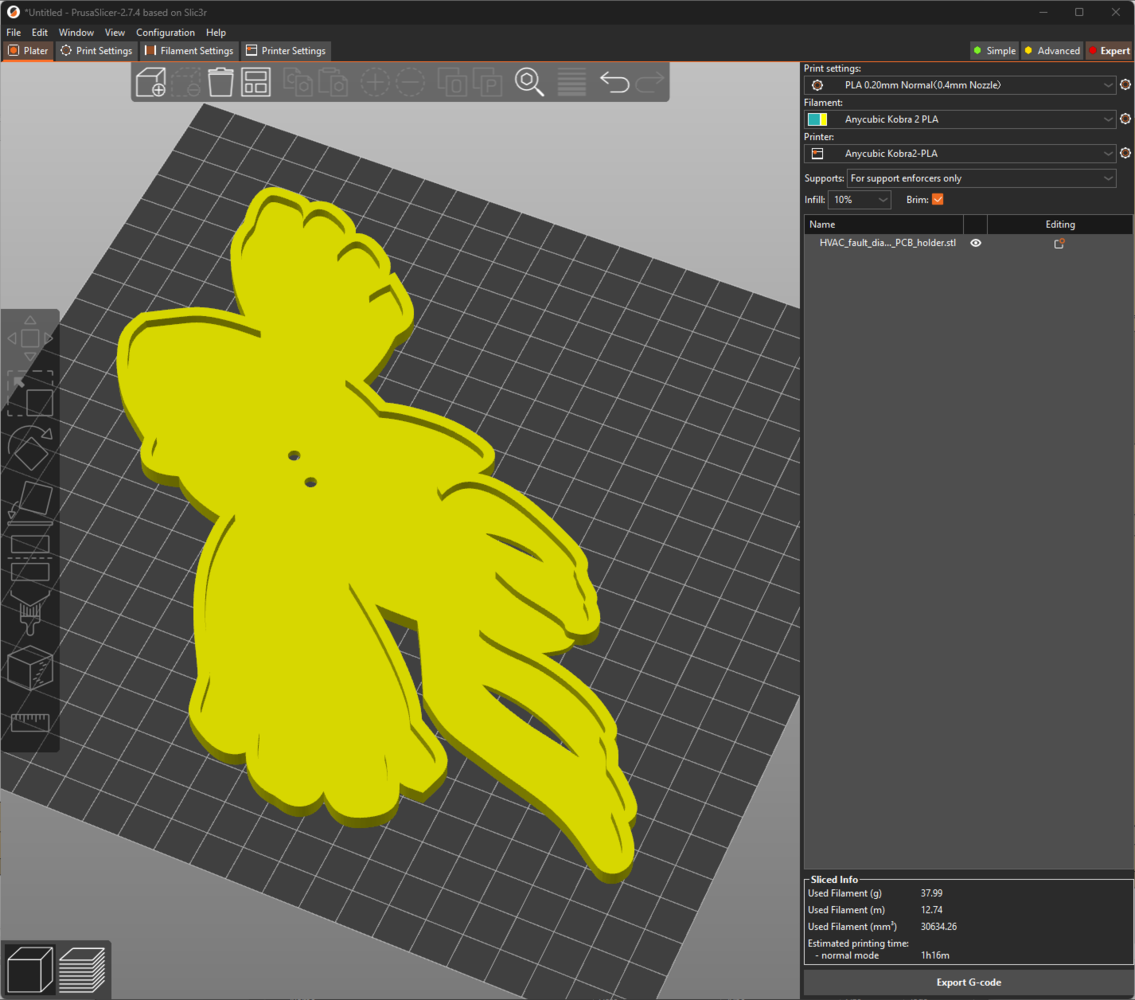
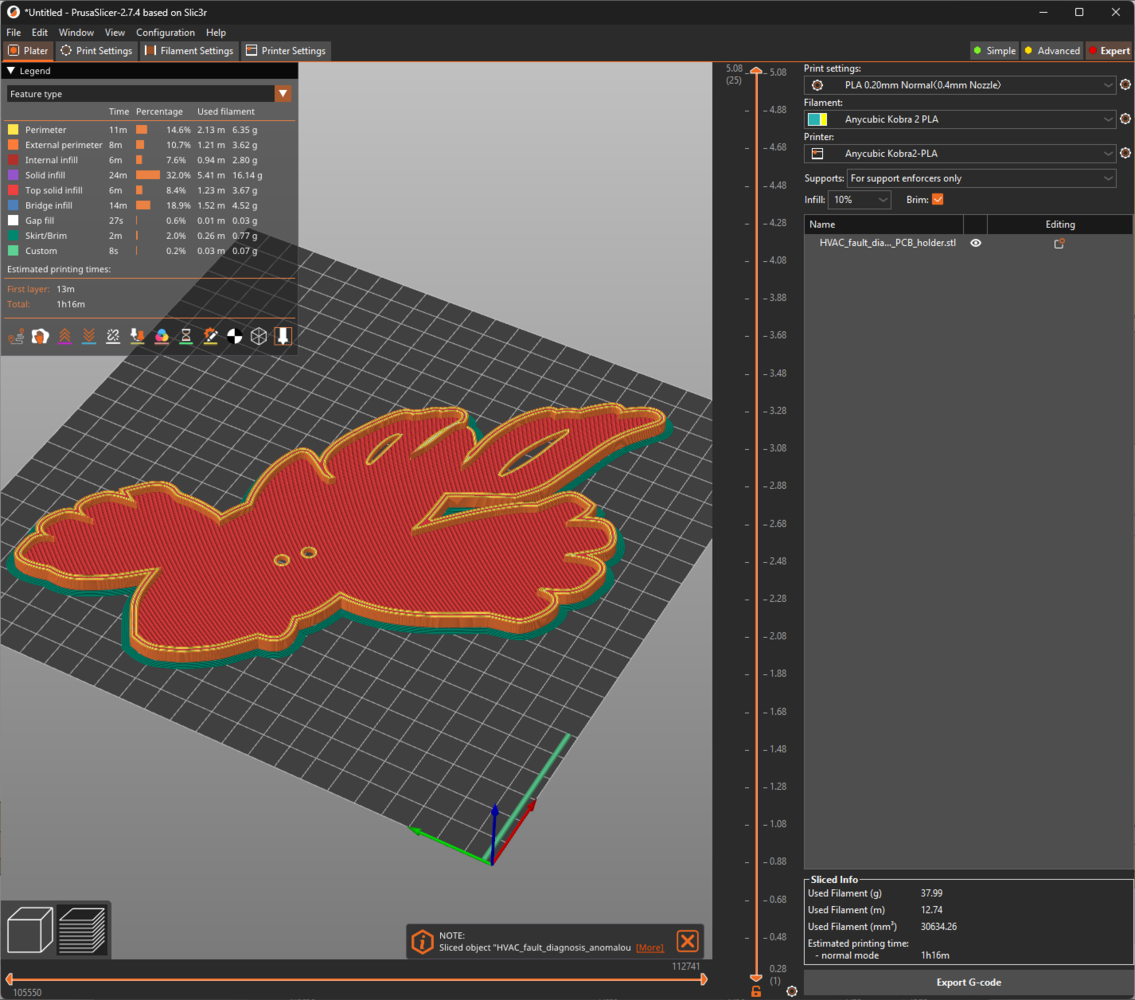
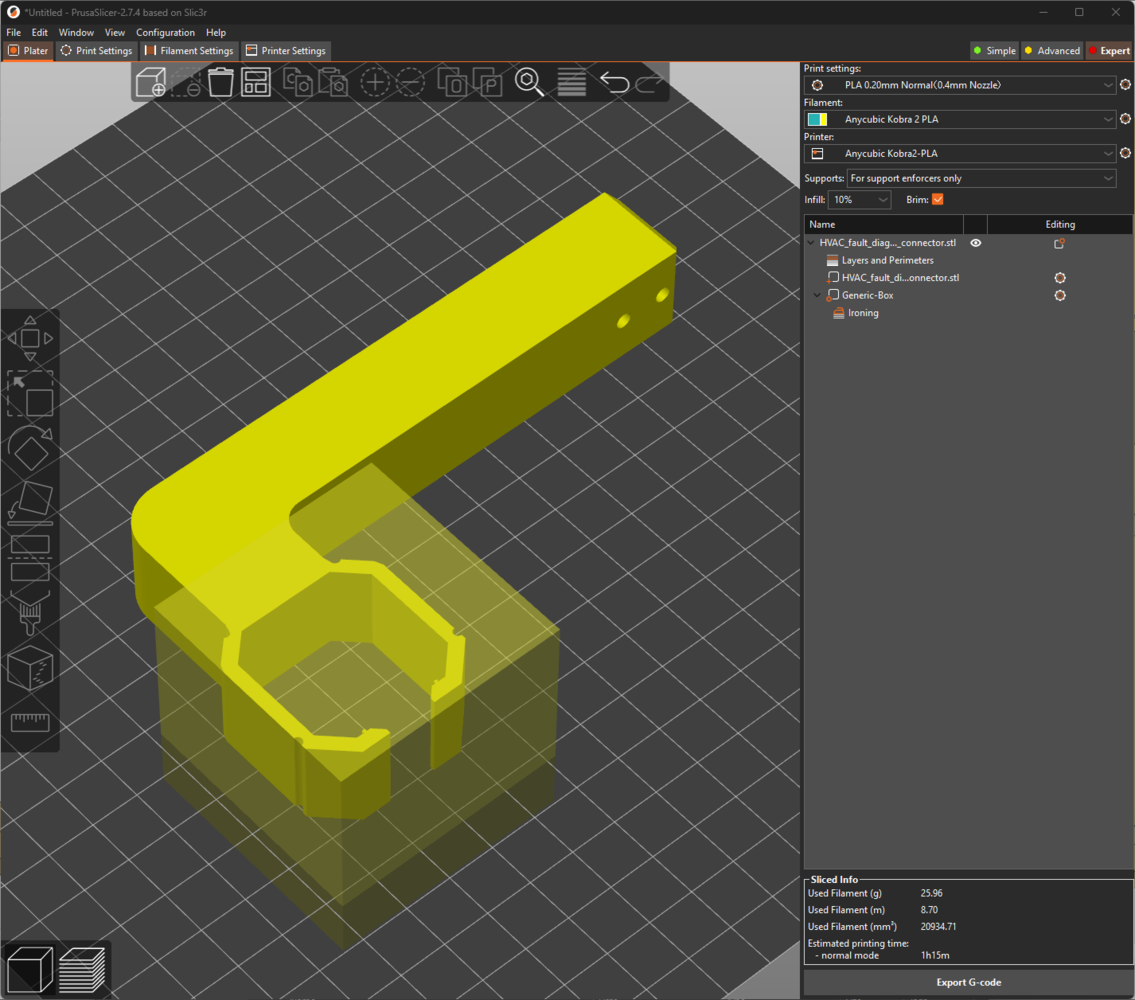
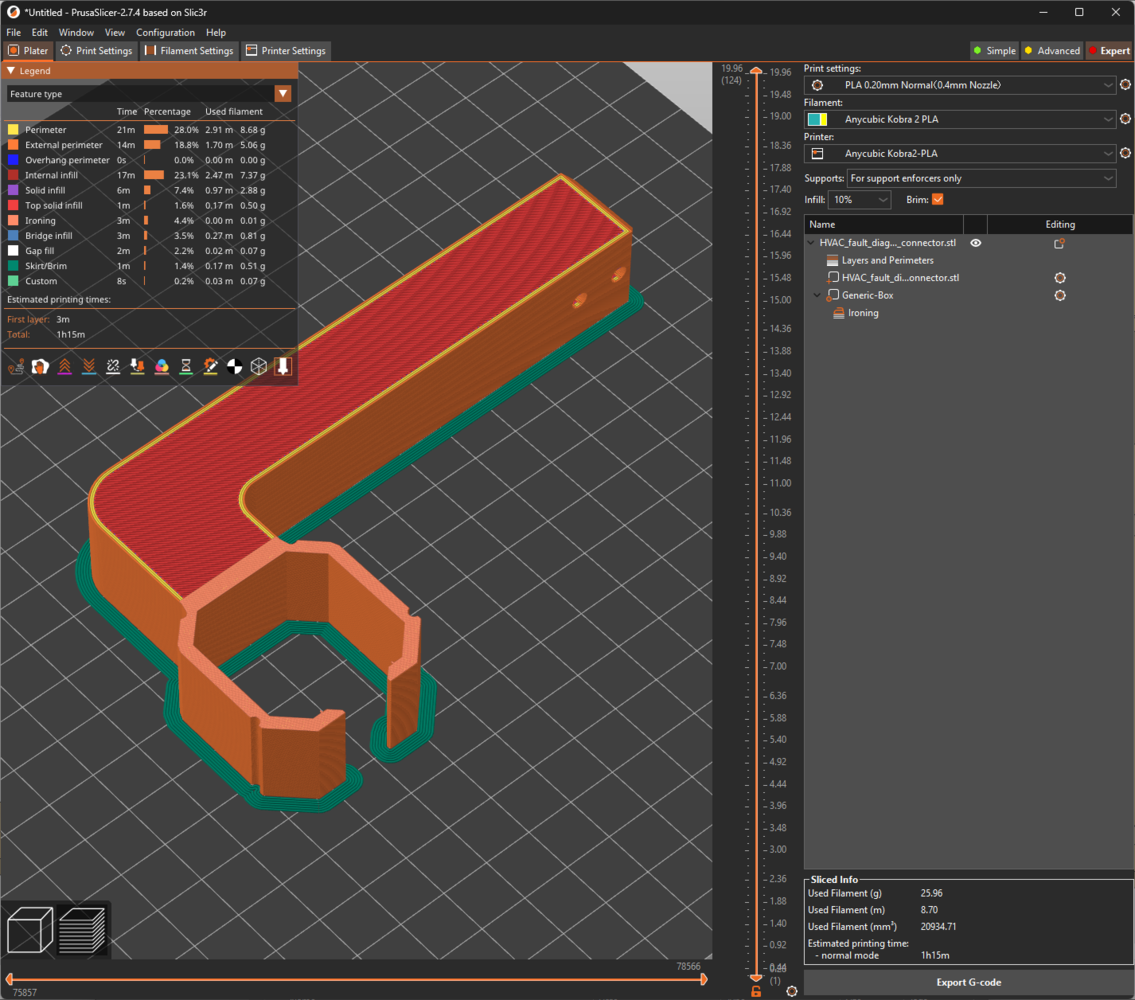
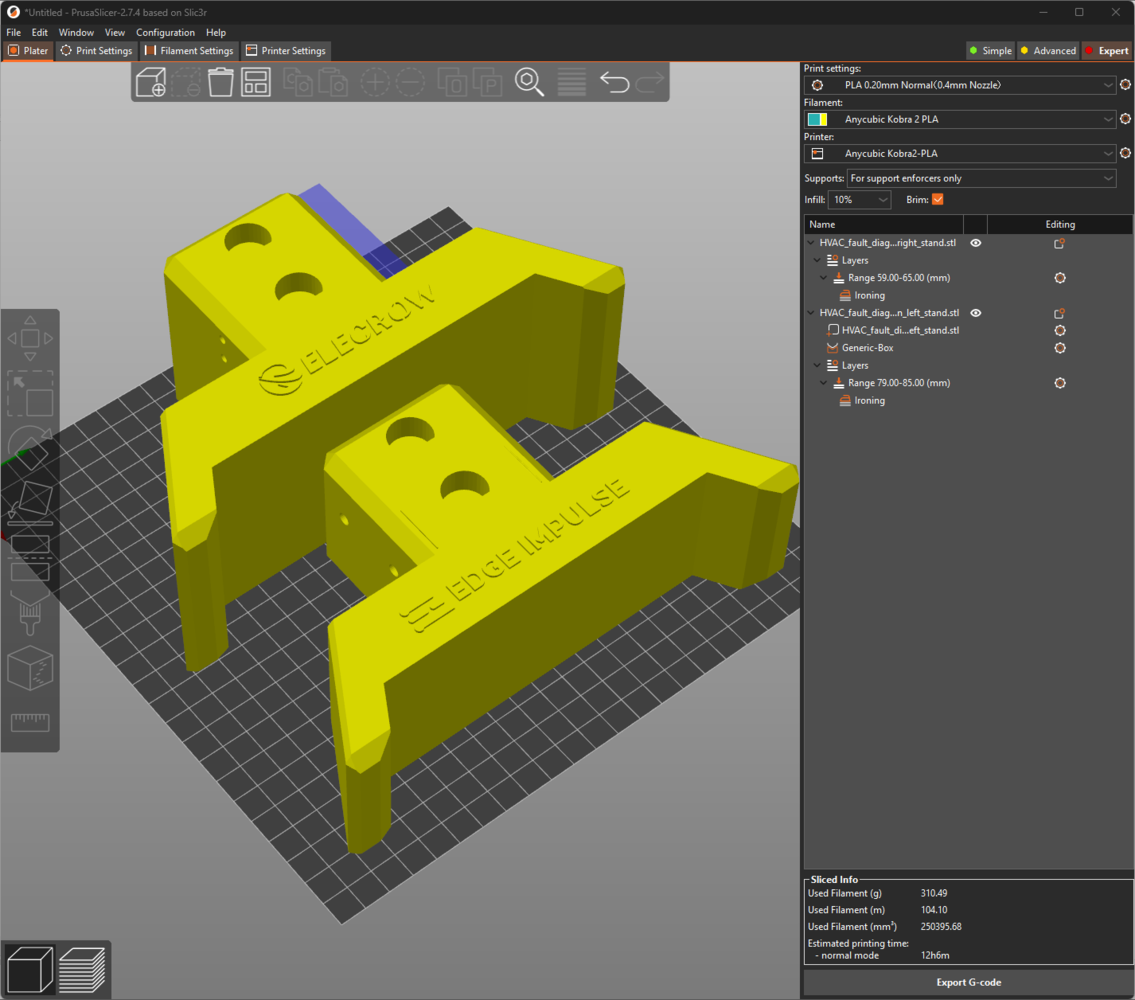
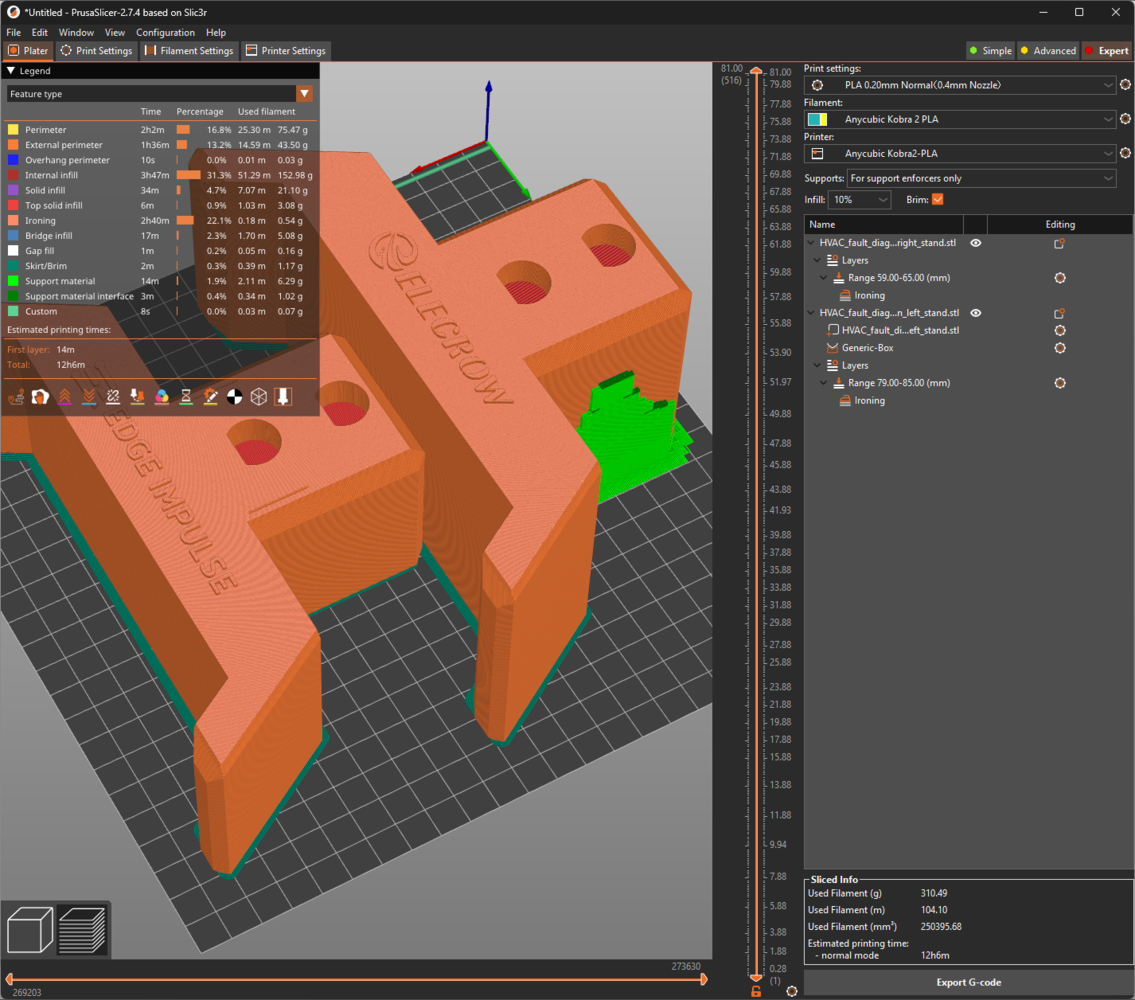
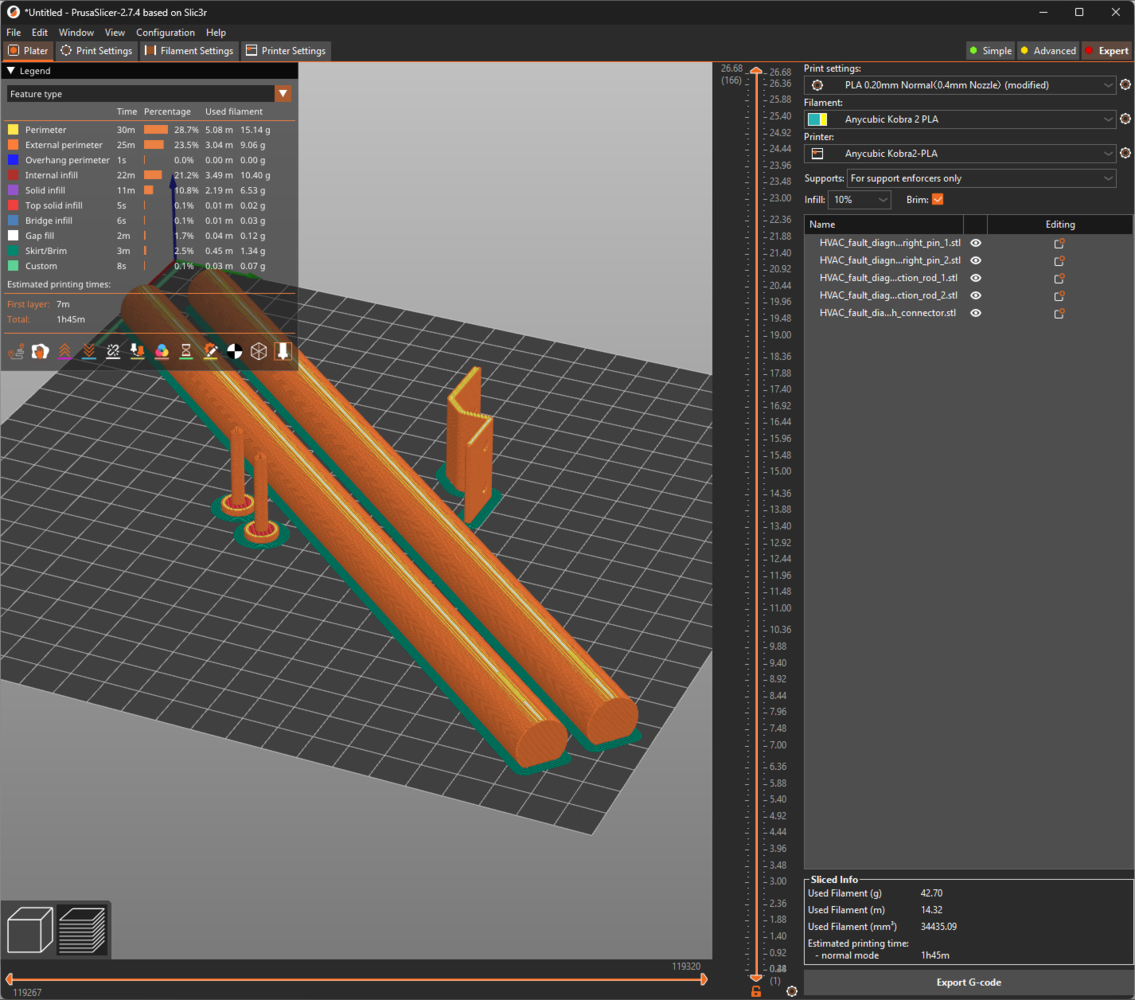
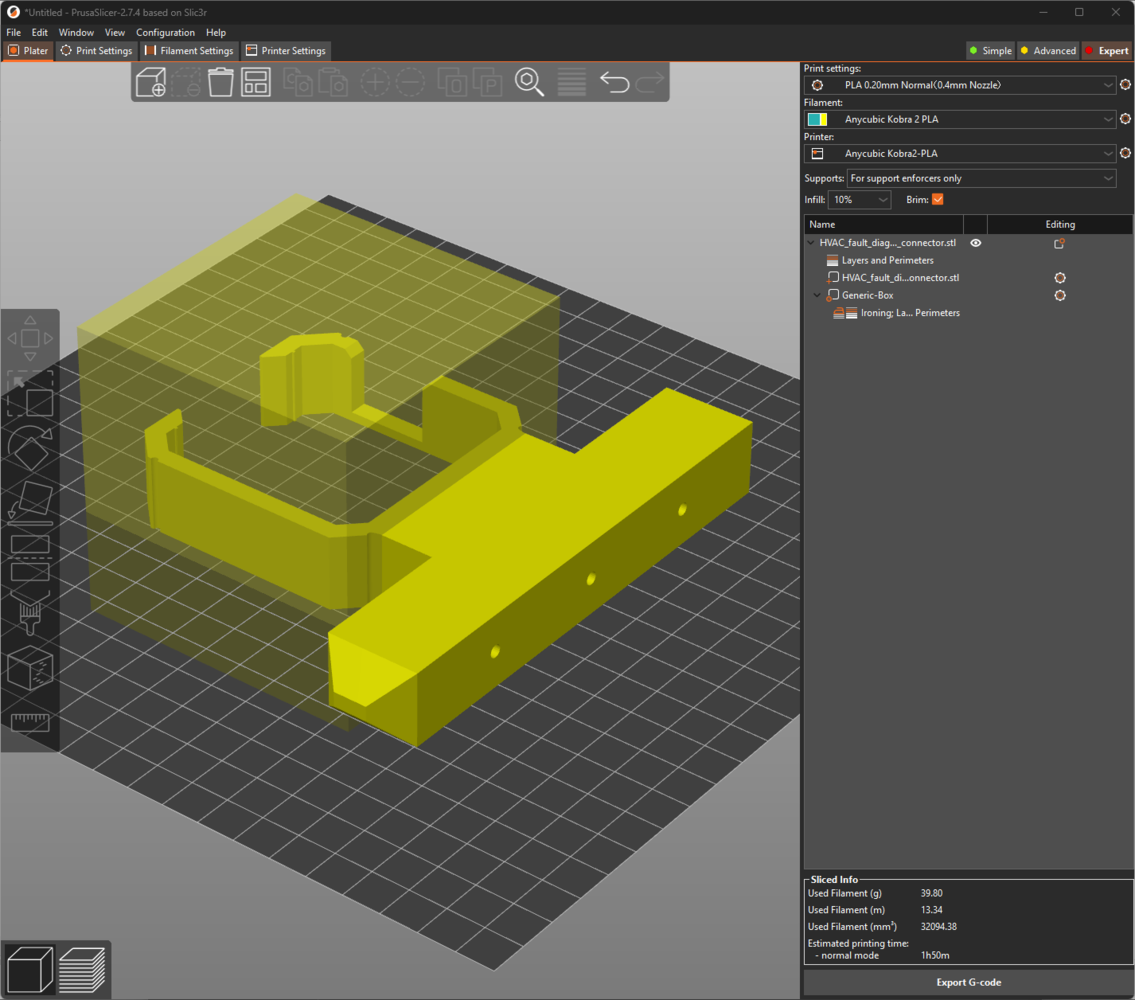
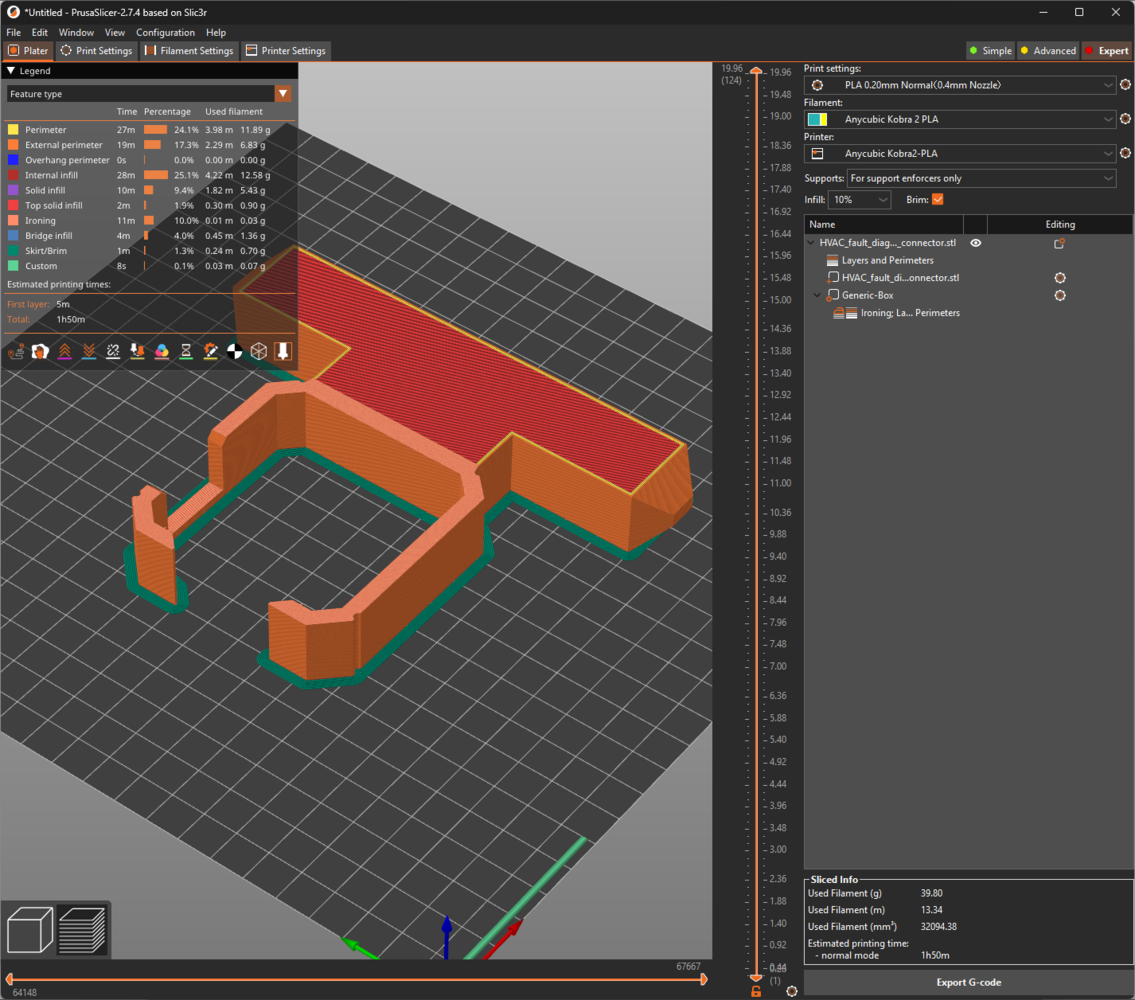
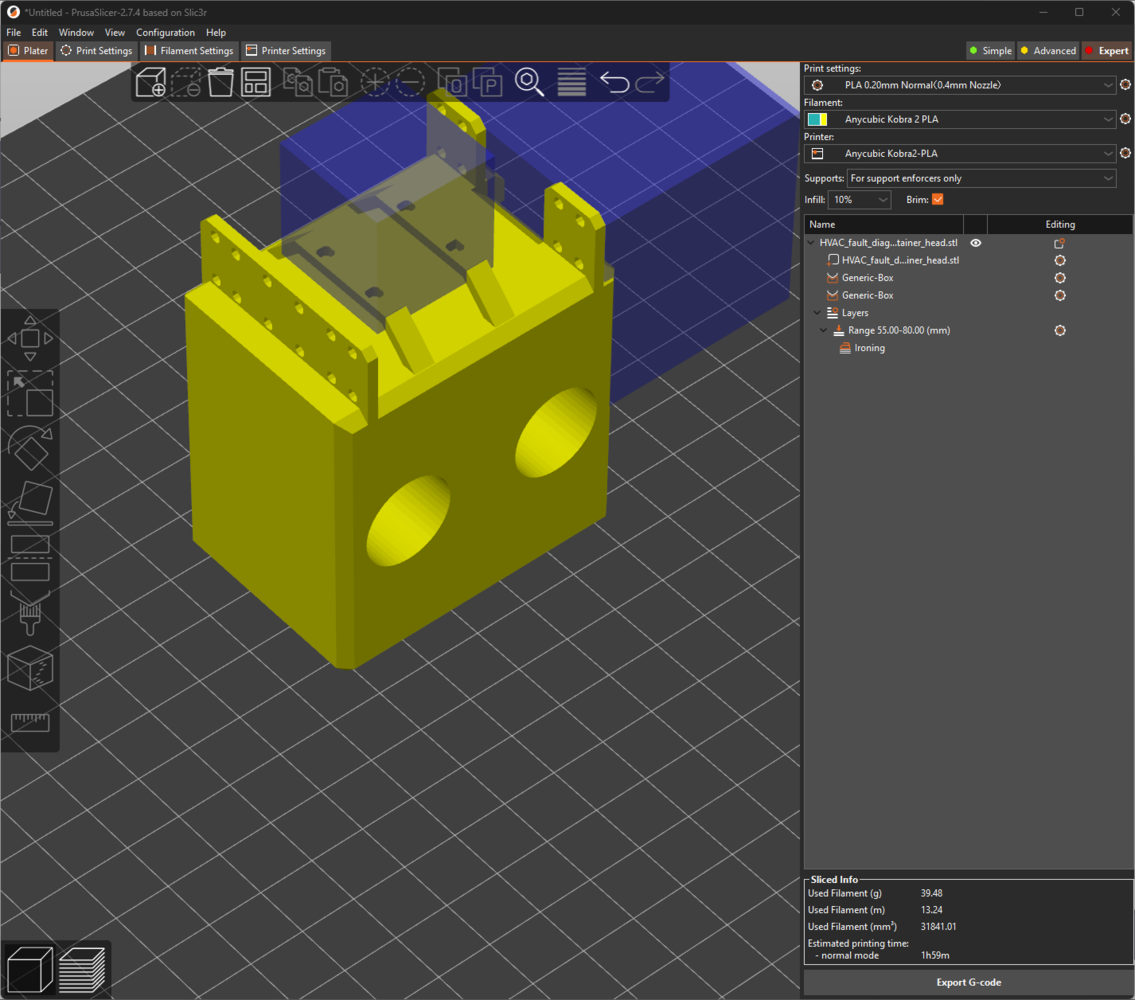
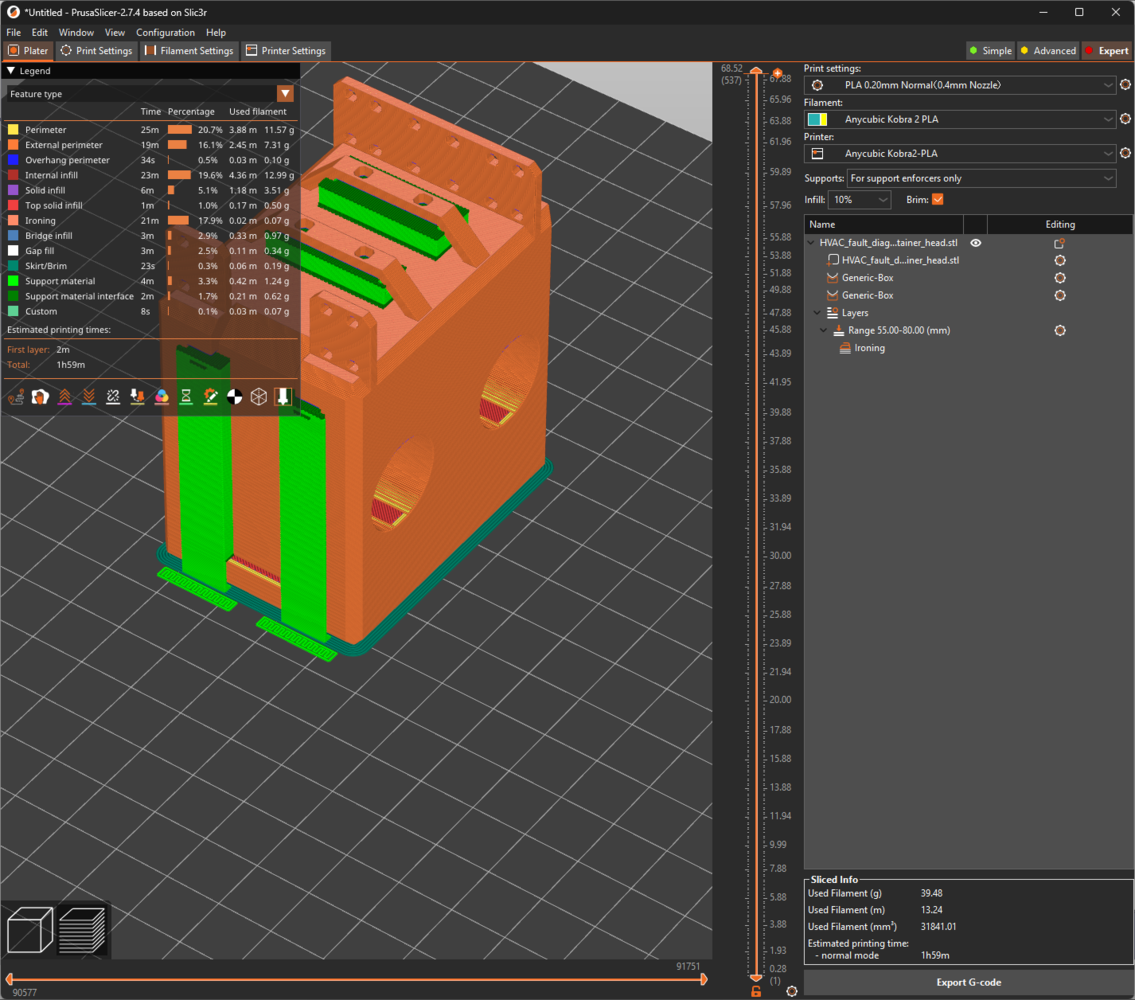
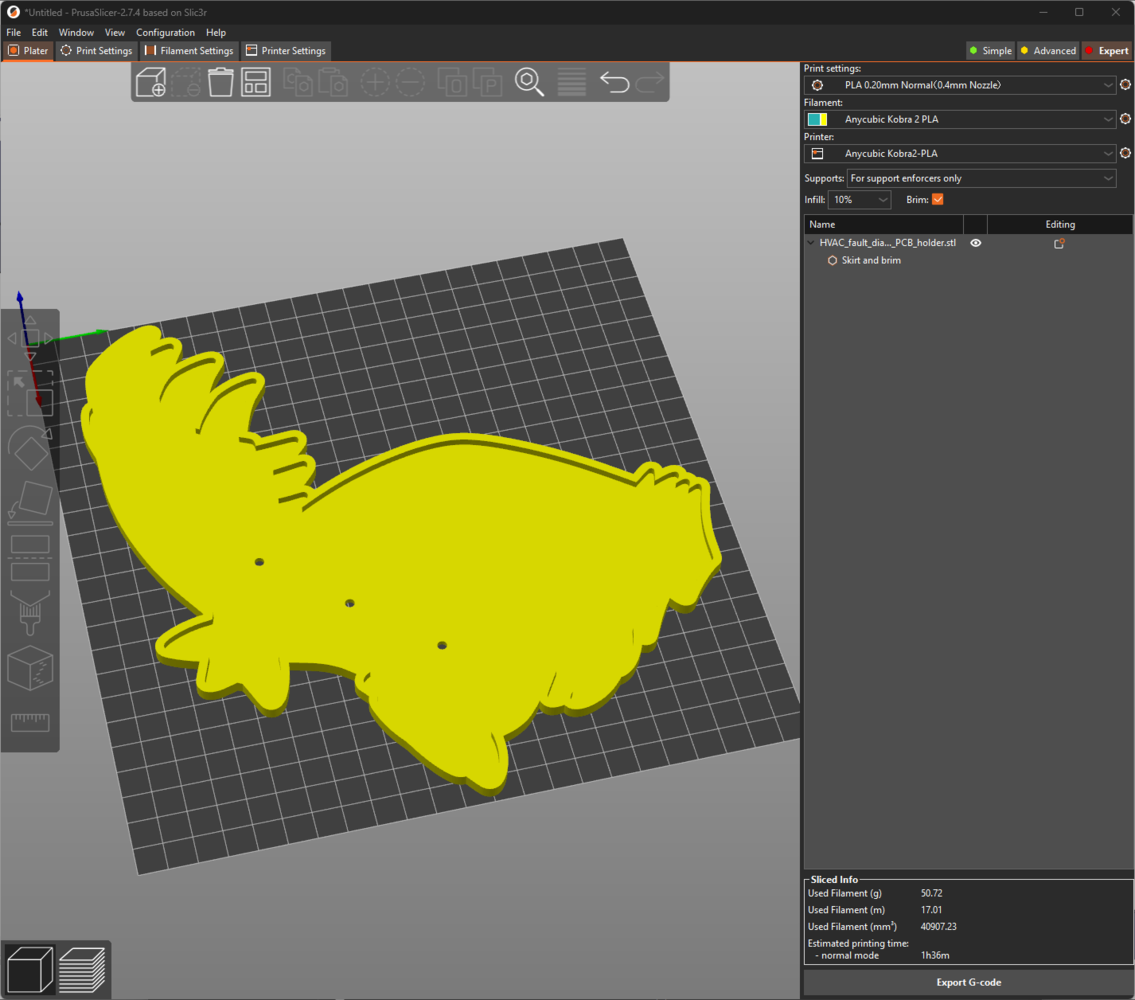
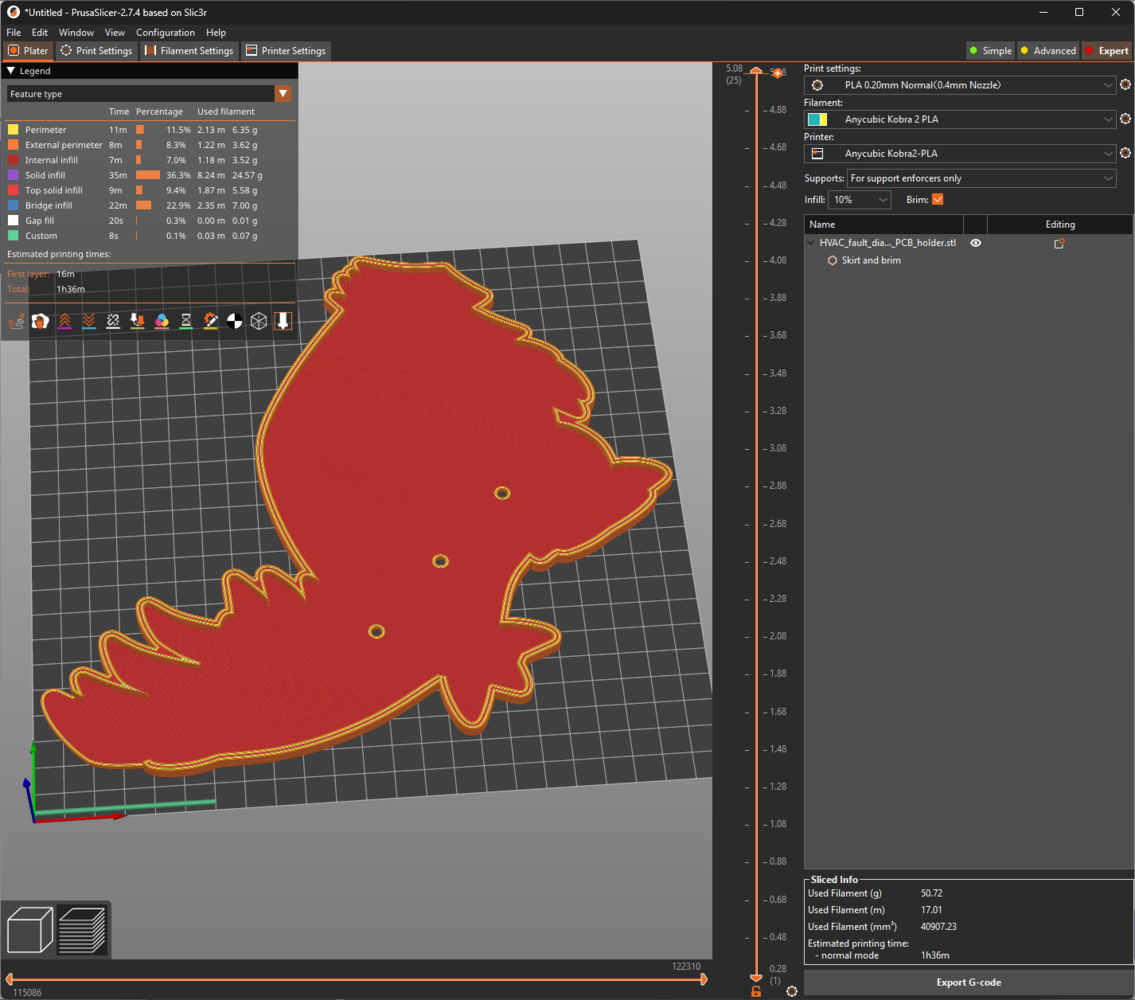
After designing 3D models and exporting them as STL files, I sliced the exported models in PrusaSlicer, which provides lots of groundbreaking features such as paint-on supports and height range modifiers.
Fusion 360 side view of the radiator fan clearance beside the printed legs

95


Fusion 360 close-up of the underside of the mounted radiator assembly

96


Fusion 360 fit-check view of the assembled Kyogre enclosure and radiator bracket

97


Fusion 360 mounted view of the radiator mount from a rear angle

98


Fusion 360 rear view of the screw holes for joining the printed mount pieces

99


Fusion 360 exploded view of the final radiator mount model with PCB support

100


Fusion 360 detail view of the completed sound-side CAD assembly

101


Fusion 360 front view of the full Kyogre radiator assembly fit check

102

Since I wanted to apply a unique industrial theme representing vivid industrial processes, I utilized this PLA filament:
  • ePLA-Matte Tangerine
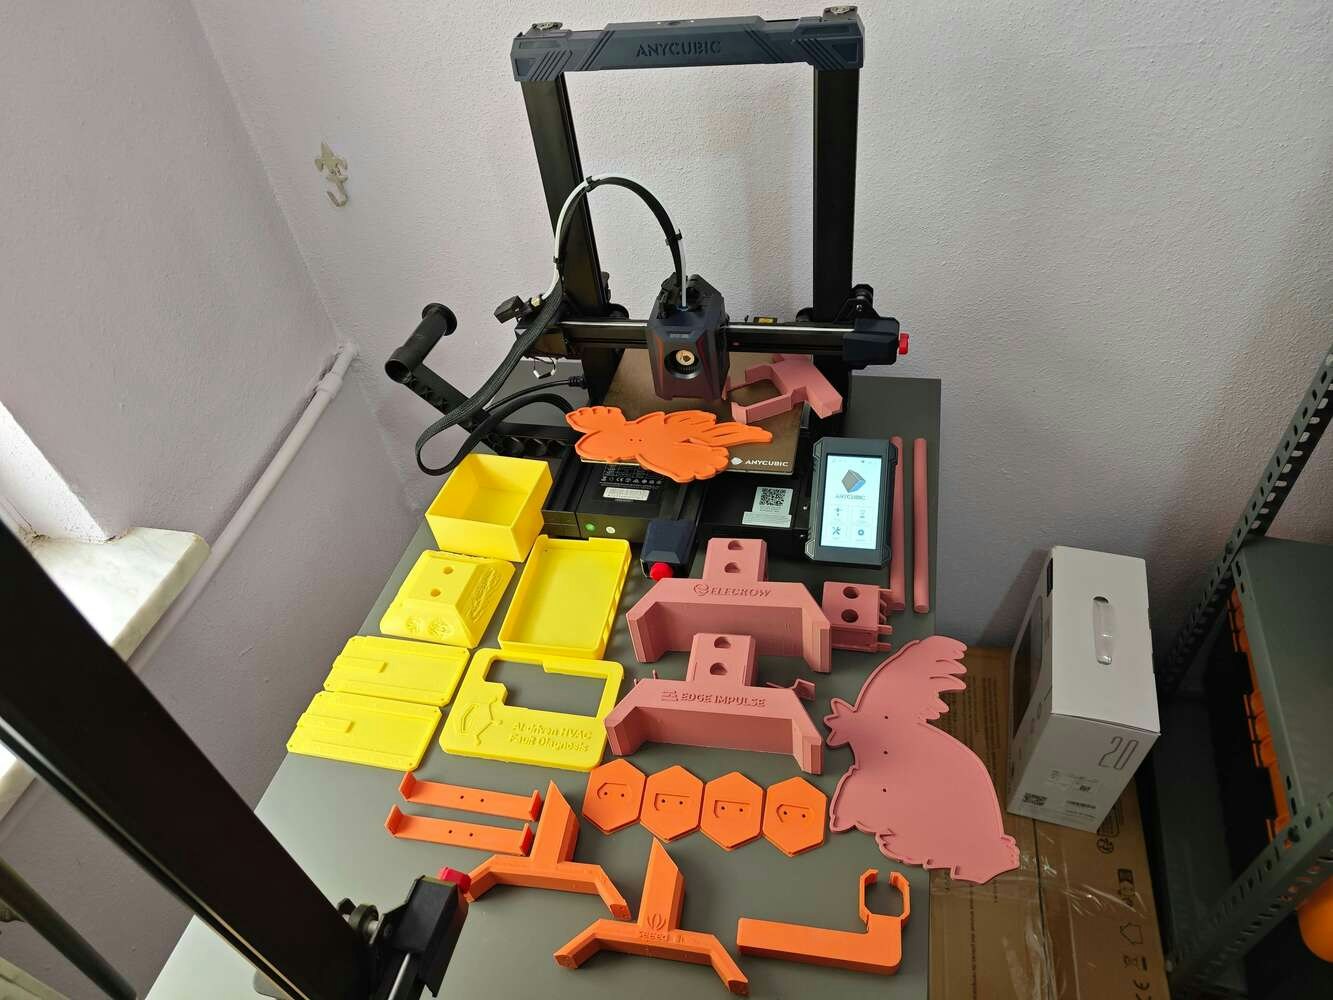
Finally, I printed all of the mentioned models with my Anycubic Kobra 2 3D Printer.
Freshly printed orange radiator mount and Kyogre enclosure parts laid out for assembly

103

Step 2.a.1: Assembling the 3D-printed components

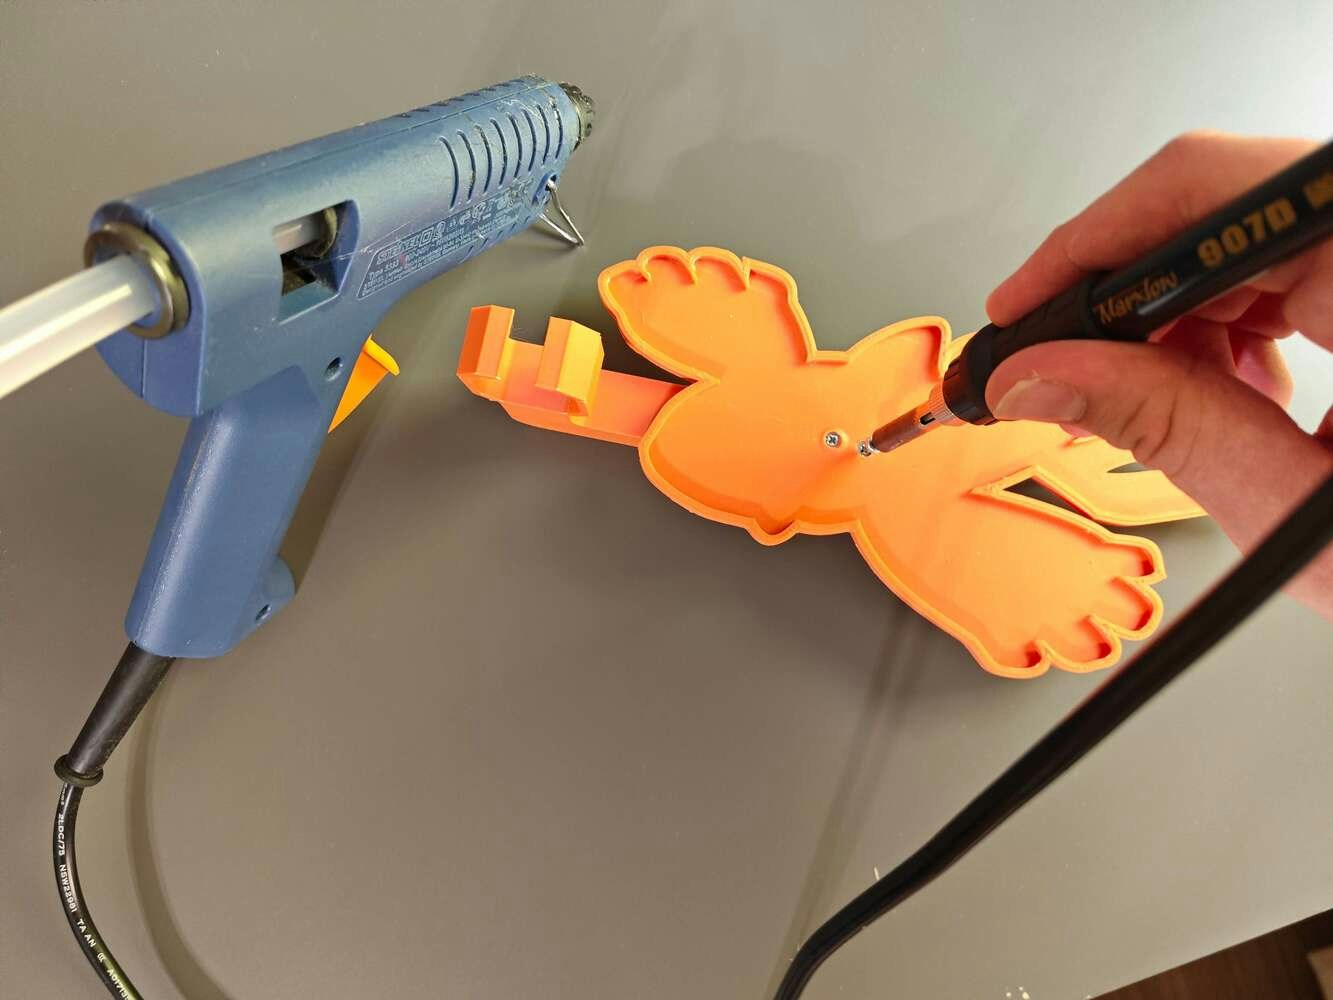
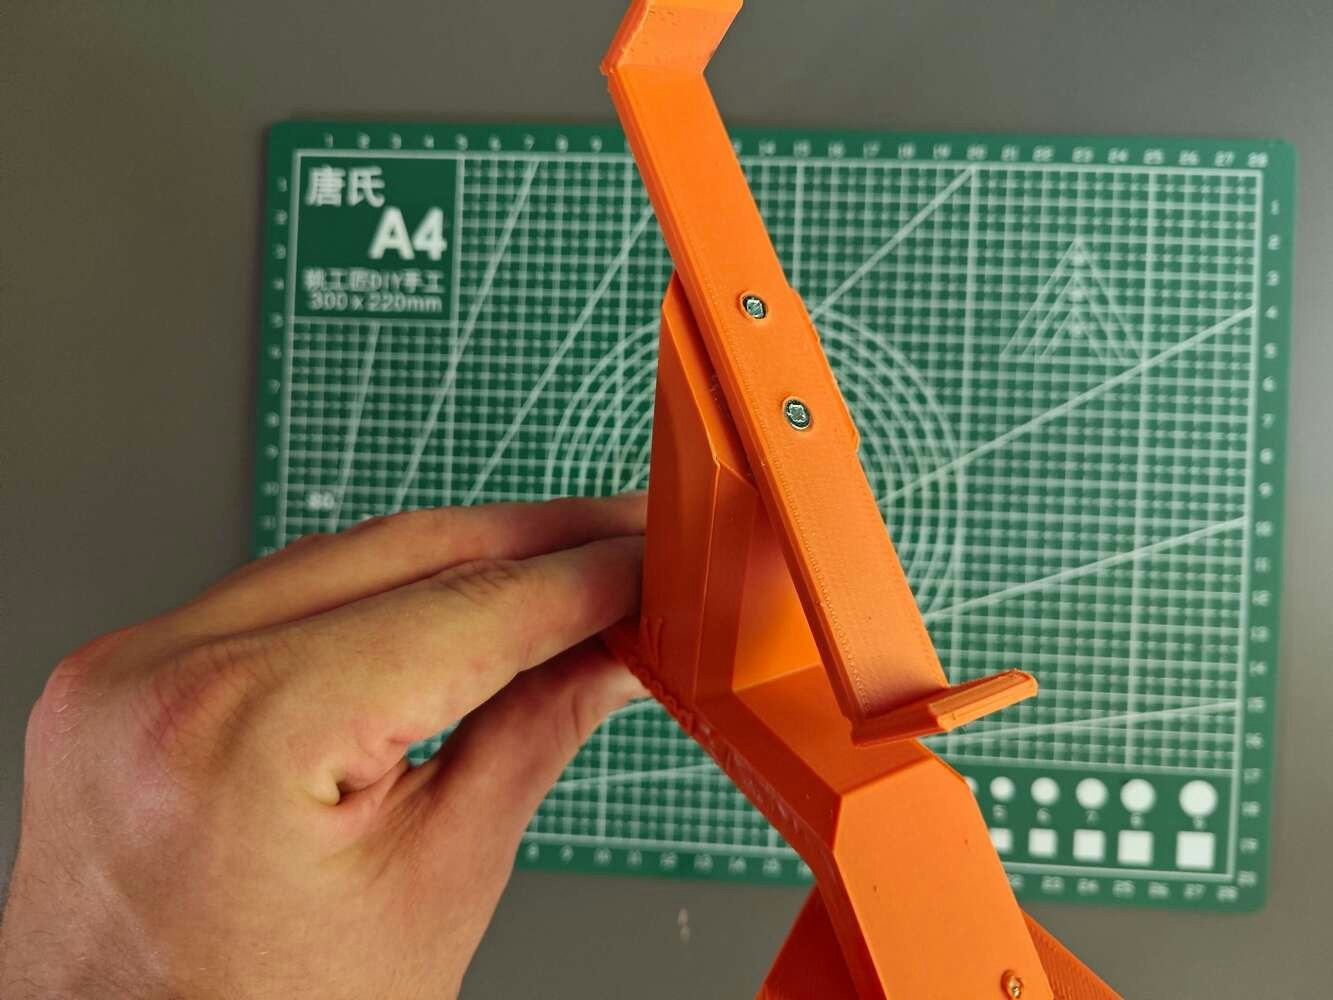
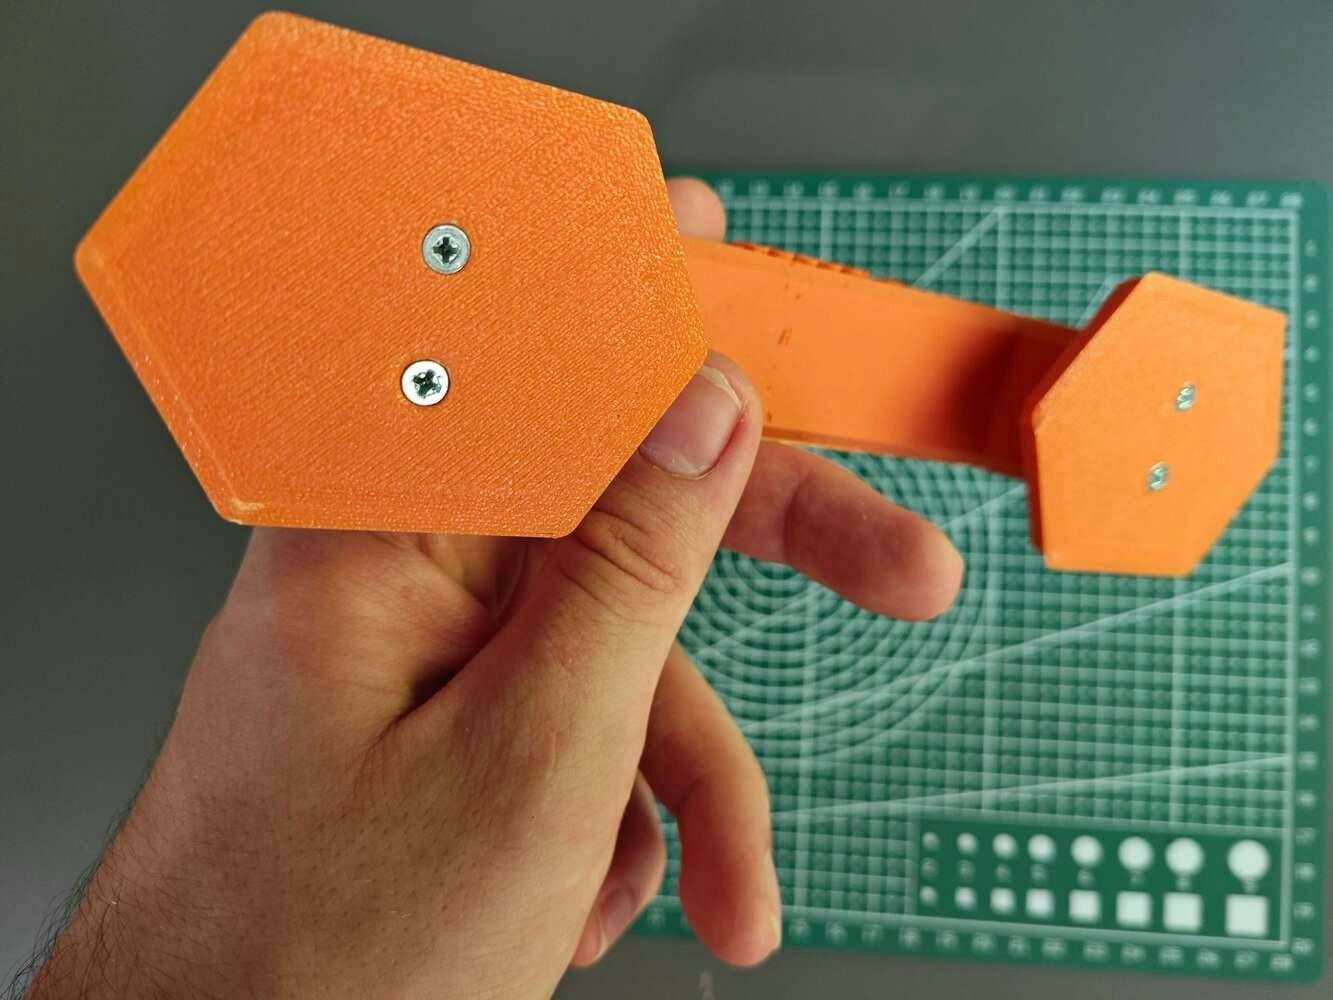
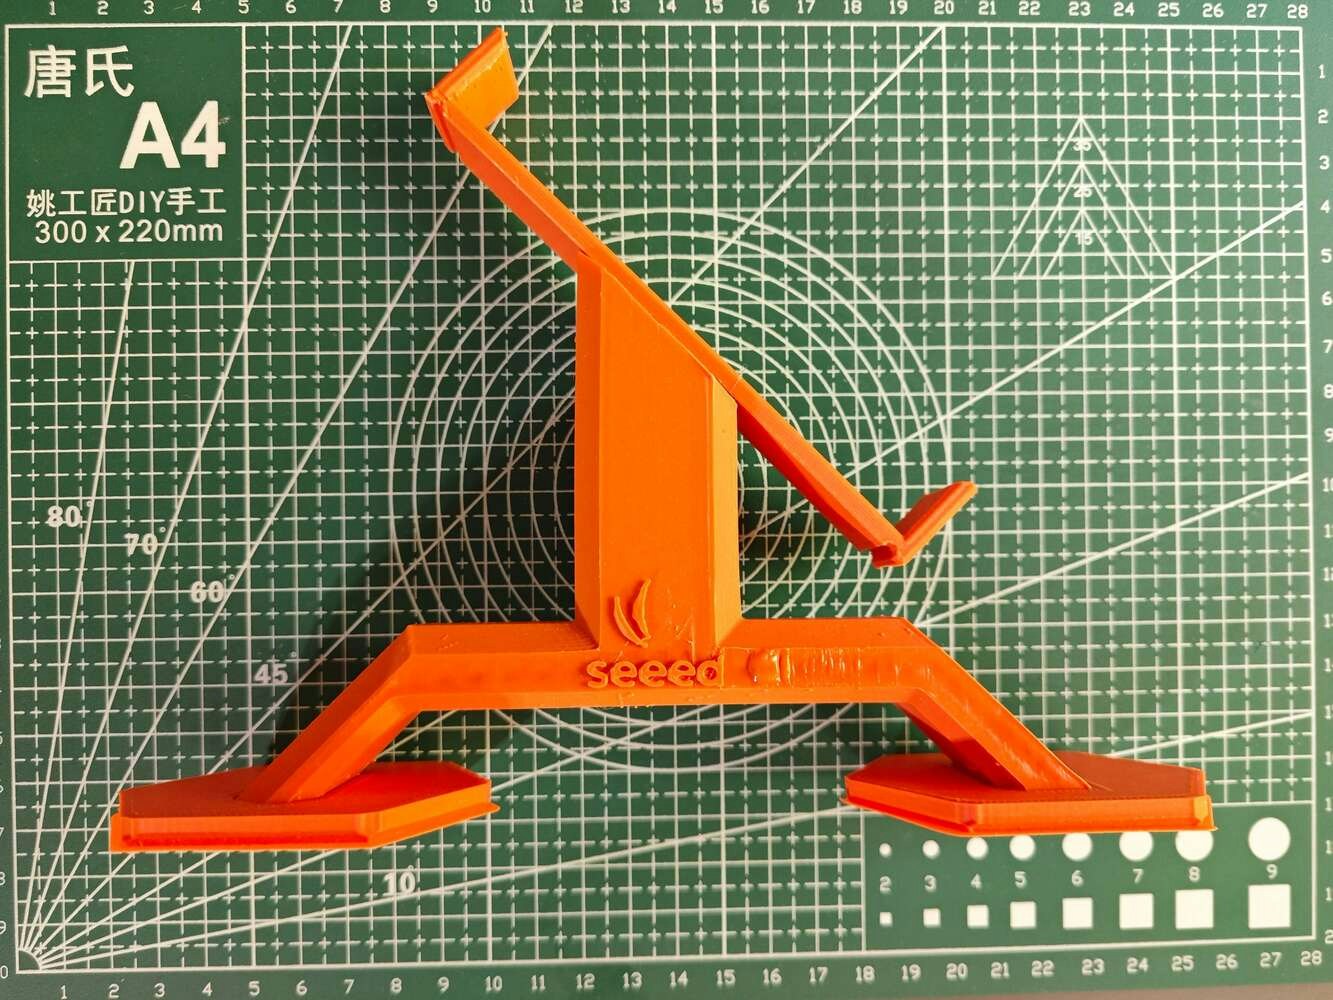
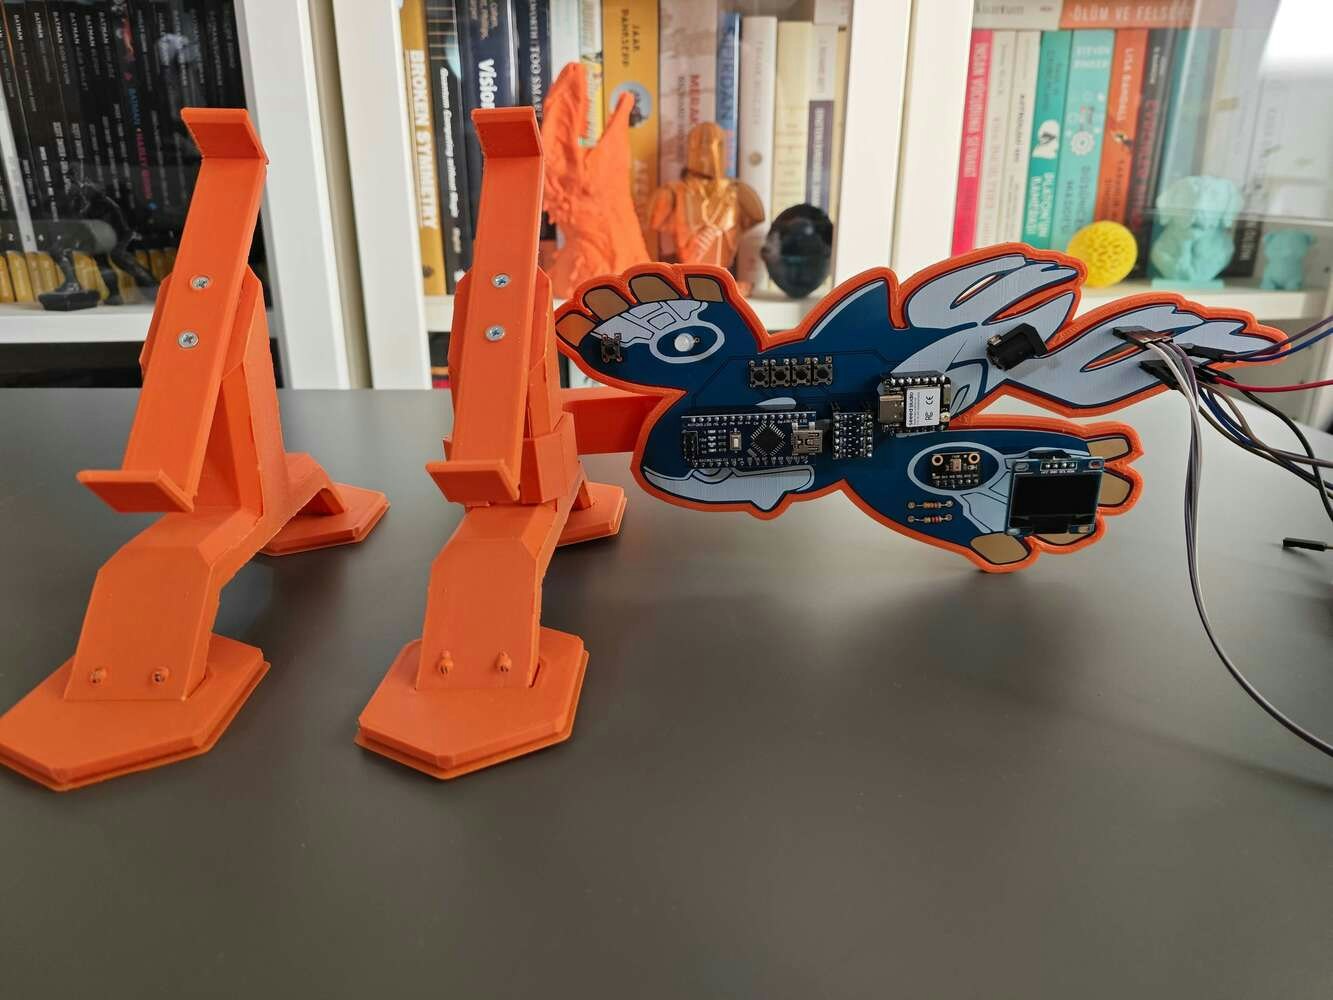
After printing all 3D models related to the aluminum radiator, I started to combine the radiator mount parts via M3 screws through the assembly-ready screw holes. Then, I fastened the unique Kyogre PCB encasement to the complementary PCB connector via M3 screws. Since the PCB connector is compatible with the right radiator mount via its buckle-shaped snap-fit joint, I was able to interlock the PCB connector with the right mount body effortlessly. Although I applied hot glue between parts while affixing them via M3 screws, it was still not enough to build a production-ready device, especially considering the harsh operating conditions of industrial HVAC systems. Thus, I employed a well-known injection molding technique to make the connections more sturdy. In this technique, a heat press mechanism is generally utilized to add threaded brass inserts between 3D-printed parts to connect them firmly. In my version, I simply used a soldering iron to embed M3 screws directly into the assembly-ready holes instead of threaded inserts to fasten the parts together.
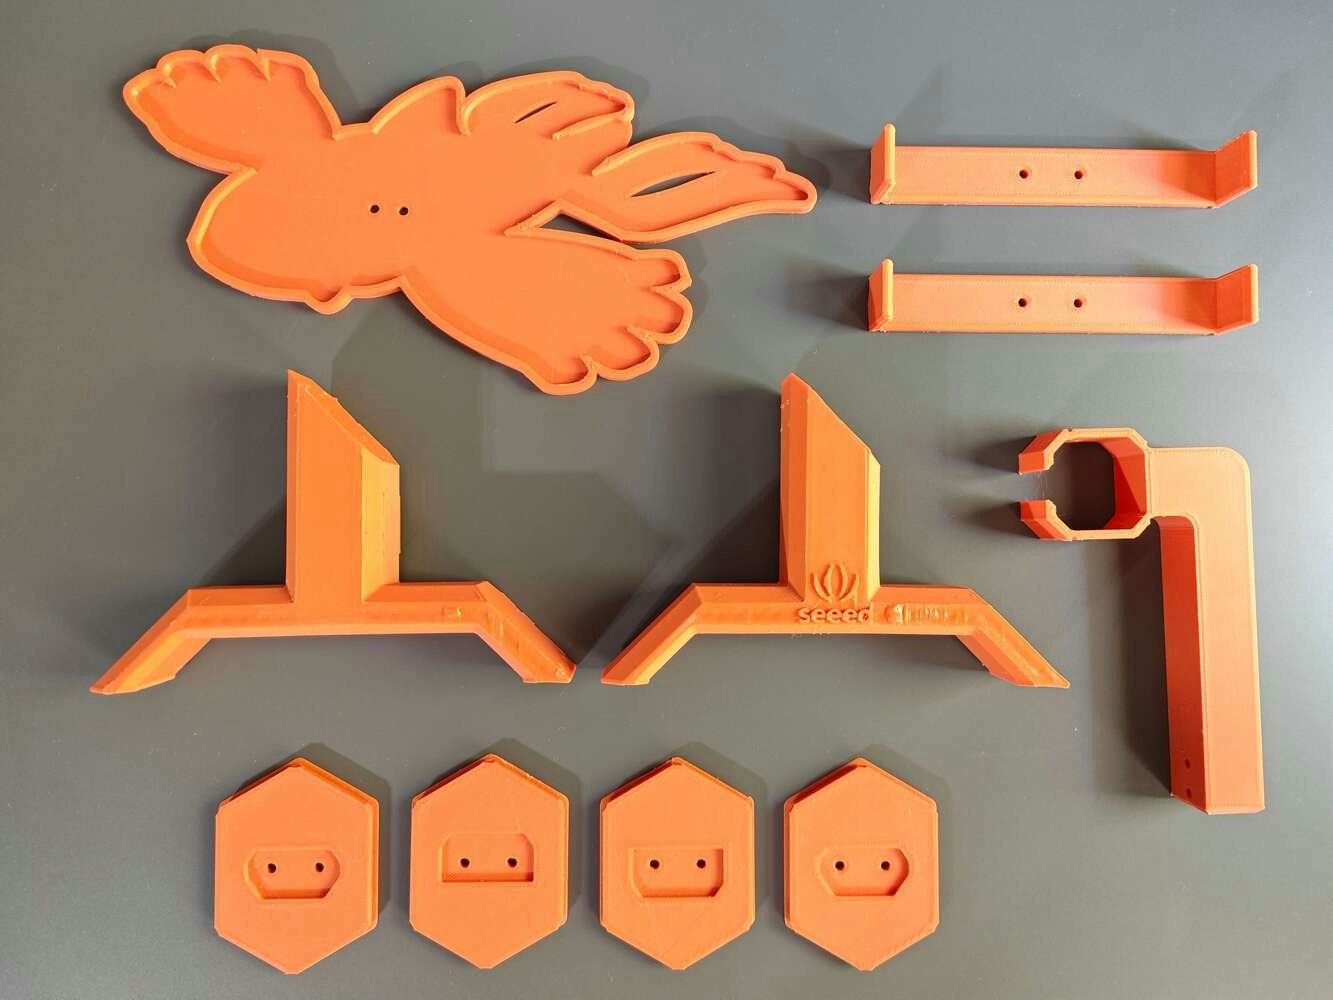
Kyogre radiator mount assembly step 1, aligning parts from an angled view with the orange sound-side enclosure

104


Kyogre radiator mount assembly step 2, fastening parts in a top view with the orange sound-side enclosure

105


Kyogre radiator mount assembly step 3, mounting parts in a side view with the orange sound-side enclosure

106


Kyogre radiator mount assembly step 4, routing parts in a close-up with the orange sound-side enclosure

107


Kyogre radiator mount assembly step 5, checking parts in a fit-check view with the orange sound-side enclosure

108


Kyogre radiator mount assembly step 6, reinforcing parts in a mounted view with the orange sound-side enclosure

109


Kyogre radiator mount assembly step 7, seating parts in a rear view with the orange sound-side enclosure

110


Kyogre radiator mount assembly step 8, joining parts in an exploded view with the orange sound-side enclosure

111


Kyogre radiator mount assembly step 9, finishing parts in a detail view with the orange sound-side enclosure

112


Kyogre radiator mount assembly step 10, positioning parts in a front view with the orange sound-side enclosure

113


Kyogre radiator mount assembly step 11, aligning parts from an angled view with the orange sound-side enclosure

114

As discussed earlier, I employed the soldering iron to embed M3 screws directly into the assembly-ready holes to affix parts tightly.
Kyogre radiator mount assembly step 12, fastening parts in a top view with epoxy reinforcing the printed joints in the orange sound-side enclosure

115


Kyogre radiator mount assembly step 13, mounting parts in a side view with the orange sound-side enclosure

116


Kyogre radiator mount assembly step 14, routing parts in a close-up with the orange sound-side enclosure

117


Kyogre radiator mount assembly step 15, checking parts in a fit-check view with the orange sound-side enclosure

118


Kyogre radiator mount assembly step 16, reinforcing parts in a mounted view with the orange sound-side enclosure

119


Kyogre radiator mount assembly step 17, seating parts in a rear view with the orange sound-side enclosure

120


Kyogre radiator mount assembly step 18, joining parts in an exploded view with the orange sound-side enclosure

121


Kyogre radiator mount assembly step 19, finishing parts in a detail view with the orange sound-side enclosure

122

After combining all the parts, I placed the aluminum radiator on the radiator mounts via their bracket-shaped snap-fit joints in order to test the strength of the mounts while carrying the radiator in a tilted position.
Kyogre radiator mount assembly step 20, positioning parts in a front view during the final fit test in the orange sound-side enclosure

123

Step 2.b: Designing and printing the CNC router moving the thermal camera and the Groudon PCB encasement

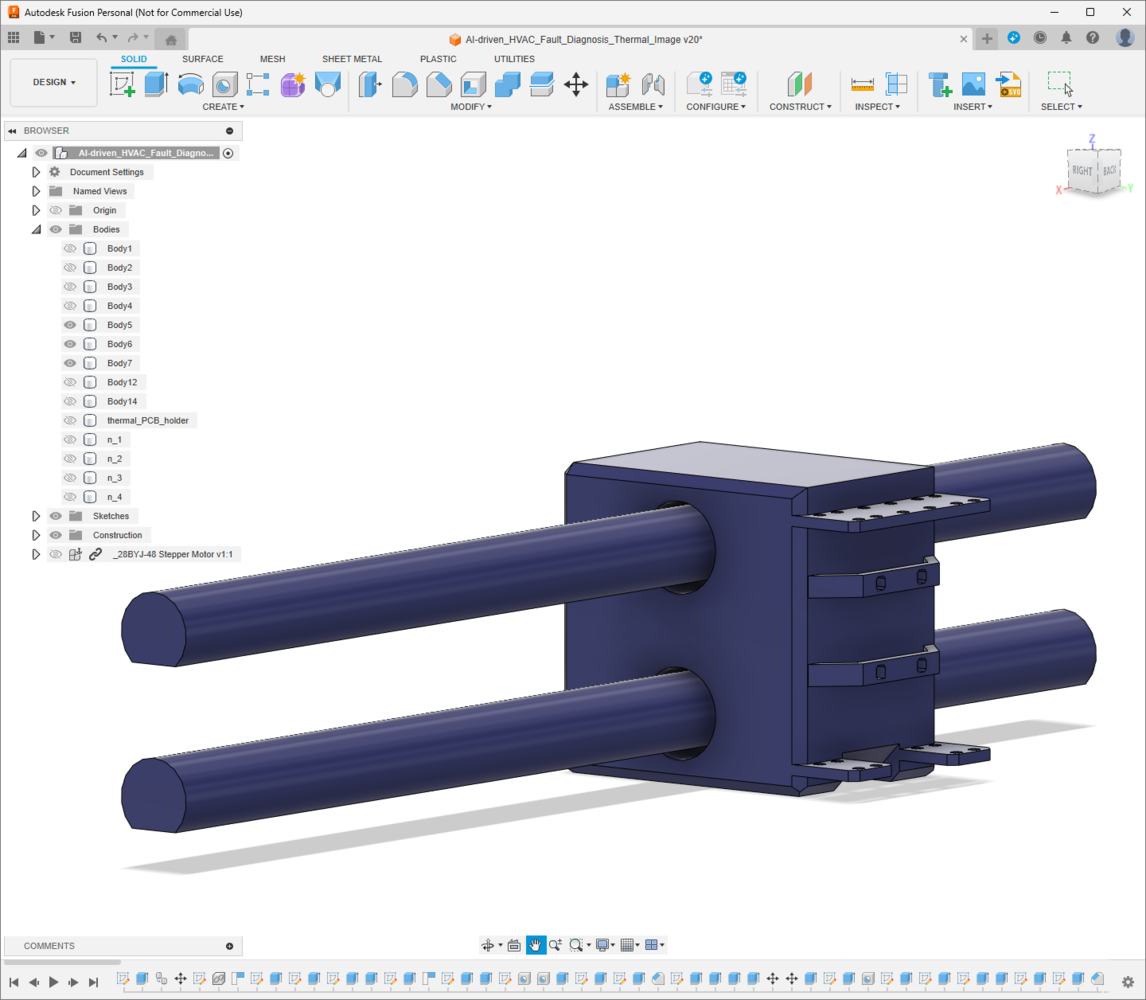
After modeling the 3D parts related to the aluminum radiator, I focused on designing a custom CNC router to move the thermal imaging camera to collect thermal scan (imaging) buffers from the predefined locations on the aluminum cooling blocks to produce an accurate thermal image. Also, I wanted to integrate the Groudon PCB as close as possible to the CNC router since the MLX90641 thermal imaging camera must be connected to Photon 2. Thus, I designed these parts:
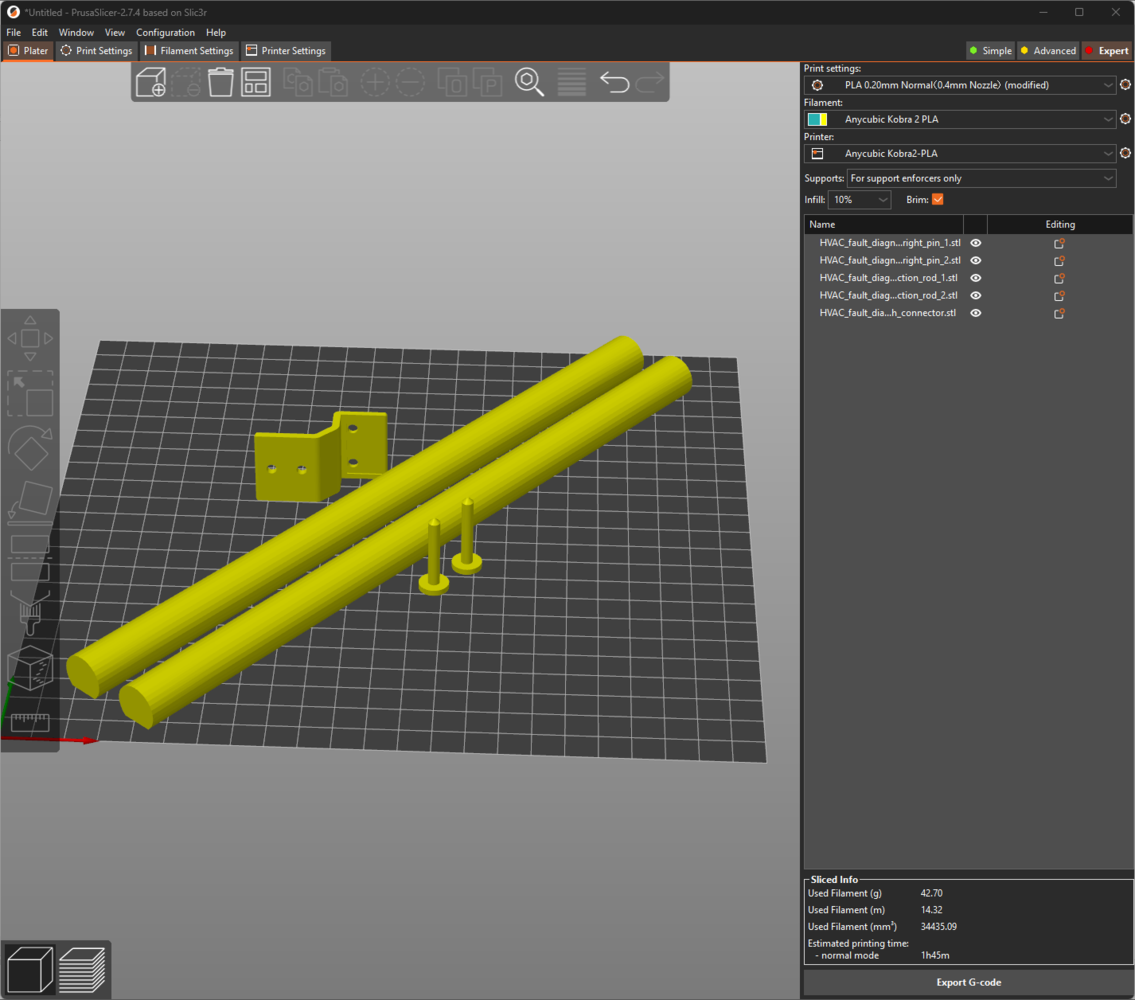
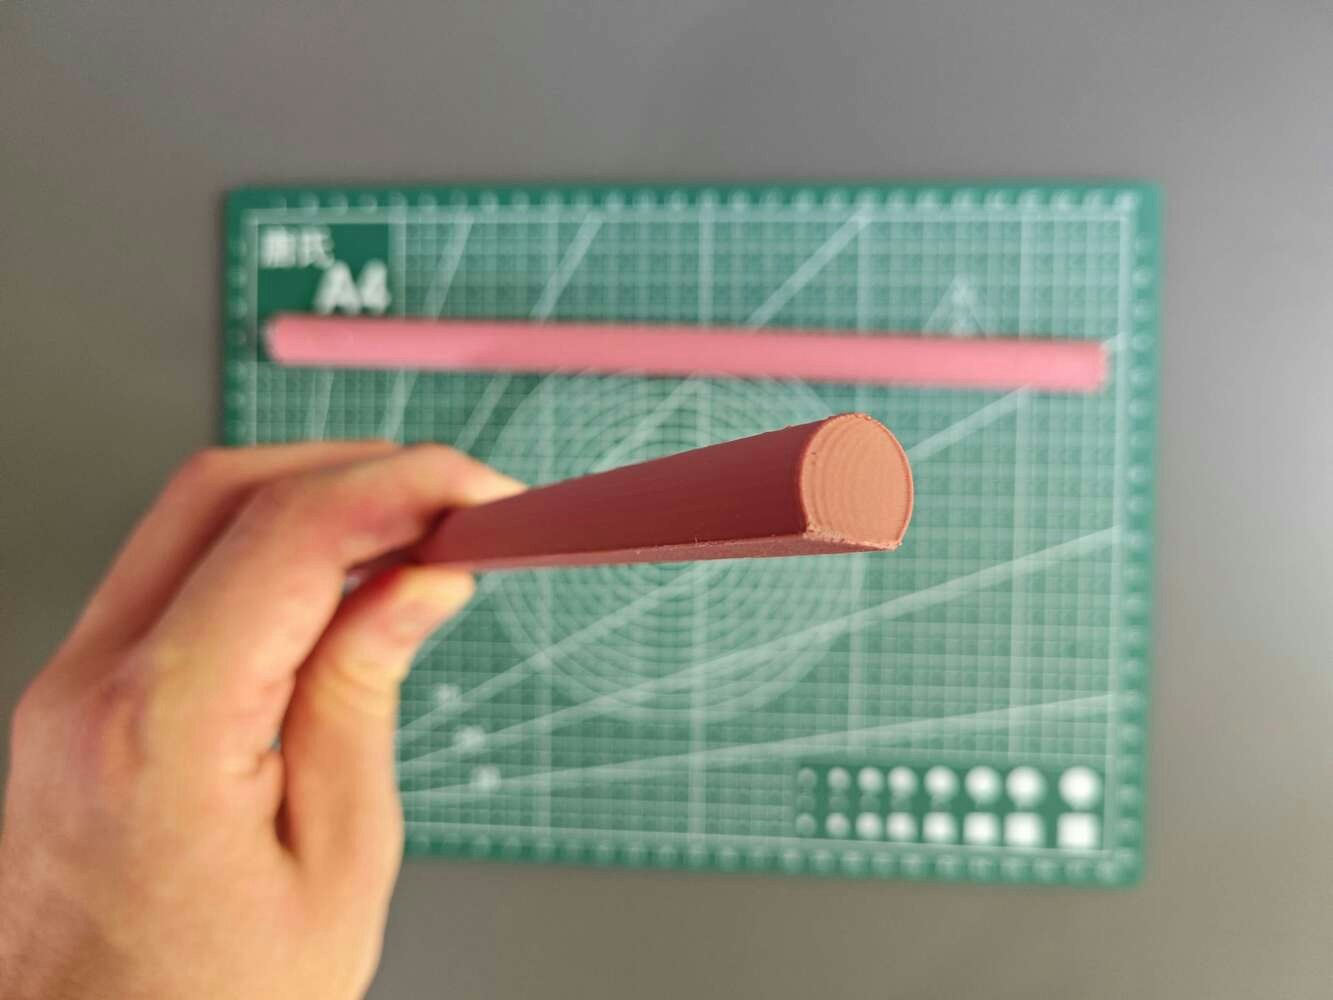
  • two chamfered CNC rods,
  • the micro switch connector,
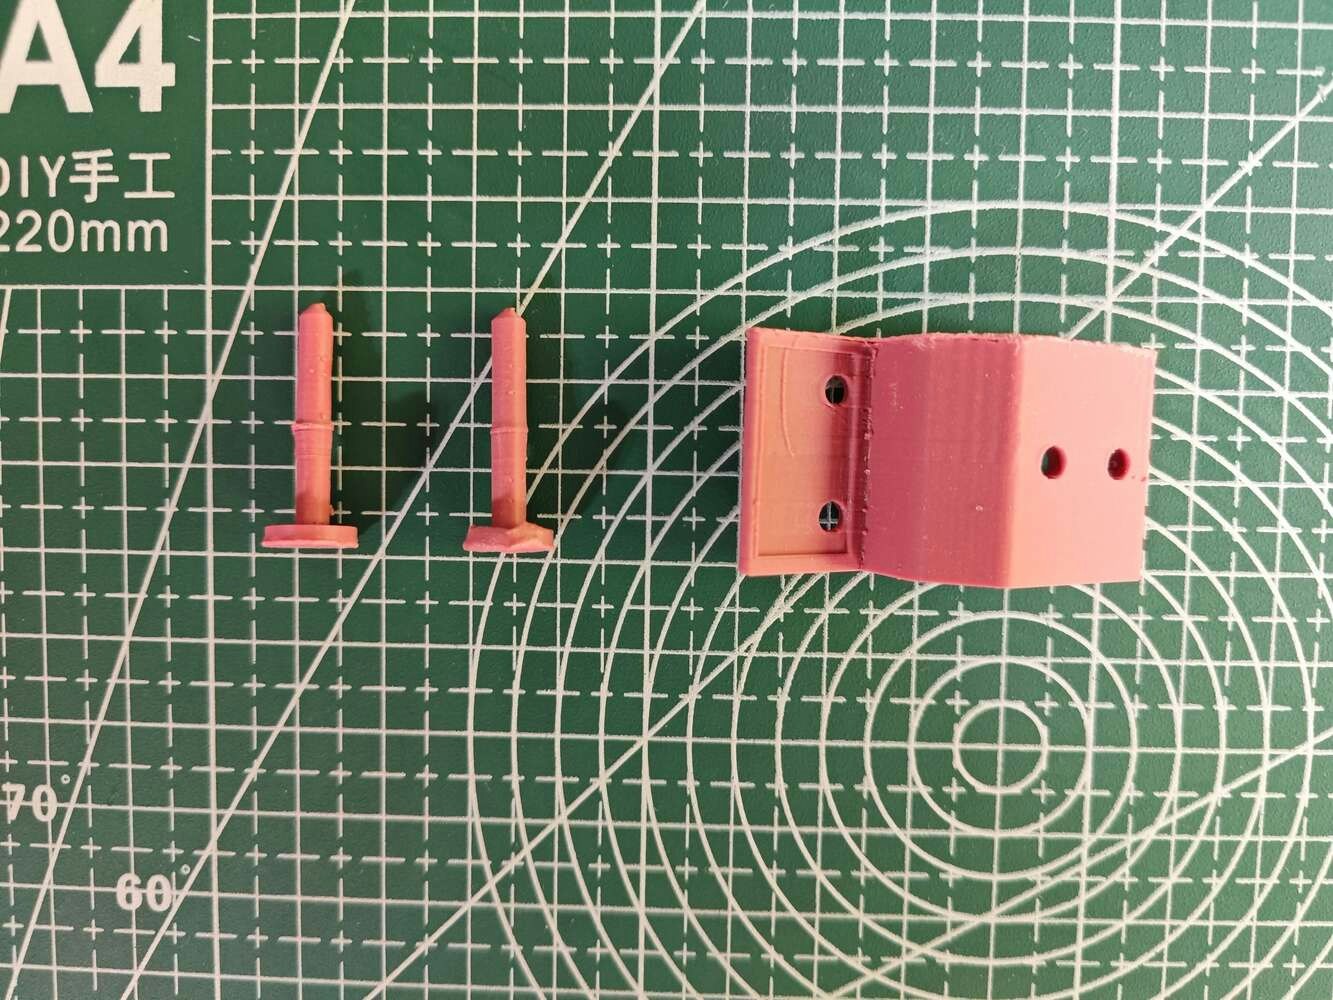
  • two special pins for attaching GT2 20T pulleys,
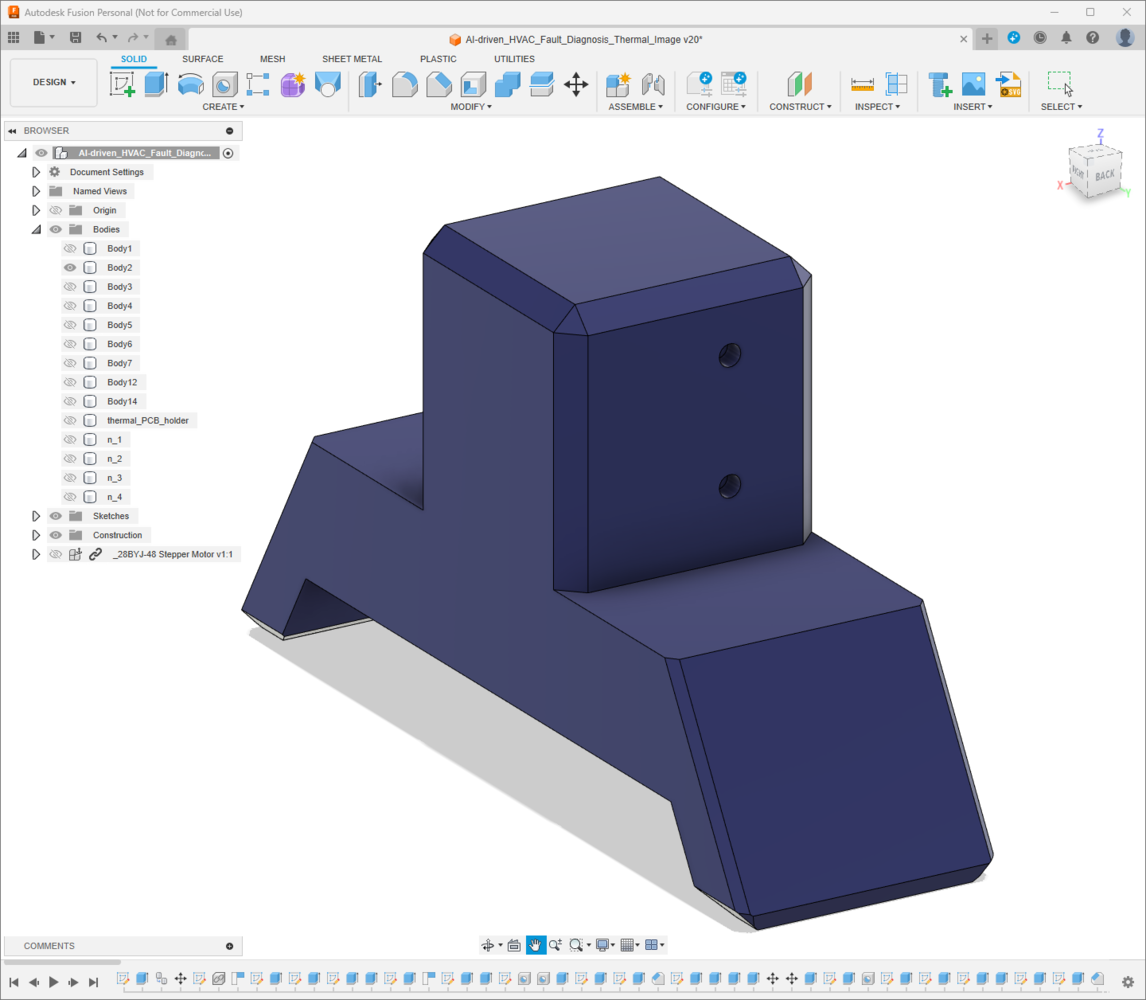
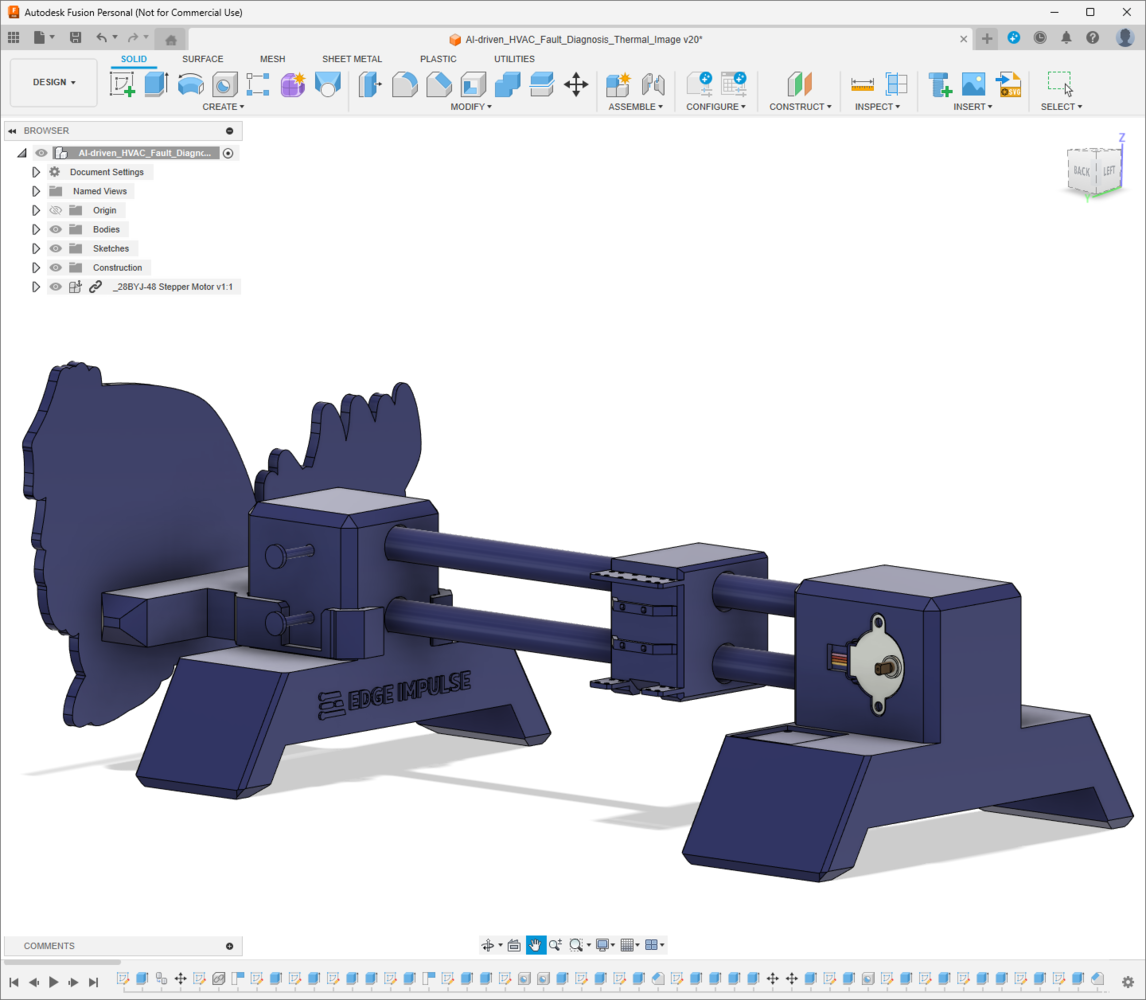
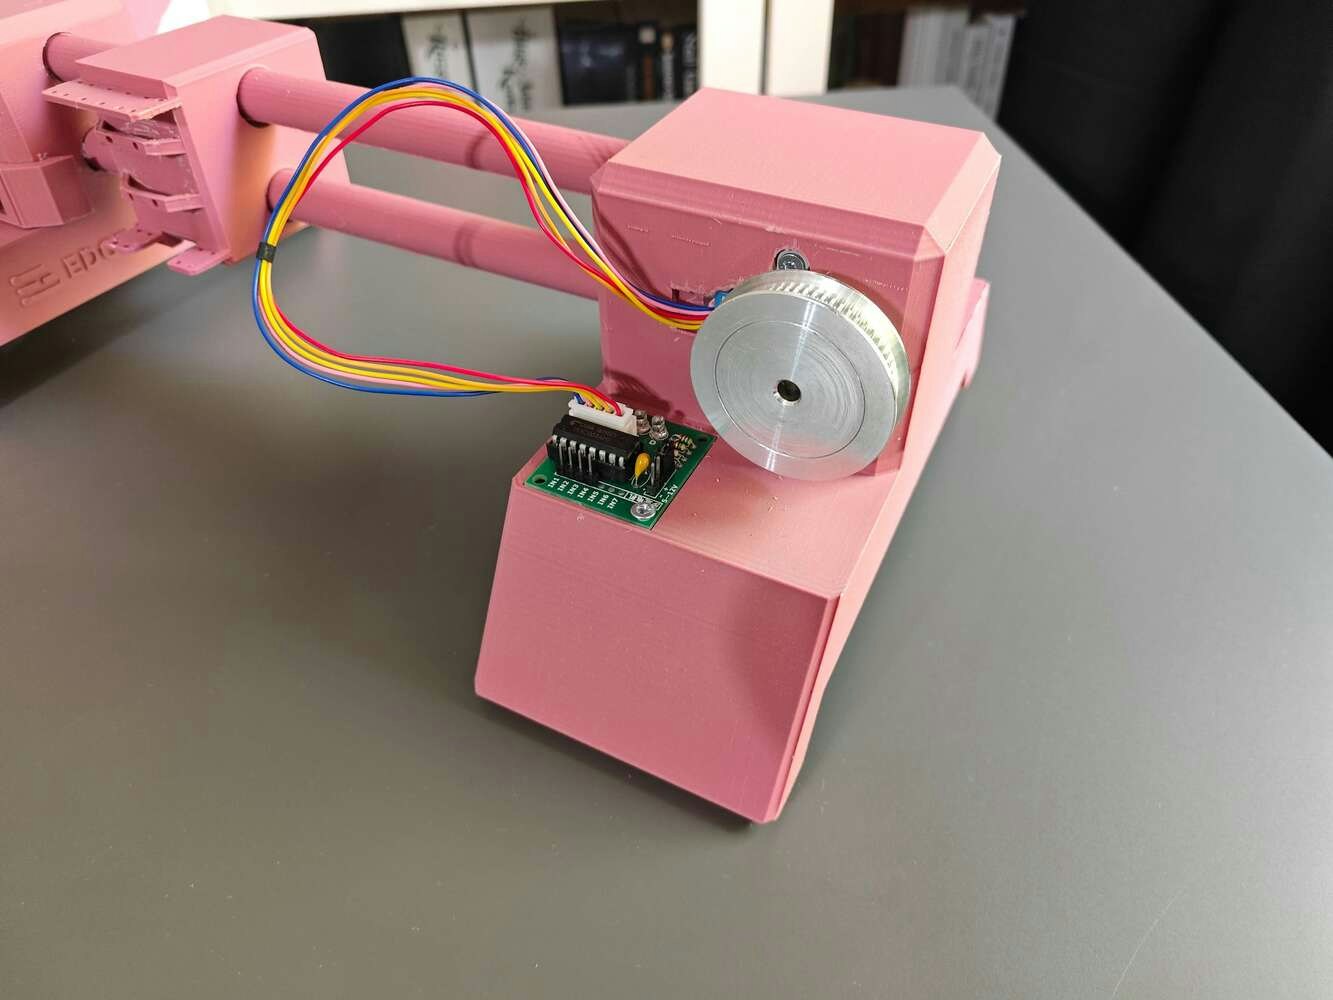
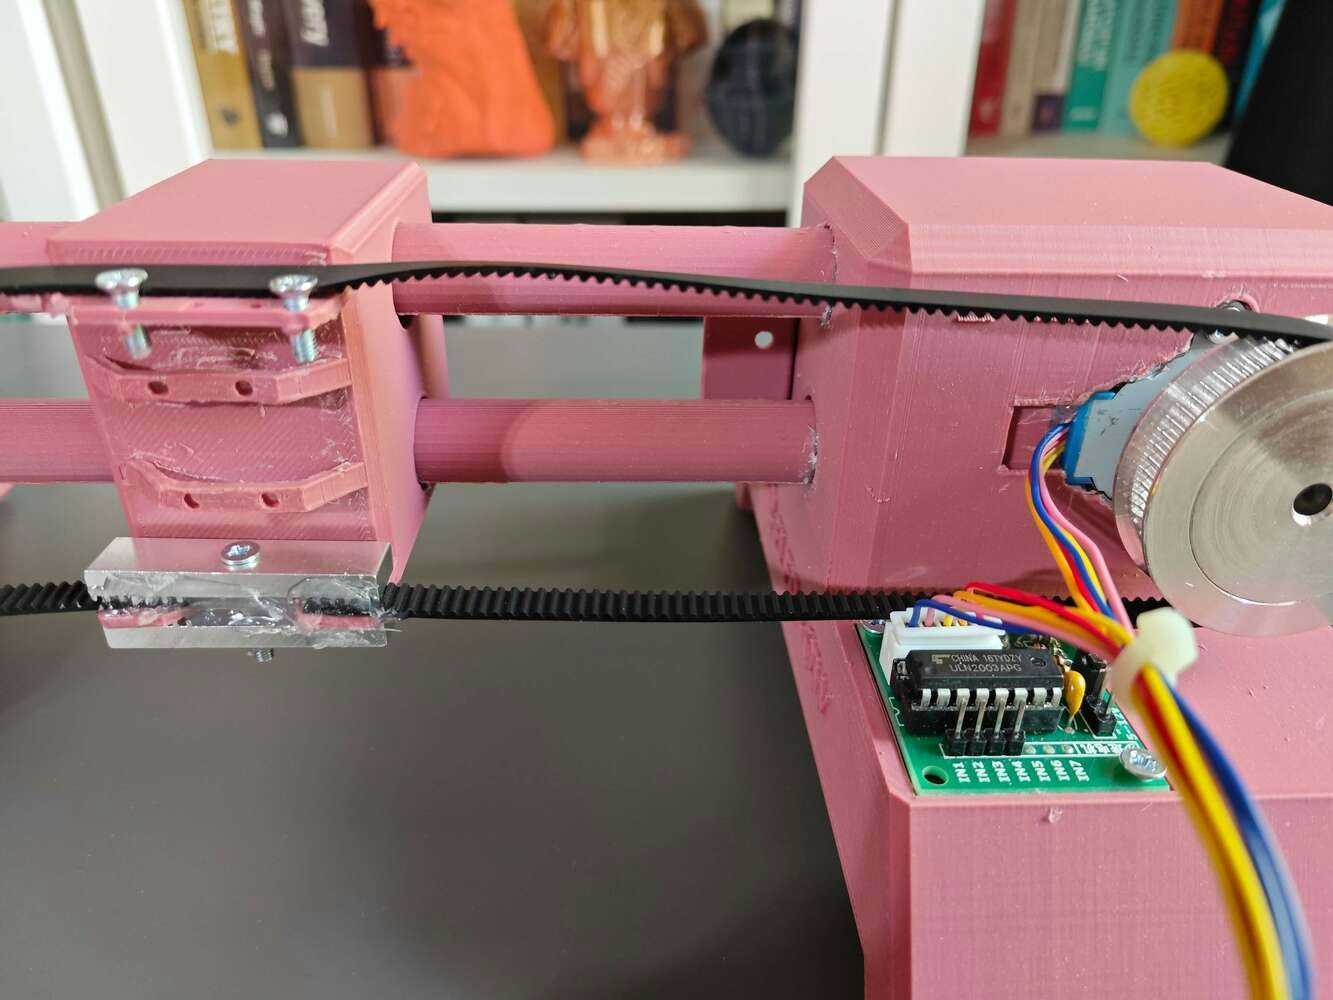
  • the left CNC stand providing slots for the CNC rods, the 28BYJ-48 stepper motor, the ULN2003 driver board, and the micro switch connector,
  • the right CNC stand providing slots for the CNC rods and the GT2 20T pulley pins,
  • the thermal camera container head providing holes to pass CNC rods and slots for the MLX90641 thermal imaging camera, GT2 timing belt, and aluminum gear clamps,
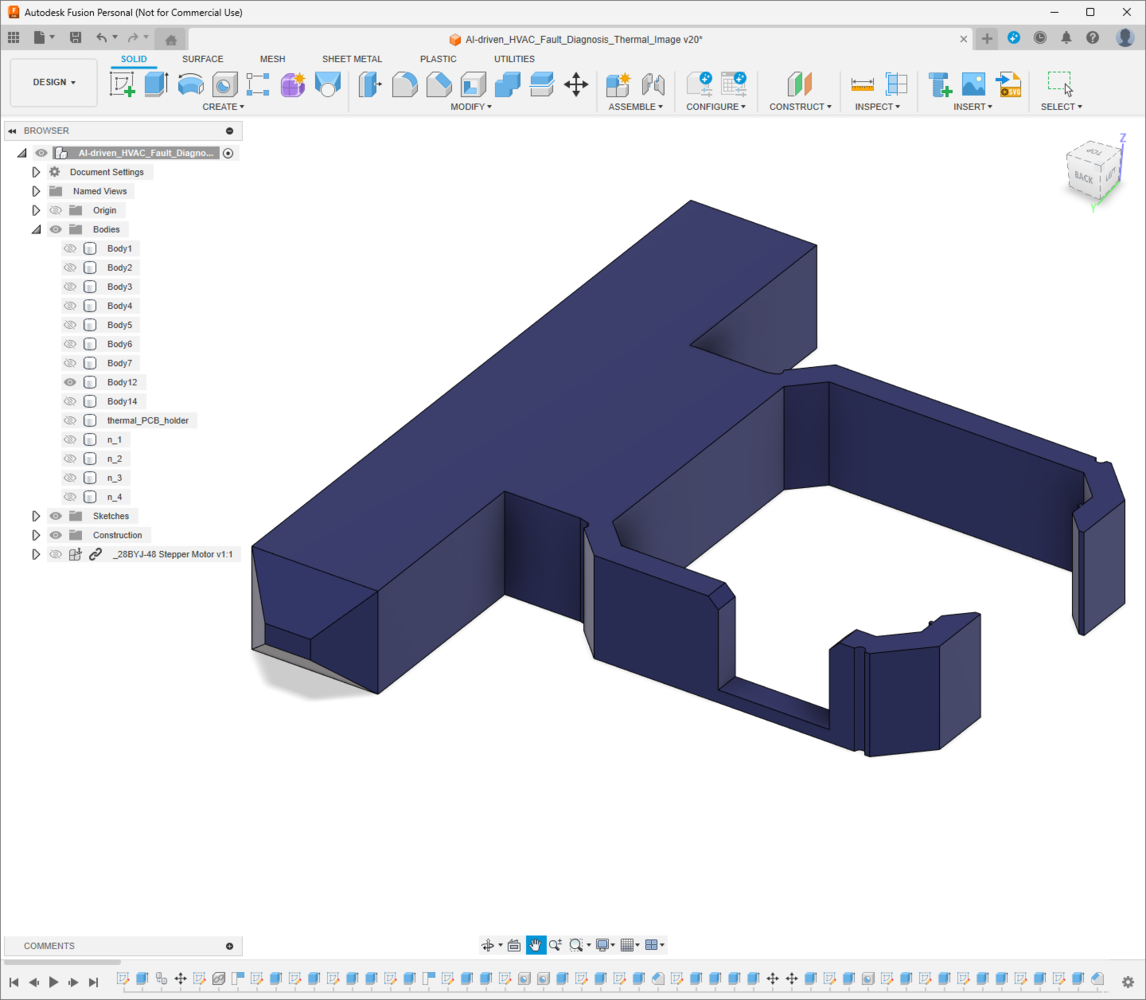
  • the unique PCB encasement derived from the Groudon PCB outline,
  • the PCB encasement connector providing a buckle-shaped joint interlocking with the right CNC stand while preventing any contact with the embedded GT2 20T pulley pins.
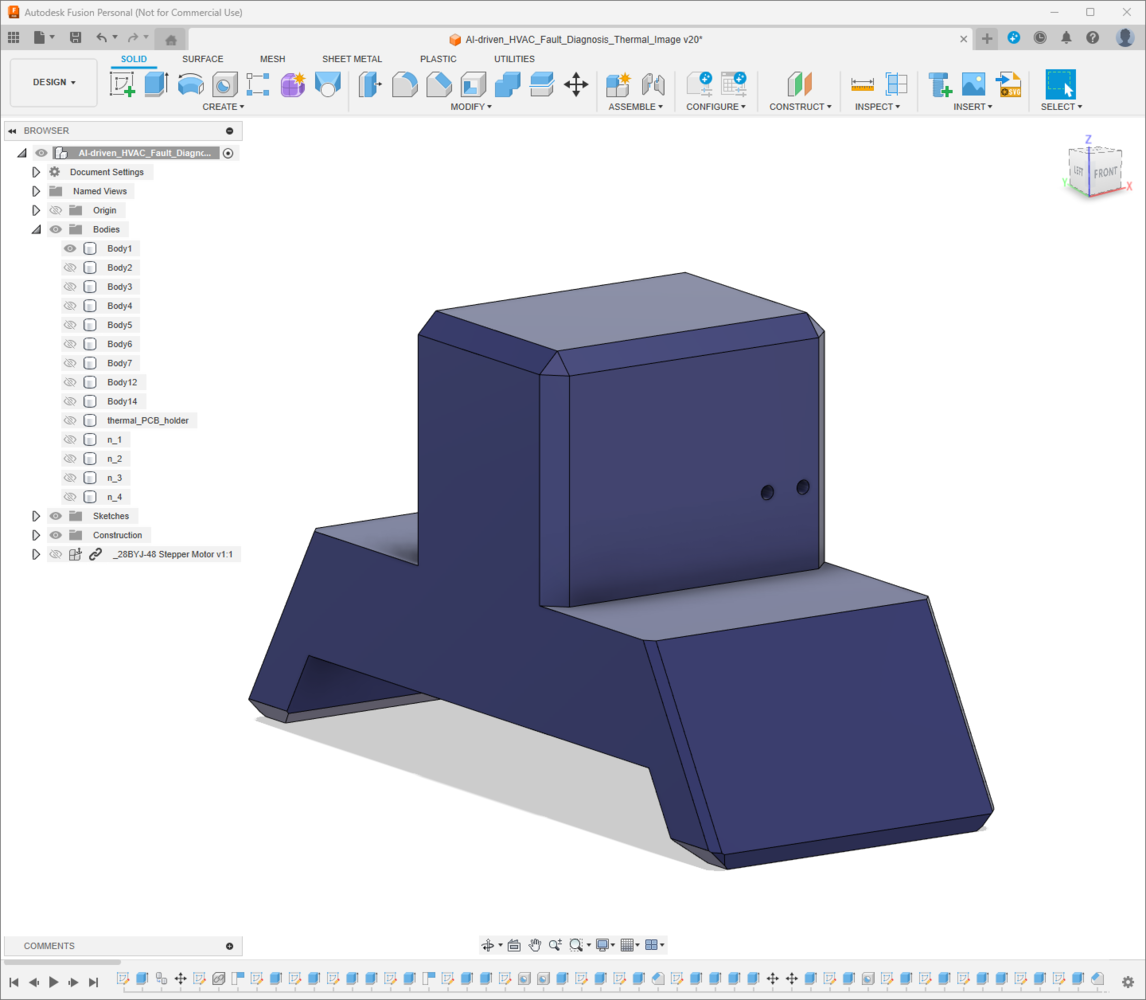
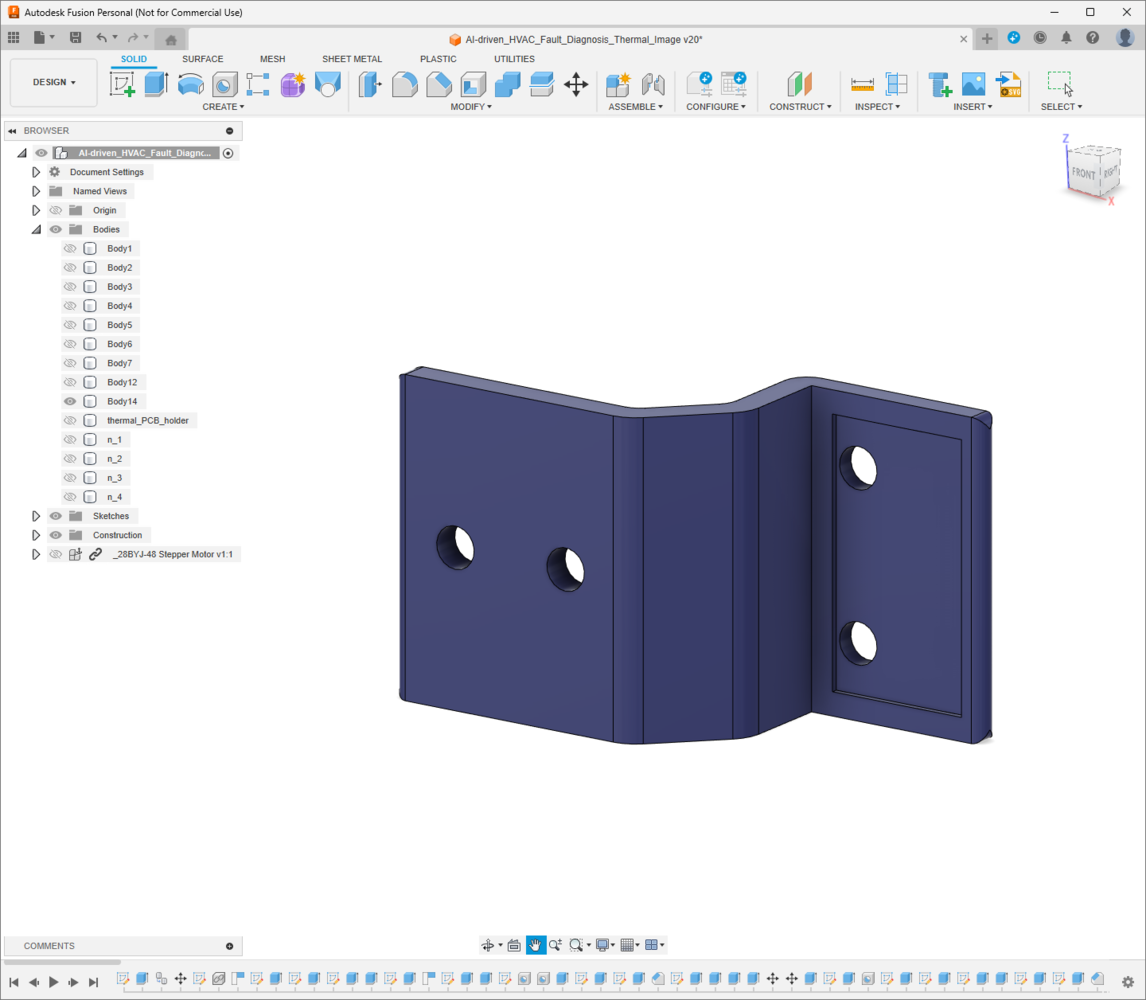
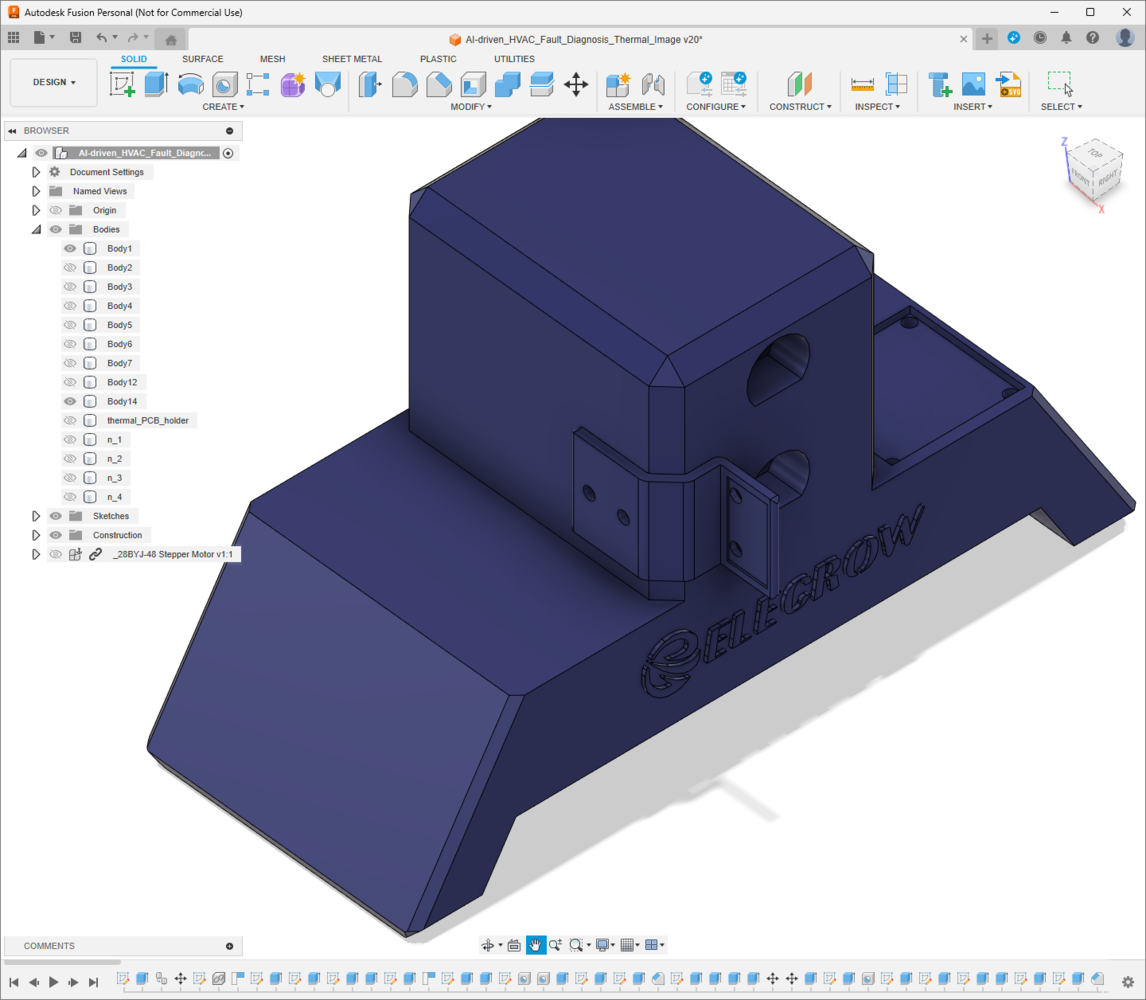
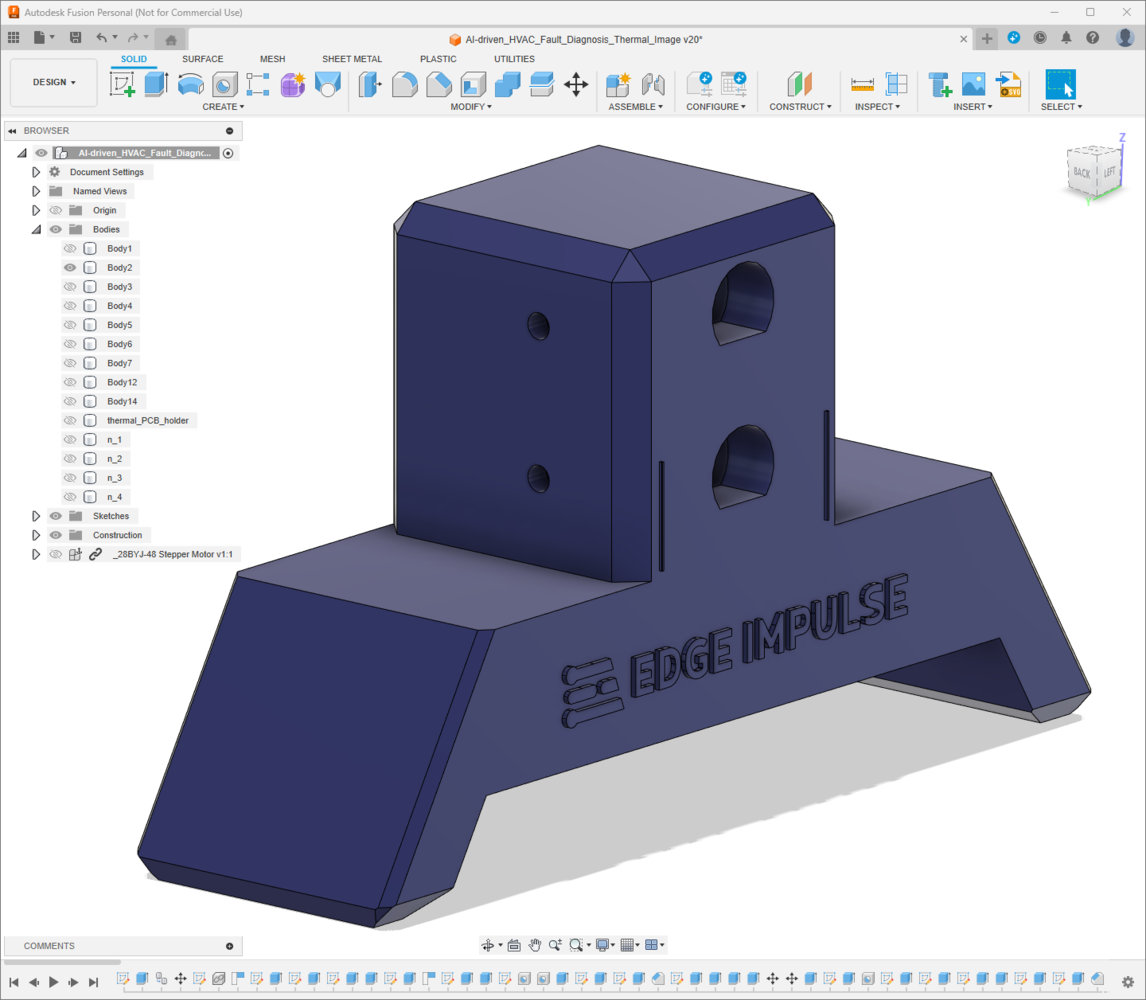
Furthermore, I decided to emboss the Elecrow logo and the Edge Impulse logo on the left and right CNC stands respectively to highlight the qualifications of this segment of the AI-powered HVAC malfunction detection device. I utilized Autodesk Fusion 360 to model all of the mentioned 3D-printable parts and test their clearances to print flawless joints. For further examination, you can download their STL files below.
Fusion 360 angled view of the custom CNC router base with parallel rods

124


Fusion 360 top view of the left CNC stand for the stepper motor

125


Fusion 360 side view of the right CNC stand with pulley supports

126


Fusion 360 close-up of the micro switch connector bracket

127


Fusion 360 fit-check view of the GT2 pulley pin detail

128


Fusion 360 mounted view of the thermal camera container head

129


Fusion 360 rear view of the camera head sliding on both rods

130


Fusion 360 exploded view of the MLX90641 holder opening in the carriage

131


Fusion 360 detail view of the timing belt path through the camera head

132


Fusion 360 front view of the aluminum gear clamp locations

133


Fusion 360 angled view of the Groudon PCB encasement outline

134


Fusion 360 top view of the PCB connector for the CNC stand

135


Fusion 360 side view of the stepper motor mount and ULN2003 slot

136


Fusion 360 close-up of the CNC rods passing through the left stand

137


Fusion 360 fit-check view of the camera head with pulley hardware installed

138


Fusion 360 mounted view of the right stand and pulley clearance

139


Fusion 360 rear view of the belt clamp alignment on the moving head

140


Fusion 360 exploded view of the home switch location near the carriage

141


Fusion 360 detail view of the CNC router assembled without wiring

142


Fusion 360 front view of the Groudon PCB case beside the CNC frame

143


Fusion 360 angled view of the snap-fit joint between case and stand

144

After designing 3D models and exporting them as STL files, I sliced the exported models in PrusaSlicer, which provides lots of groundbreaking features such as paint-on supports and height range modifiers.
Fusion 360 top view of the thermal camera facing the aluminum blocks

145


Fusion 360 side view of the carriage travel span across the rods

146


Fusion 360 close-up of the full CNC router from the front

147


Fusion 360 fit-check view of the completed CNC frame from above

148


Fusion 360 mounted view of the screw hole layout for the printed stands

149


Fusion 360 rear view of the pulley and timing belt fit check

150


Fusion 360 exploded view of the sliding camera head centered on the rails

151


Fusion 360 detail view of the final camera positioning mechanism

152


Fusion 360 front view of the completed Groudon CNC CAD assembly

153


Fusion 360 angled view of the full thermal-side model ready for printing

154

Since I wanted to apply a unique industrial theme representing vivid industrial processes, I utilized this PLA filament contrasting with the previous filament color:
  • ePLA-Matte Morandi Purple
Finally, I printed all of the mentioned models with my Anycubic Kobra 2 3D Printer.
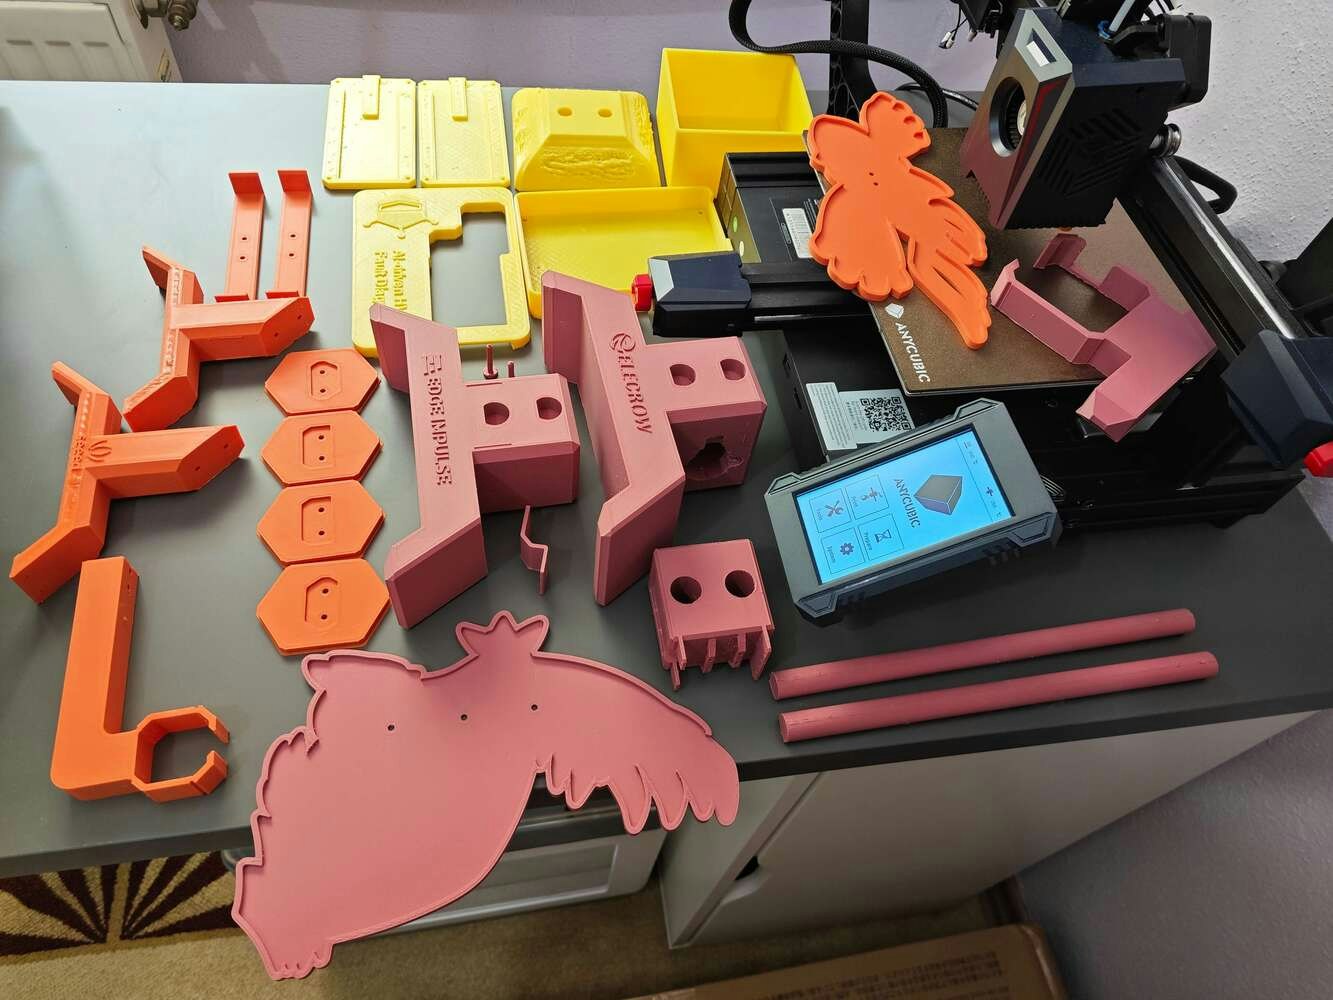
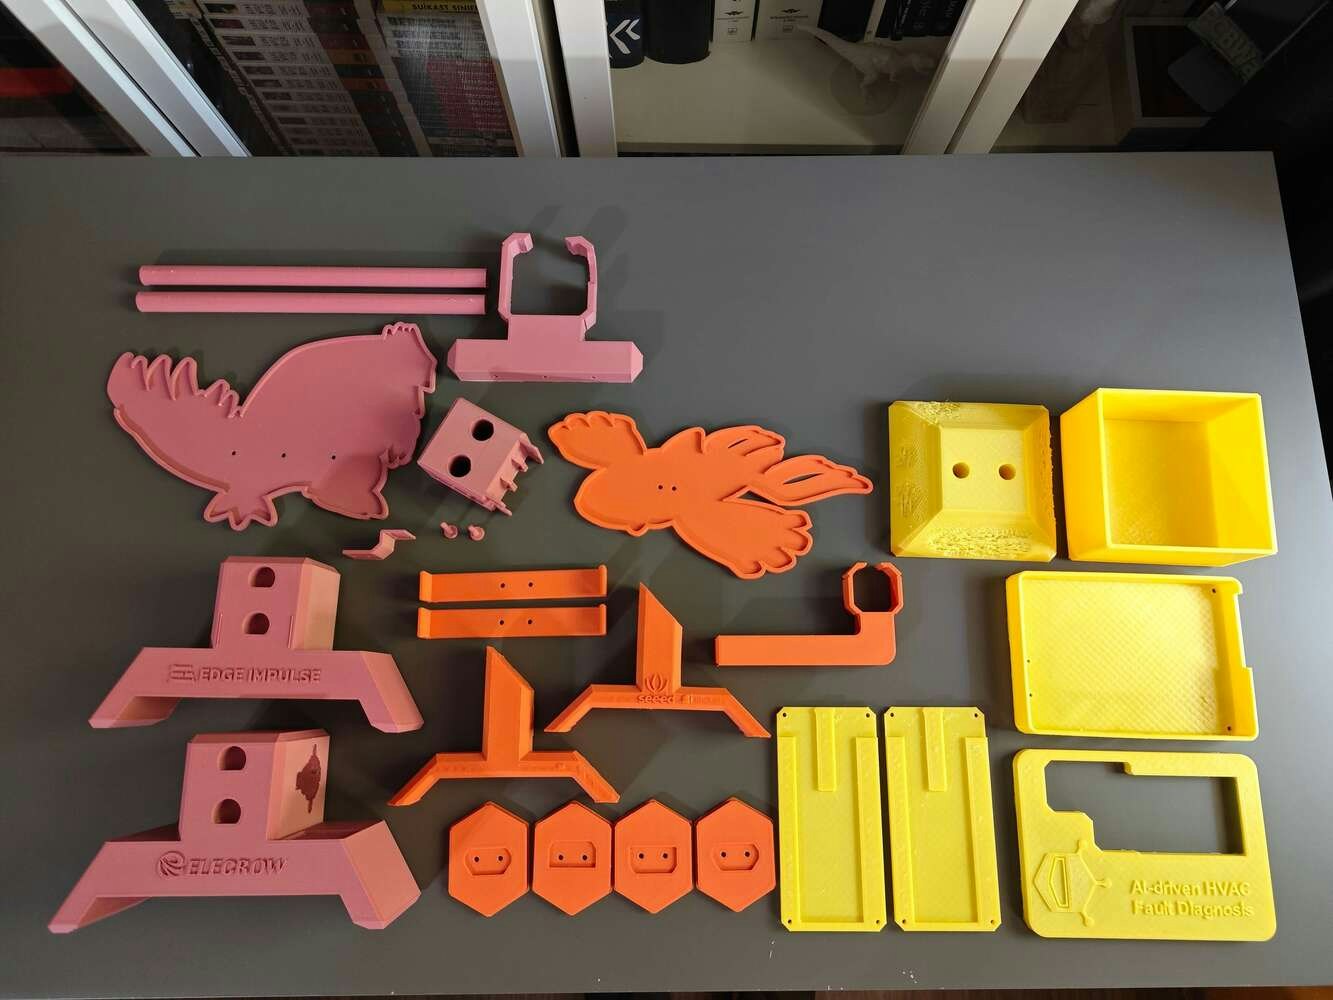
Freshly printed pink CNC router and Groudon enclosure parts arranged before assembly

155

Step 2.b.1: Assembling the 3D-printed components

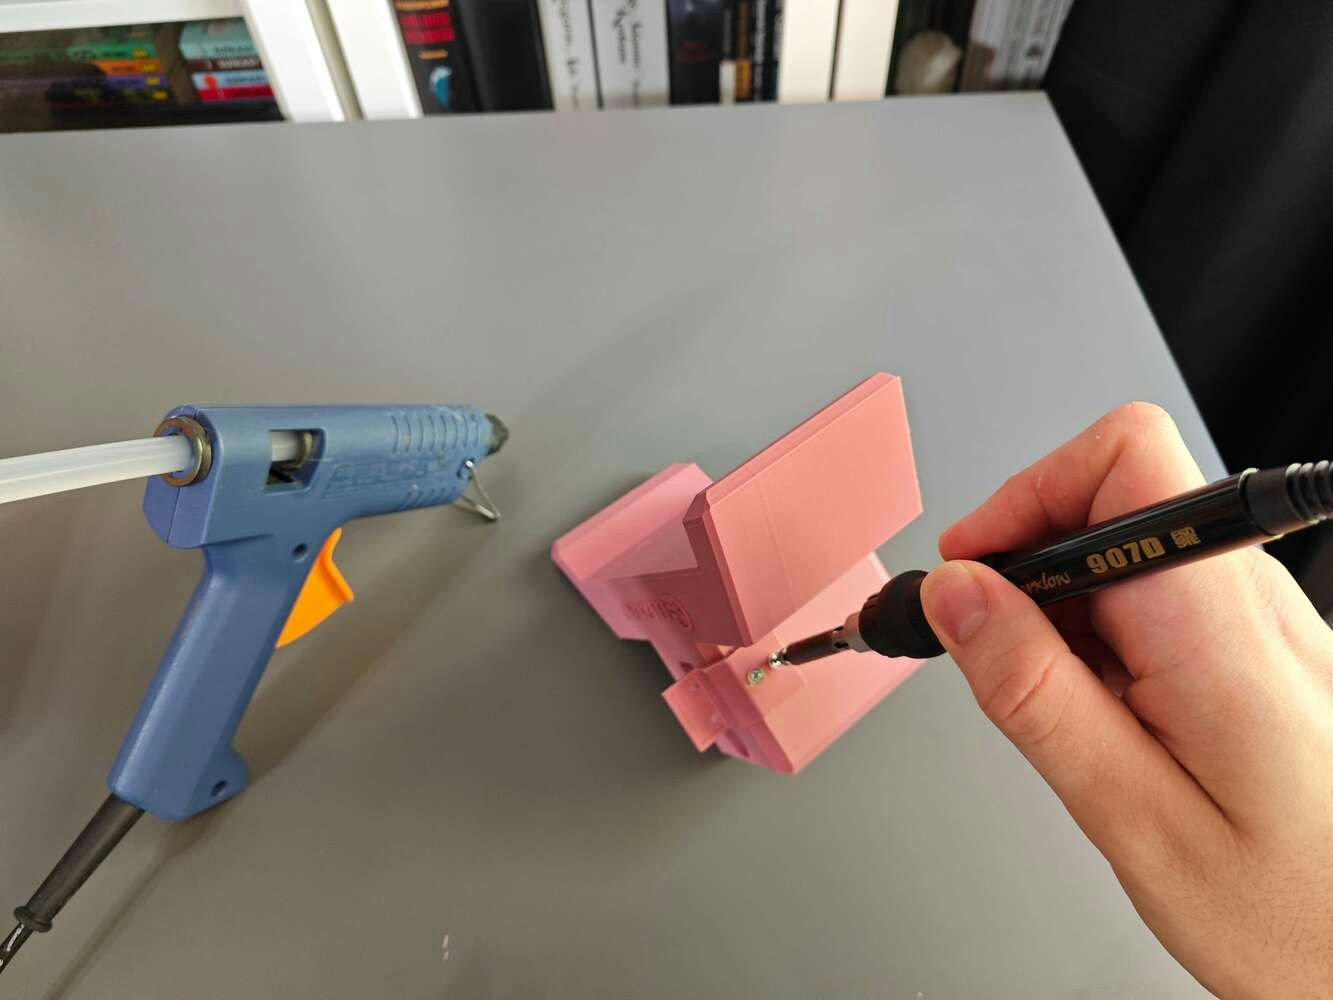
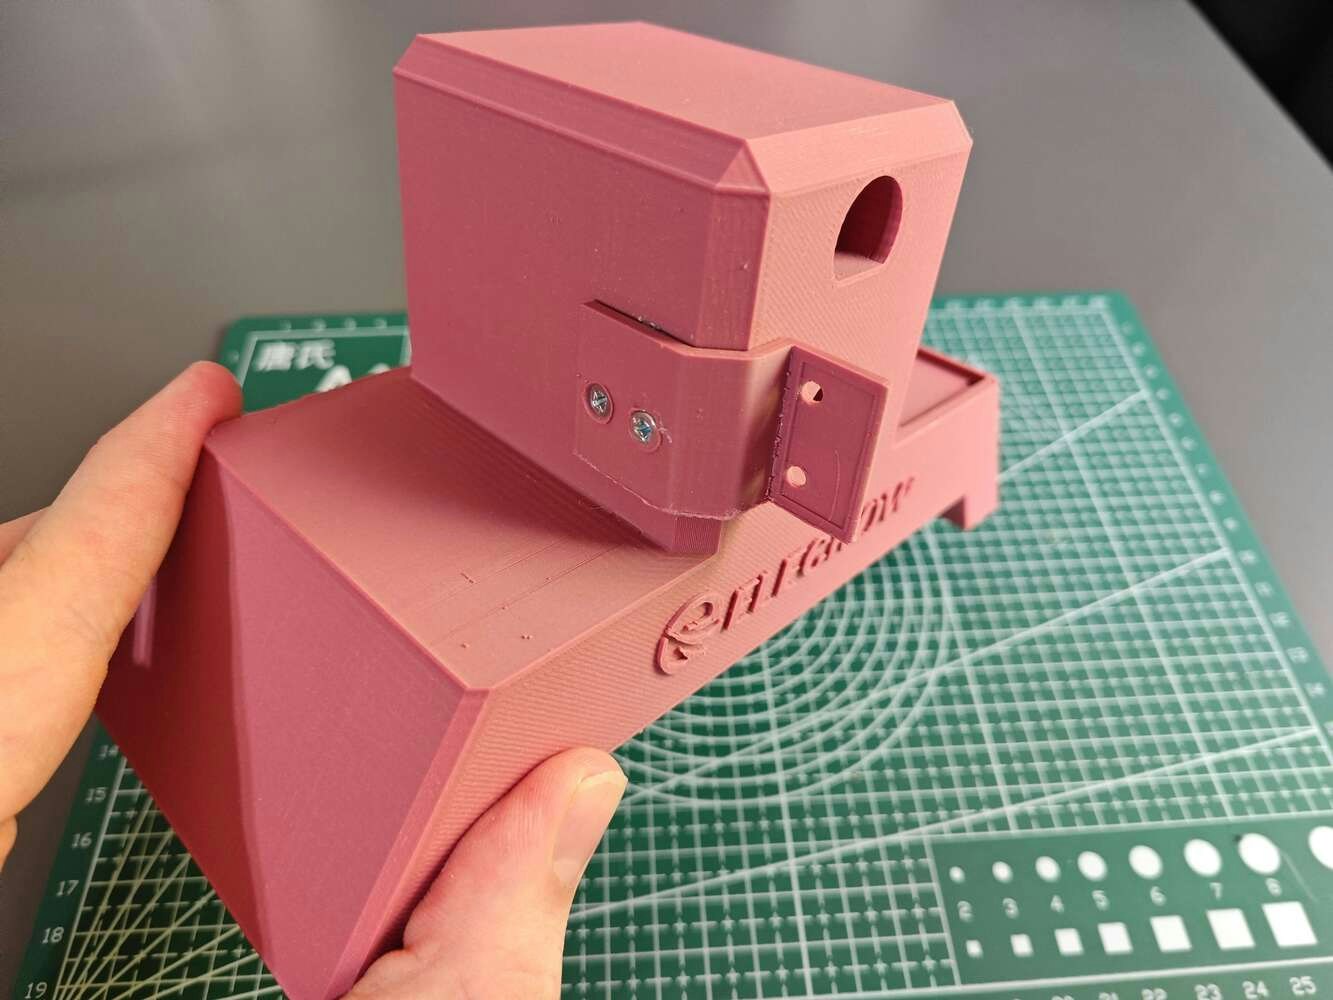
After printing all 3D models related to the custom CNC router, I started to combine the CNC parts via M3 screws through the assembly-ready screw holes and the provided slots for the associated parts. Then, I fastened the unique Groudon PCB encasement to the complementary PCB connector via M3 screws. Since the PCB connector is compatible with the right CNC stand via its buckle-shaped snap-fit joint and avoids any contact with the GT2 20T pulley pins, I was able to interlock the PCB connector with the right CNC stand effortlessly. Although I applied hot glue between parts while affixing them via M3 screws, it was still not enough to build a production-ready device, especially for a constantly moving CNC router. Thus, I employed a well-known injection molding technique to make the connections more sturdy. In this technique, a heat press mechanism is generally utilized to add threaded brass inserts between 3D-printed parts to connect them firmly. In my version, I simply used a soldering iron to embed M3 screws directly into the assembly-ready holes instead of threaded inserts to fasten the parts together.
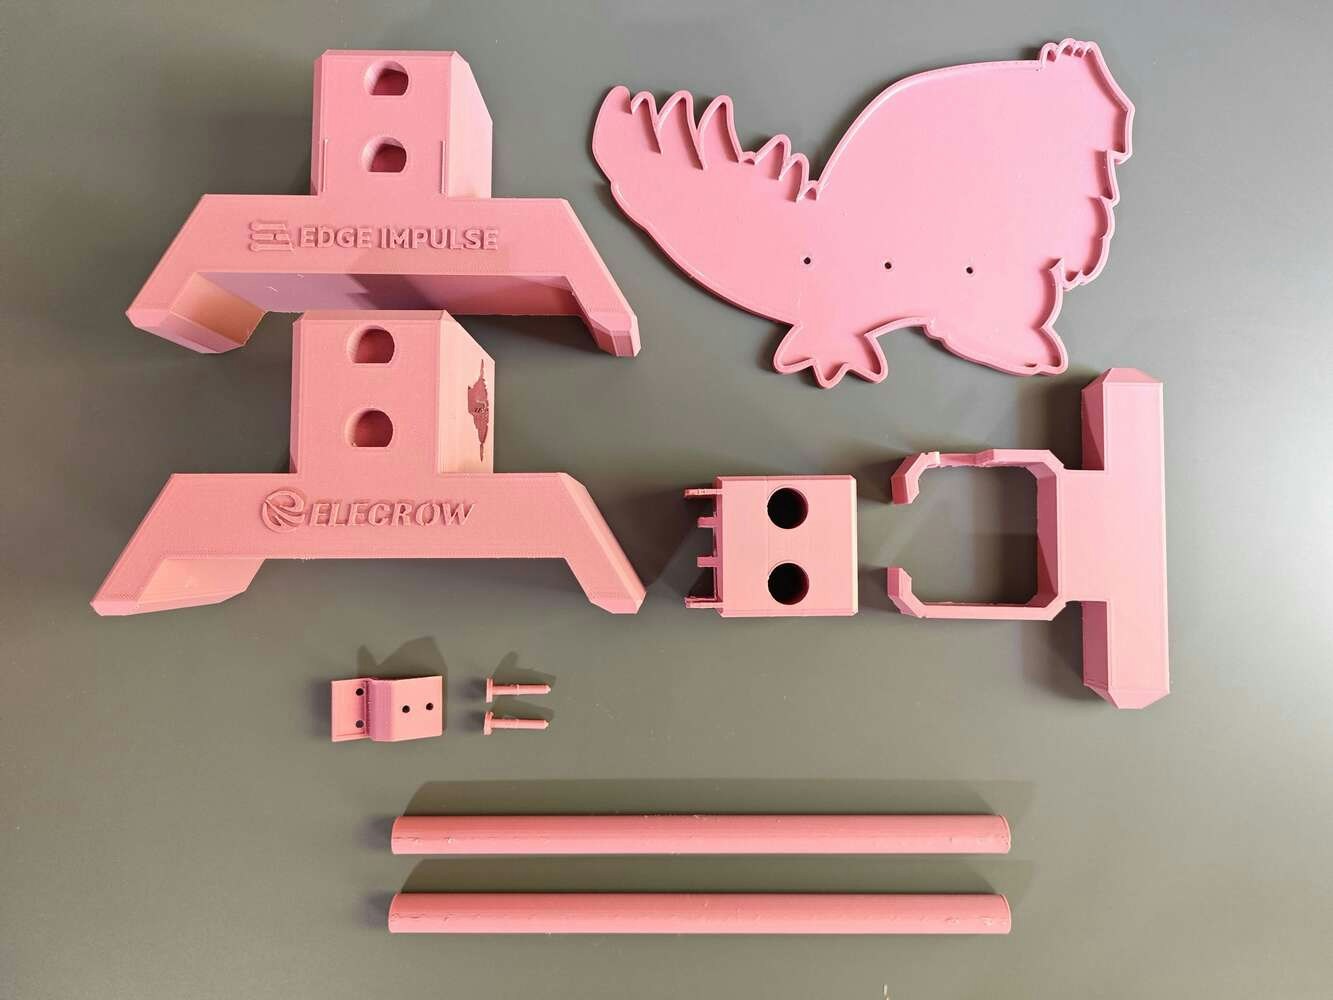
Groudon CNC router assembly step 1, aligning parts from an angled view with the pink thermal camera carriage

156


Groudon CNC router assembly step 2, fastening parts in a top view with the pink thermal camera carriage

157


Groudon CNC router assembly step 3, mounting parts in a side view with the pink thermal camera carriage

158


Groudon CNC router assembly step 4, routing parts in a close-up with the pink thermal camera carriage

159


Groudon CNC router assembly step 5, checking parts in a fit-check view with the pink thermal camera carriage

160


Groudon CNC router assembly step 6, reinforcing parts in a mounted view with the pink thermal camera carriage

161


Groudon CNC router assembly step 7, seating parts in a rear view with the pink thermal camera carriage

162


Groudon CNC router assembly step 8, joining parts in an exploded view with the pink thermal camera carriage

163


Groudon CNC router assembly step 9, finishing parts in a detail view with the pink thermal camera carriage

164


Groudon CNC router assembly step 10, positioning parts in a front view with the pink thermal camera carriage

165


Groudon CNC router assembly step 11, aligning parts from an angled view with the pink thermal camera carriage

166


Groudon CNC router assembly step 12, fastening parts in a top view with the pink thermal camera carriage

167


Groudon CNC router assembly step 13, mounting parts in a side view with the pink thermal camera carriage

168


Groudon CNC router assembly step 14, routing parts in a close-up with the pink thermal camera carriage

169


Groudon CNC router assembly step 15, checking parts in a fit-check view with the pink thermal camera carriage

170

As discussed earlier, I employed the soldering iron to embed M3 screws directly into the assembly-ready holes to affix parts tightly. For the parts with provided slots, I utilized the hot glue gun to reinforce the connections.
Groudon CNC router assembly step 16, reinforcing parts in a mounted view with epoxy reinforcing the printed joints in the pink thermal camera carriage

171


Groudon CNC router assembly step 17, seating parts in a rear view with the pink thermal camera carriage

172


Groudon CNC router assembly step 18, joining parts in an exploded view with the pink thermal camera carriage

173


Groudon CNC router assembly step 19, finishing parts in a detail view with the pink thermal camera carriage

174

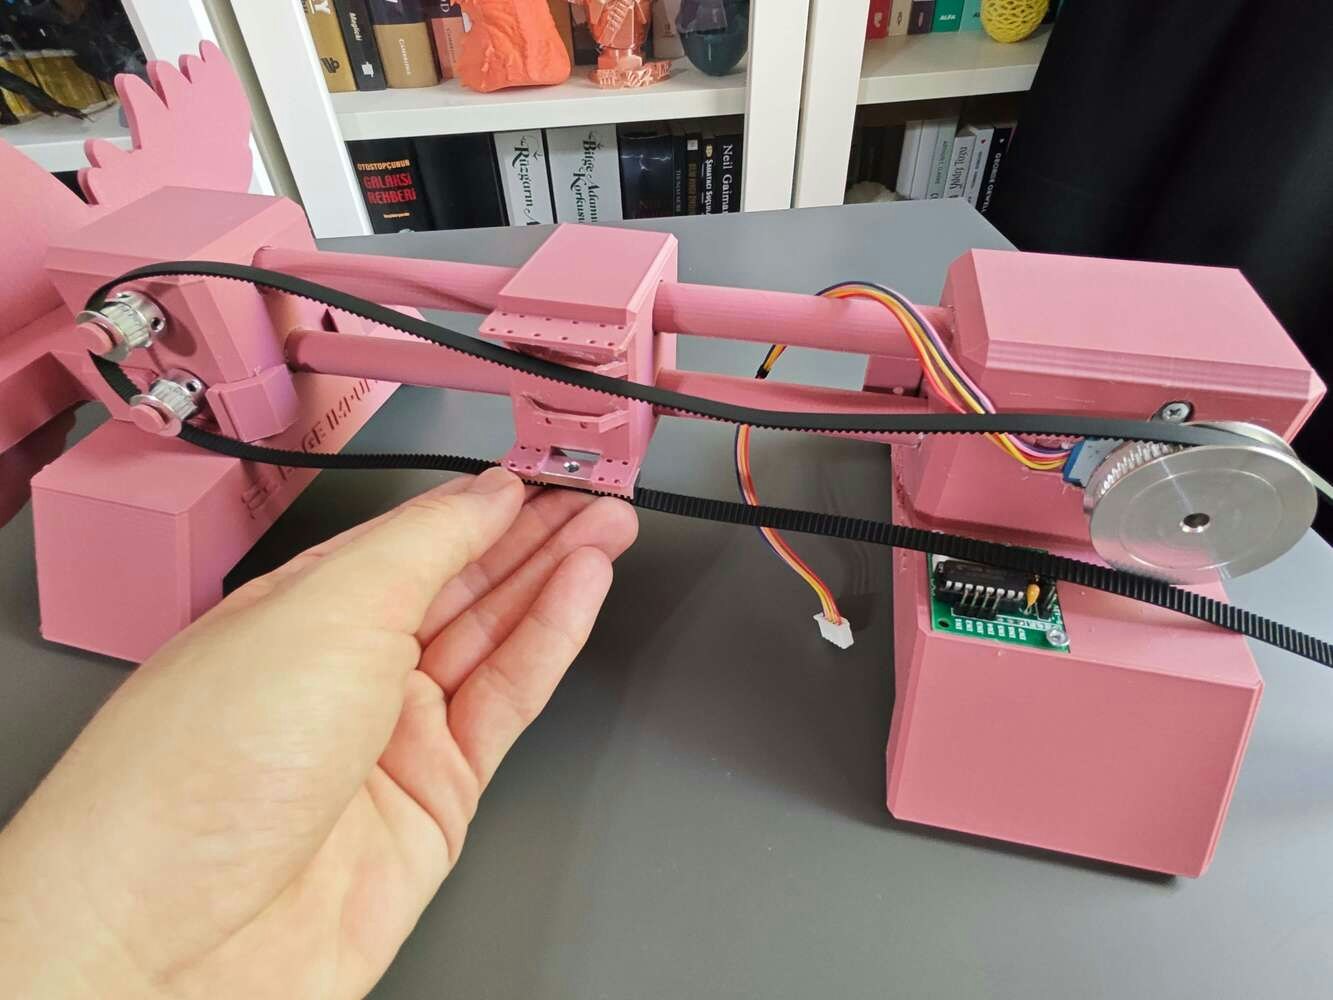
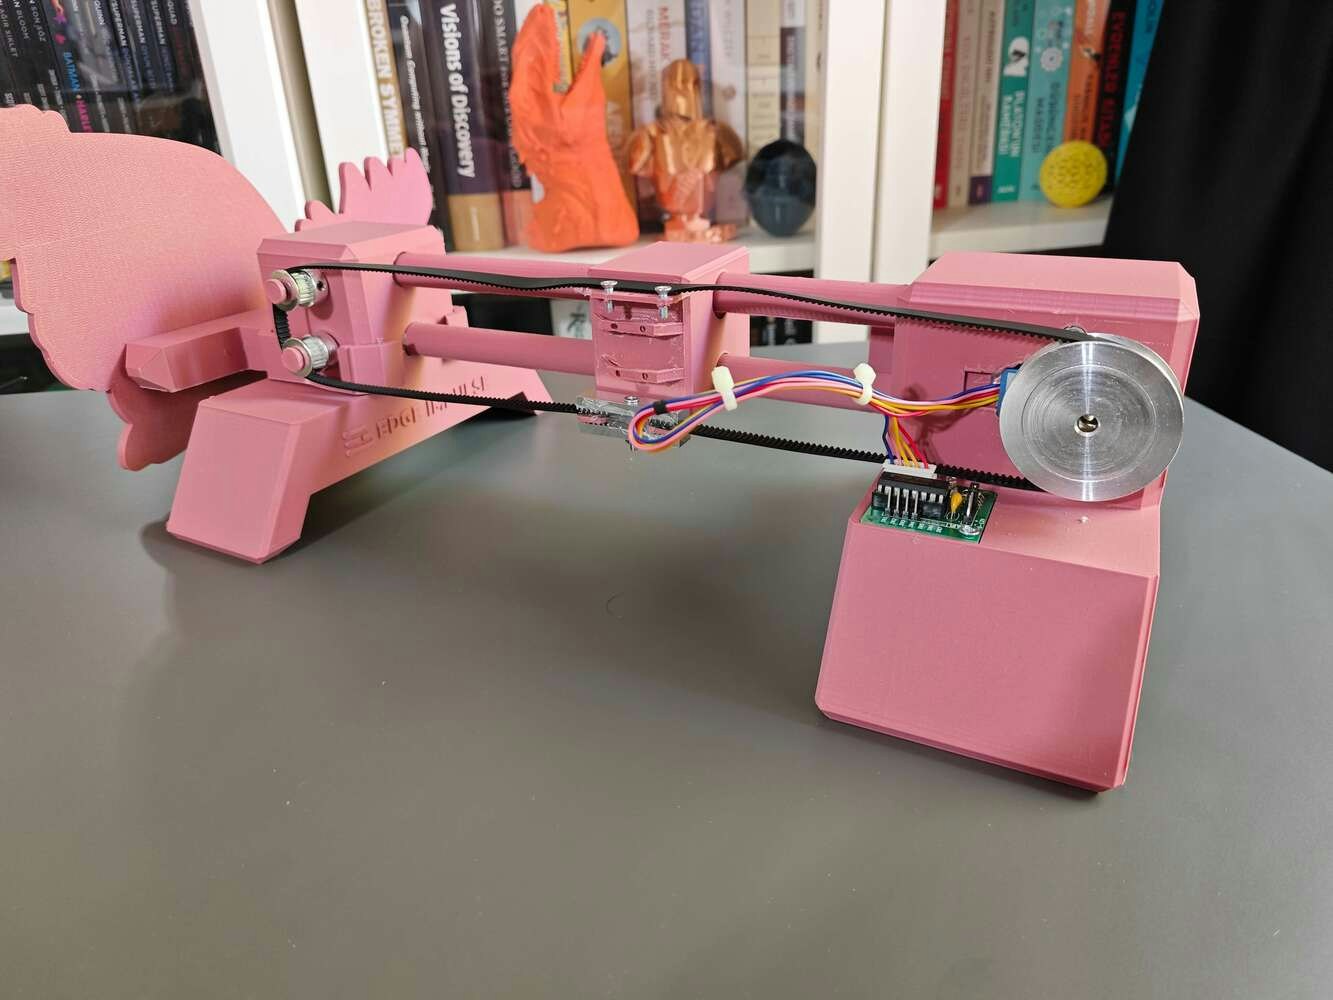
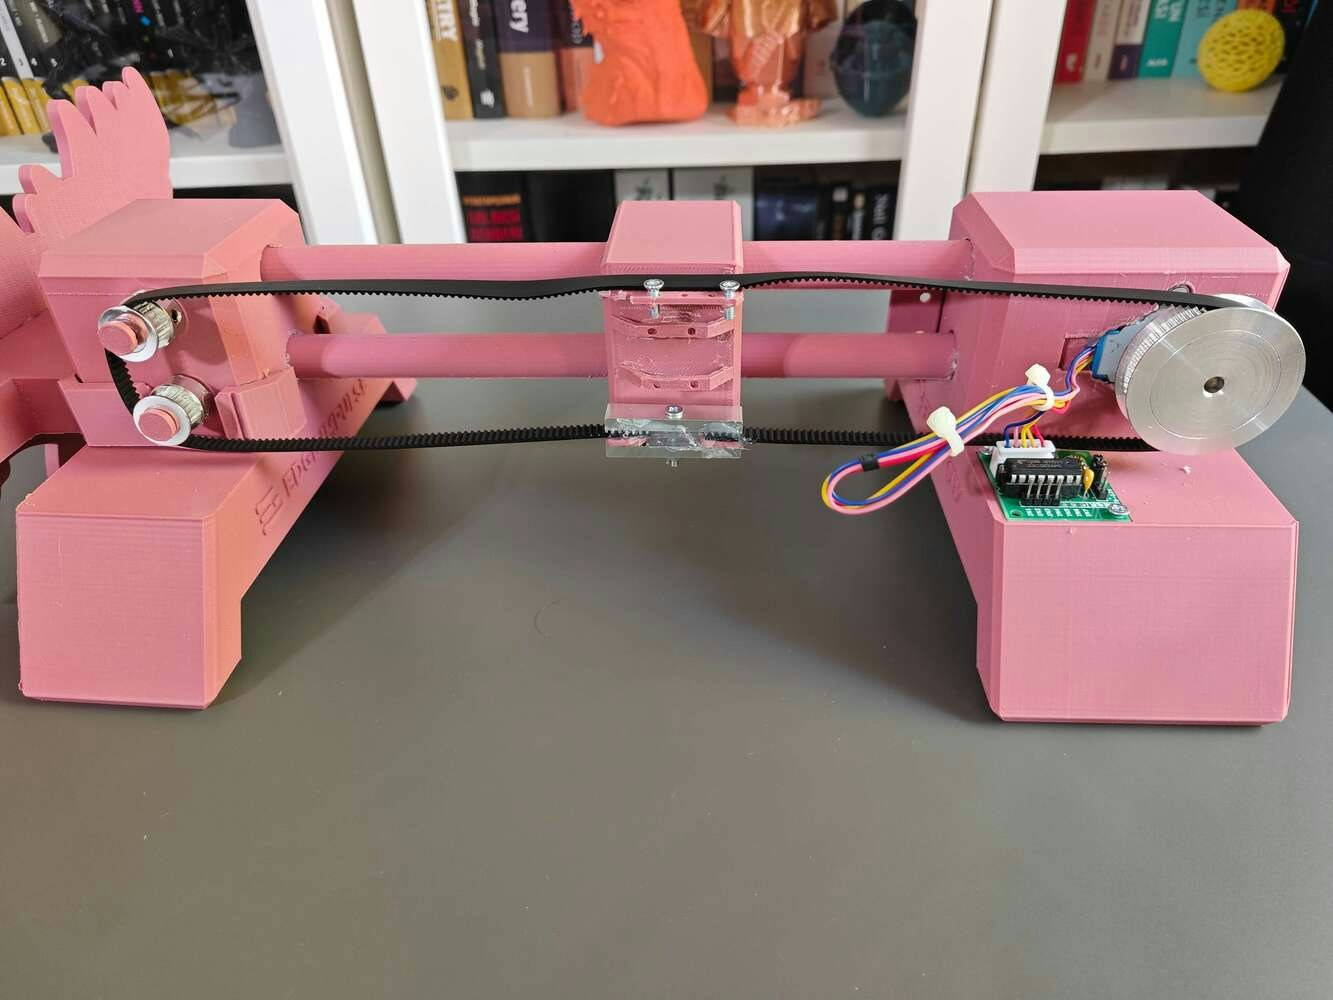
Before finalizing all slot connections via the hot glue gun, I started to work on building the positioning mechanism of the CNC router by integrating these mechanical components into their corresponding slots:
  • a 28BYJ-48 stepper motor,
  • a ULN2003 driver board,
  • a GT2 60T pulley attached to the stepper motor,
  • two GT2 20T pulleys attached to the special pulley pins,
  • GT2 6 mm timing belt,
  • two GT2 aluminum gear clamps.
After affixing the timing belt via the gear clamps, I utilized two M3 screws to adjust the tightness of the timing belt.
Groudon CNC router assembly step 20, positioning parts in a front view on the pink CNC router carriage

175


Groudon CNC router assembly step 21, aligning parts from an angled view on the pink CNC router carriage

176


Groudon CNC router assembly step 22, fastening parts in a top view on the pink CNC router carriage

177


Groudon CNC router assembly step 23, mounting parts in a side view on the pink CNC router carriage

178


Groudon CNC router assembly step 24, routing parts in a close-up on the pink CNC router carriage

179


Groudon CNC router assembly step 25, checking parts in a fit-check view on the pink CNC router carriage

180


Groudon CNC router assembly step 26, reinforcing parts in a mounted view on the pink CNC router carriage

181


Groudon CNC router assembly step 27, seating parts in a rear view on the pink CNC router carriage

182


Groudon CNC router assembly step 28, joining parts in an exploded view on the pink CNC router carriage

183


Groudon CNC router assembly step 29, finishing parts in a detail view on the pink CNC router carriage

184


Groudon CNC router assembly step 30, positioning parts in a front view on the pink CNC router carriage

185

Step 2.c: Designing and printing the water-cooled HVAC system accessories

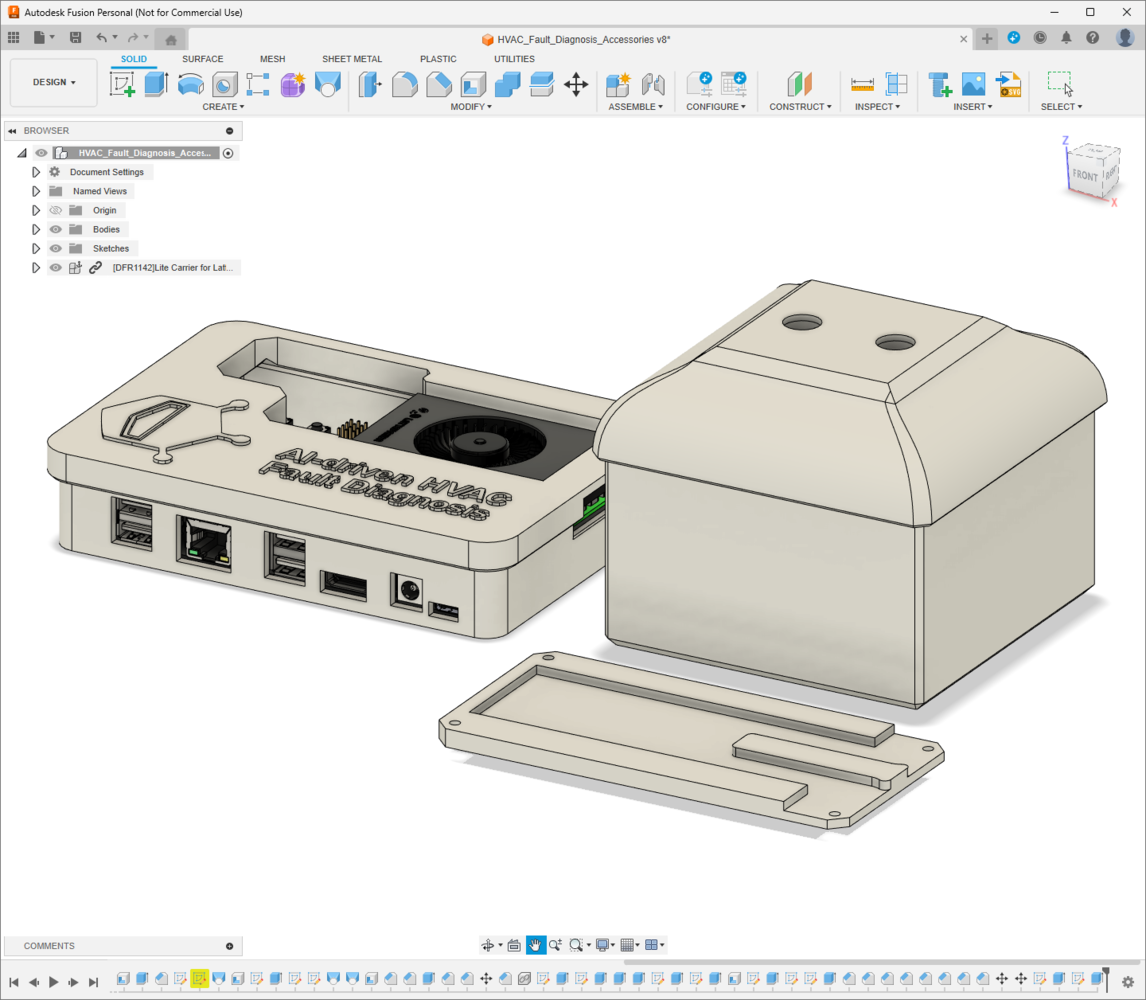
After modeling the 3D parts related to the custom CNC router, I realized that my overall design was still lacking some of the features I wanted to implement to build an industrial-level HVAC malfunction detection device, such as an impervious custom reservoir for the simplified water cooling system. Thus, I designed these additional parts:
  • an aluminum cooling block holder allowing plastic tubing adjustment,
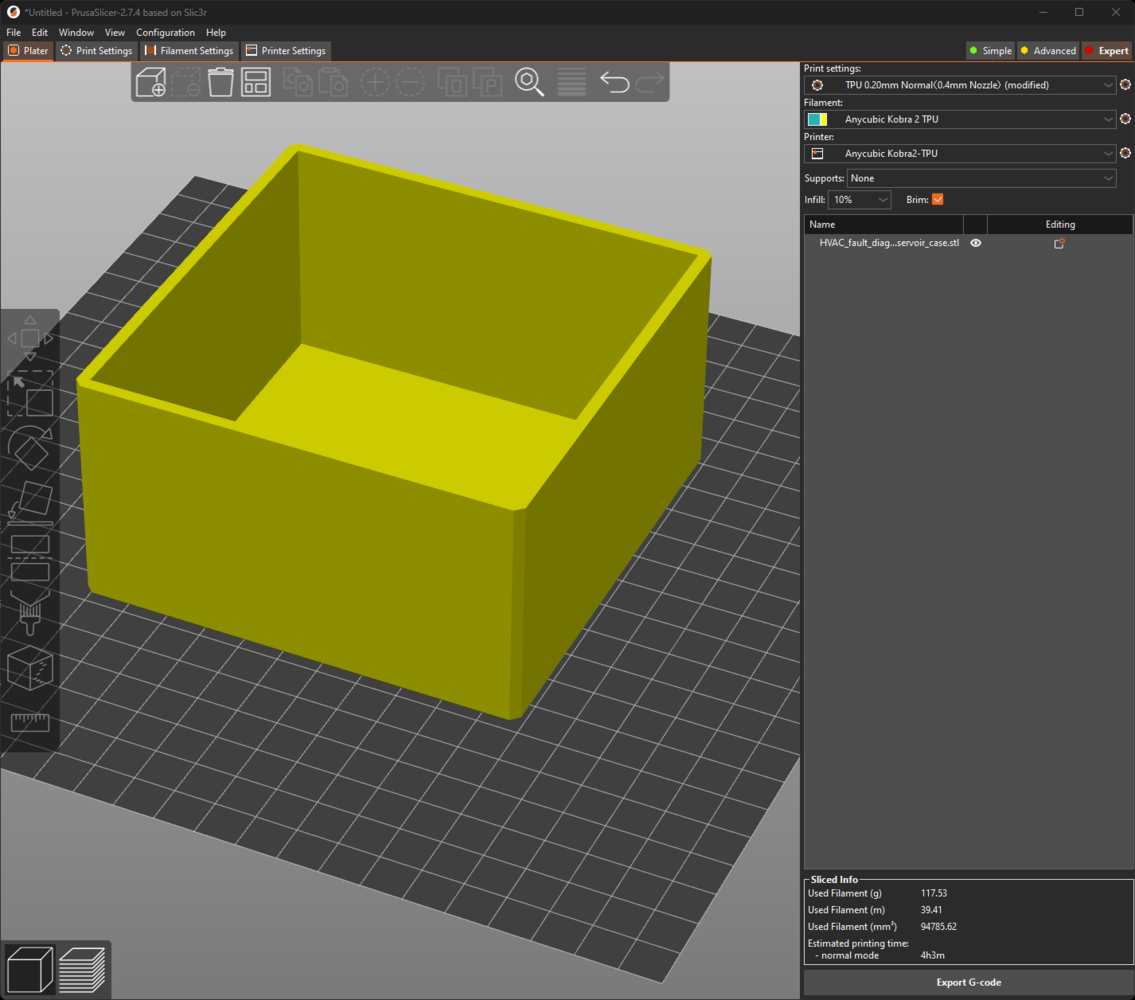
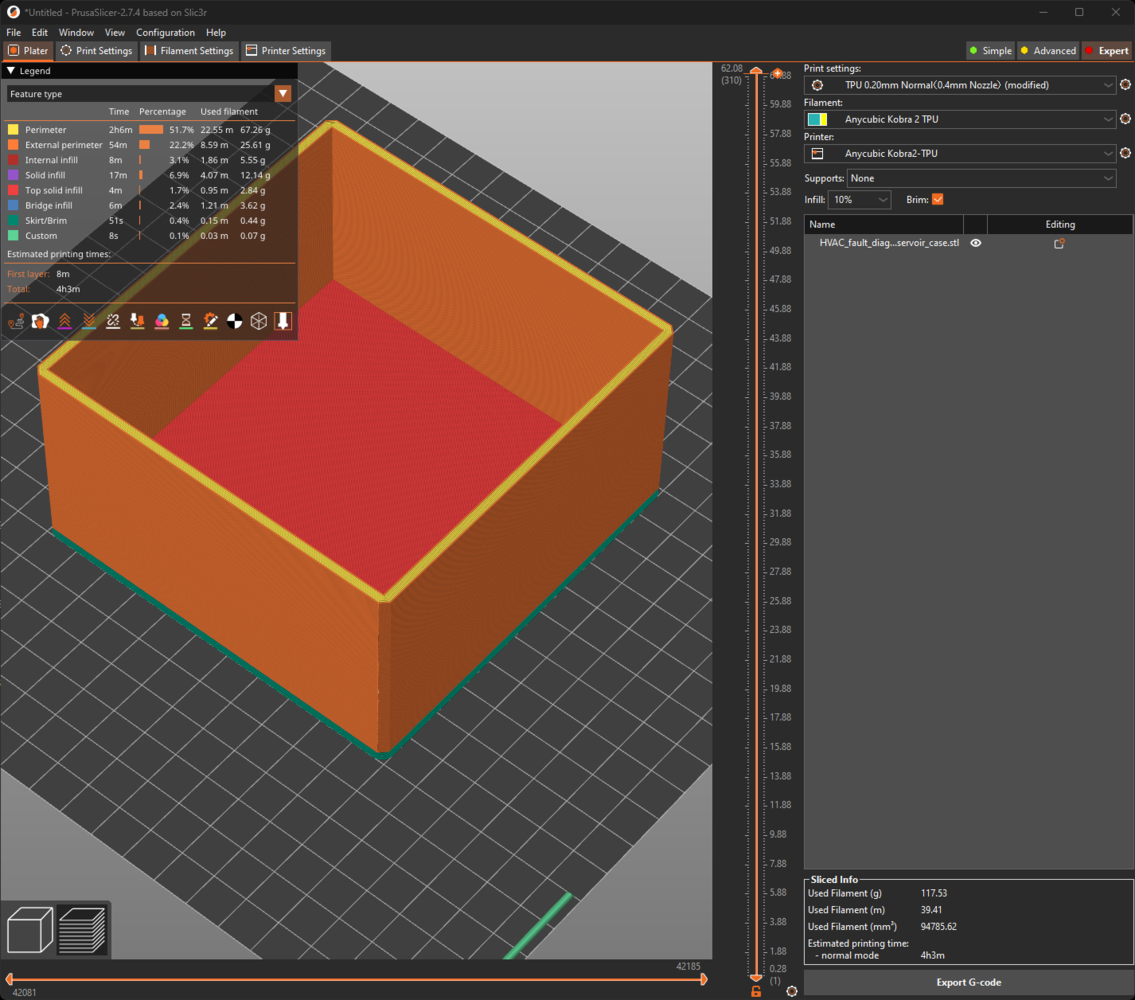
  • an impermeable water reservoir compatible with the water cooling pump,
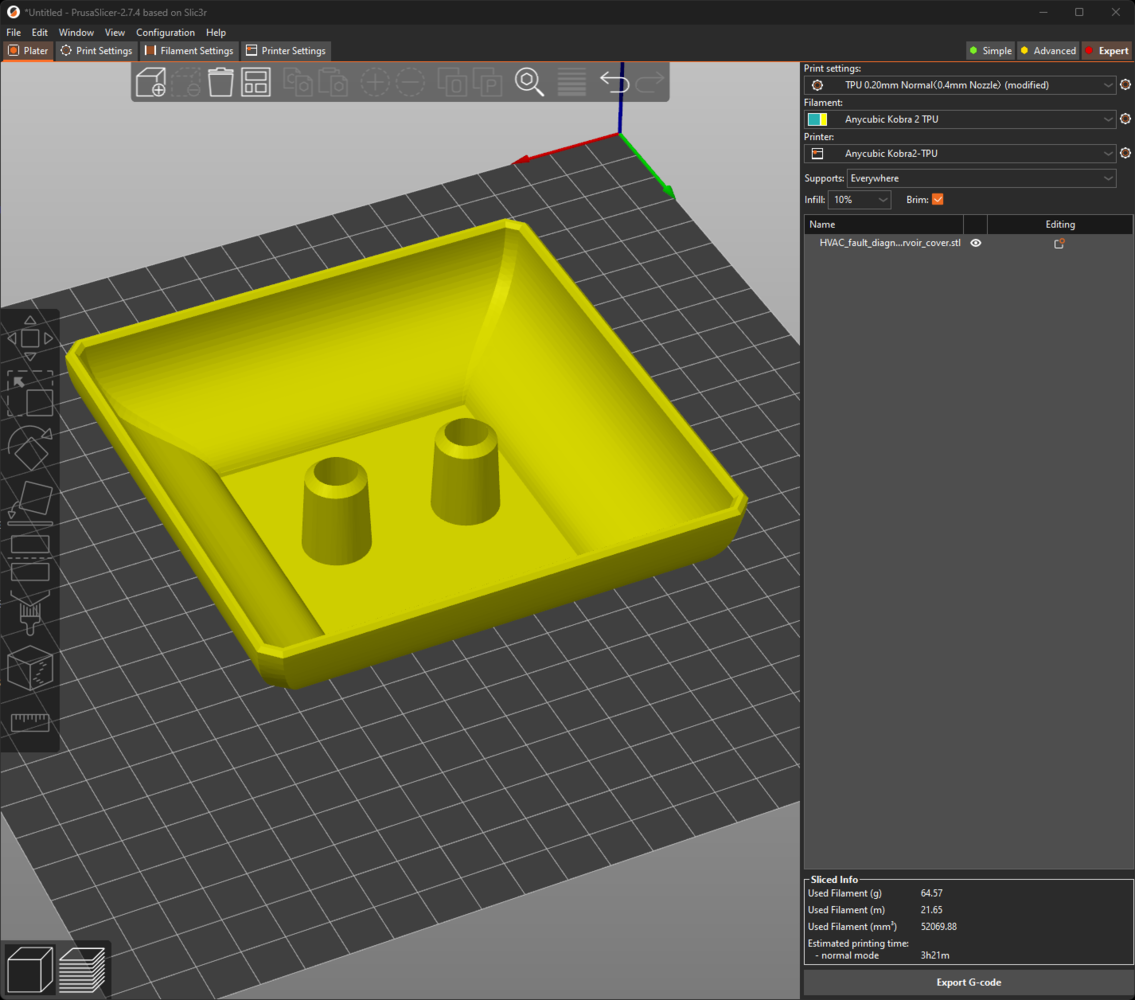
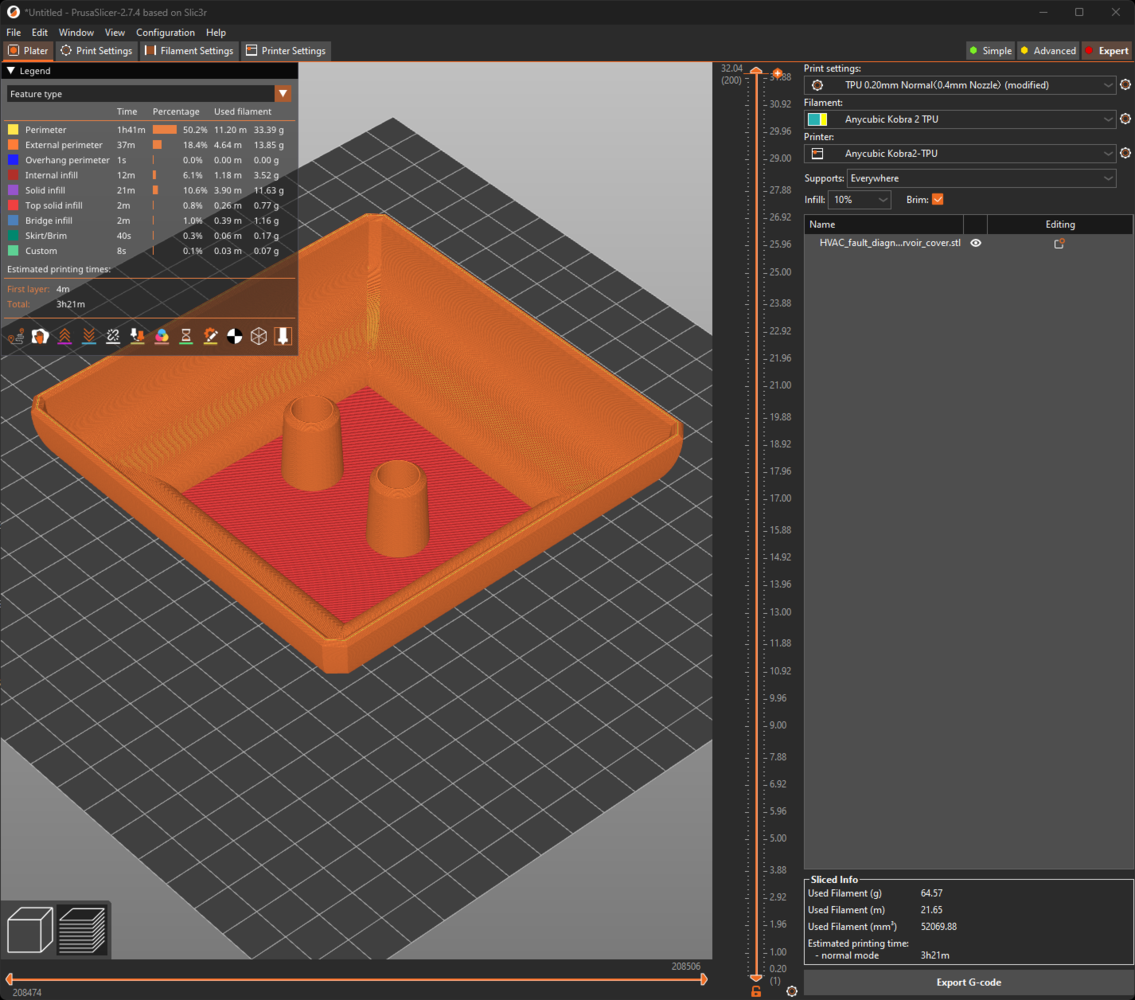
  • a removable top cover for the reservoir with built-in plastic tubing fittings (IN and OUT),
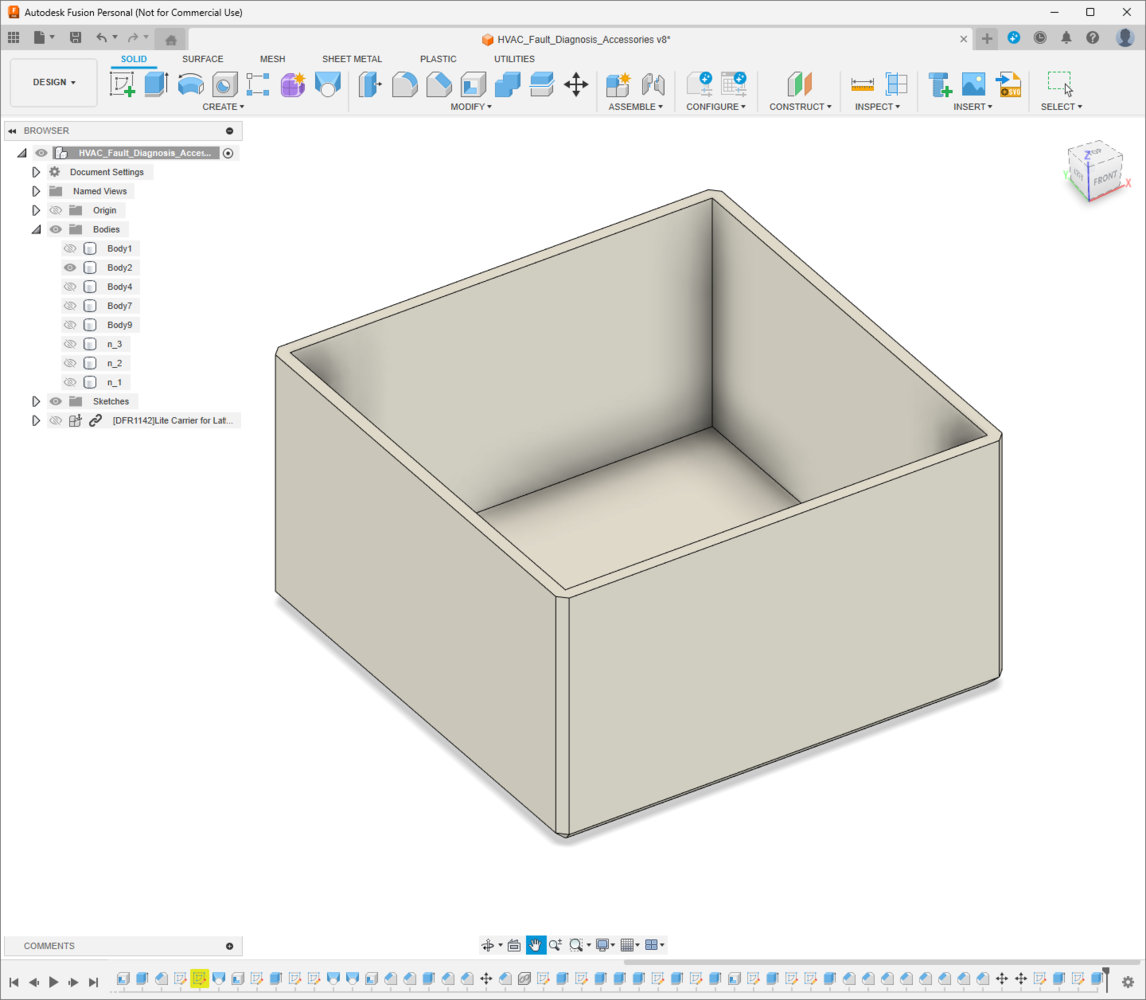
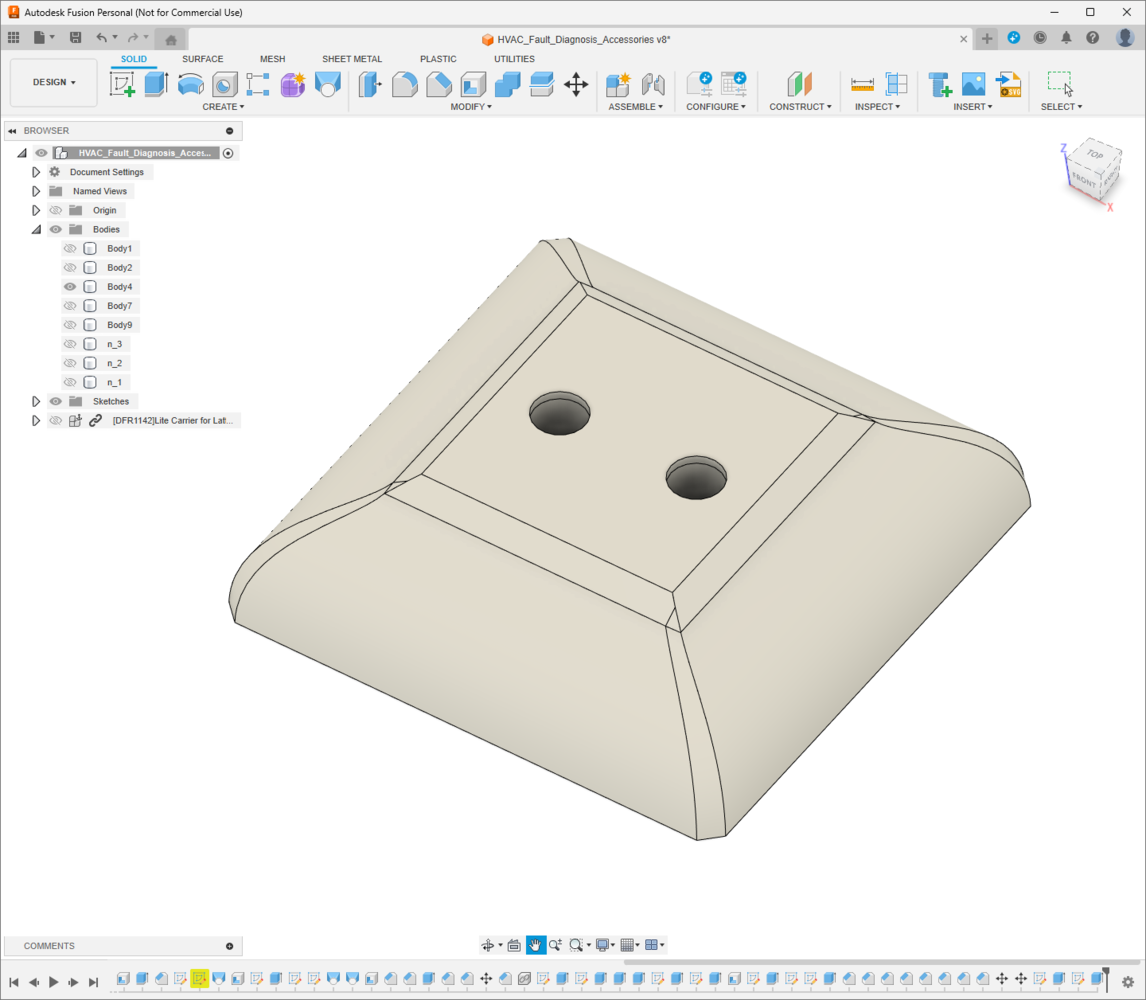
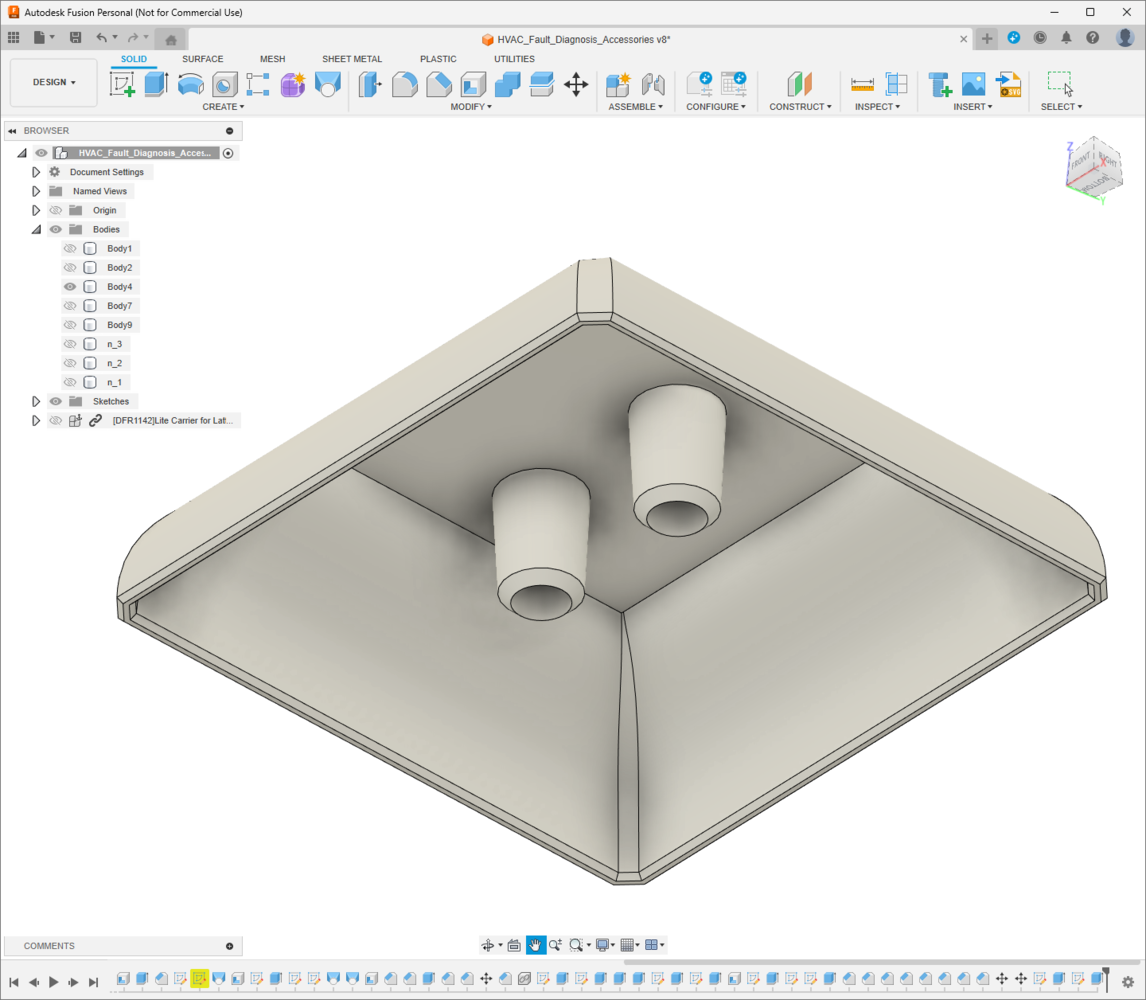
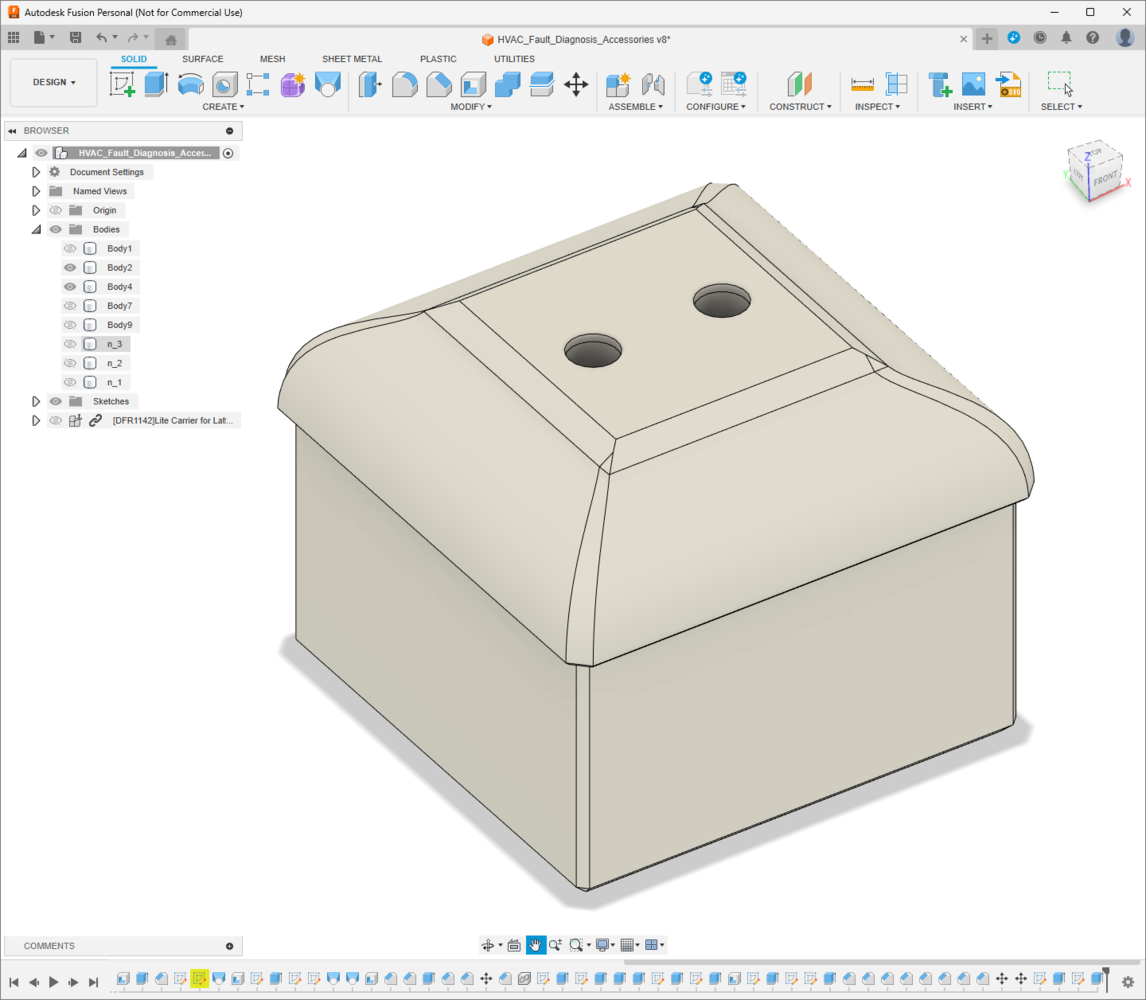
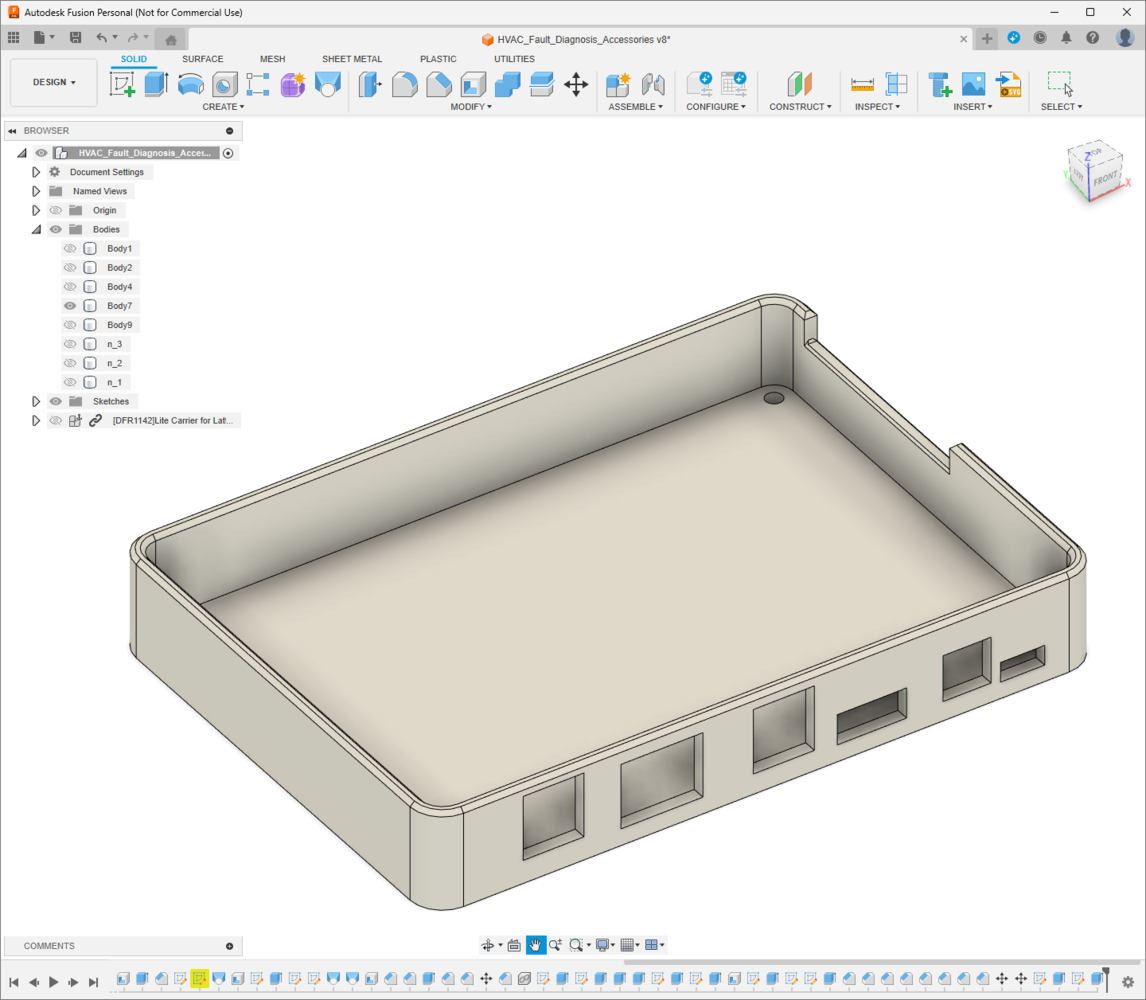
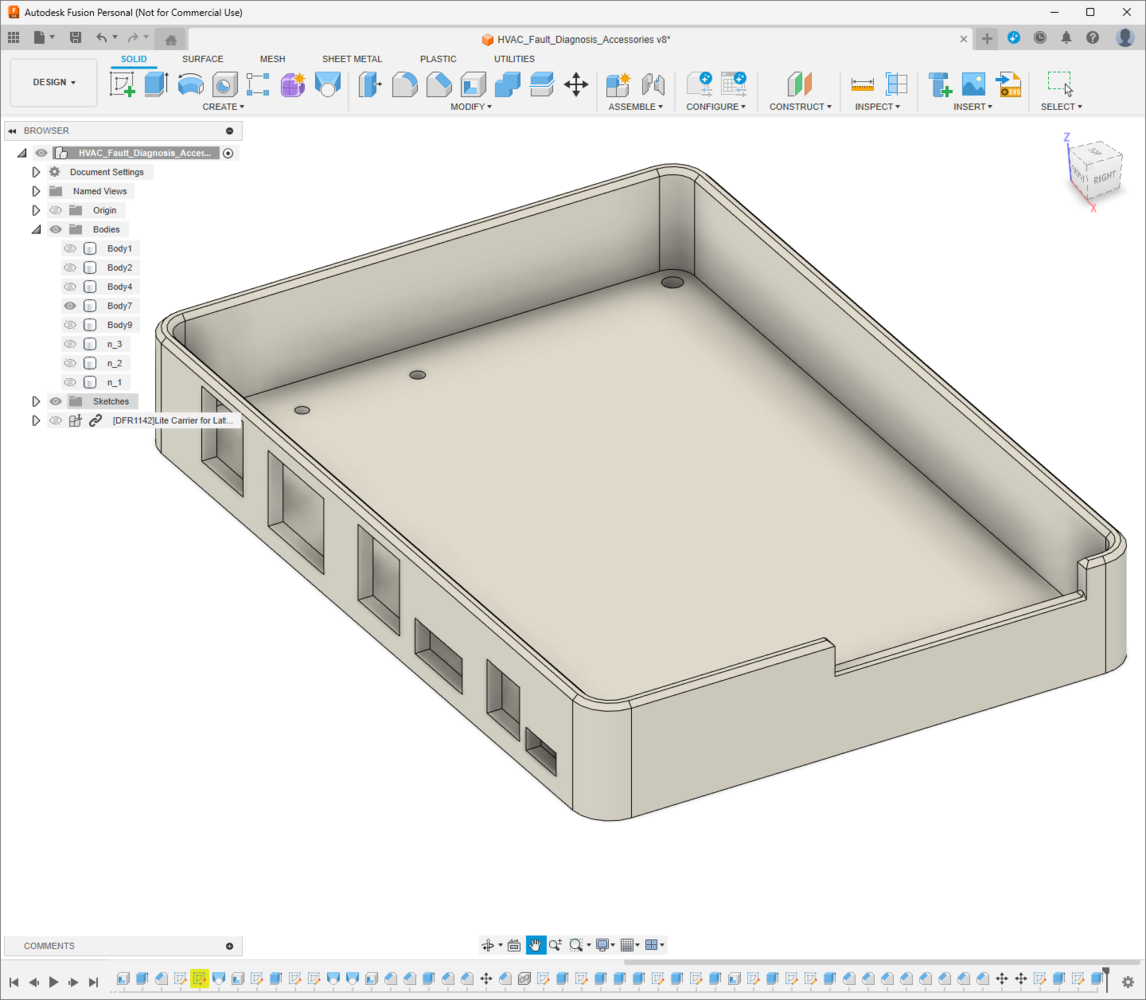
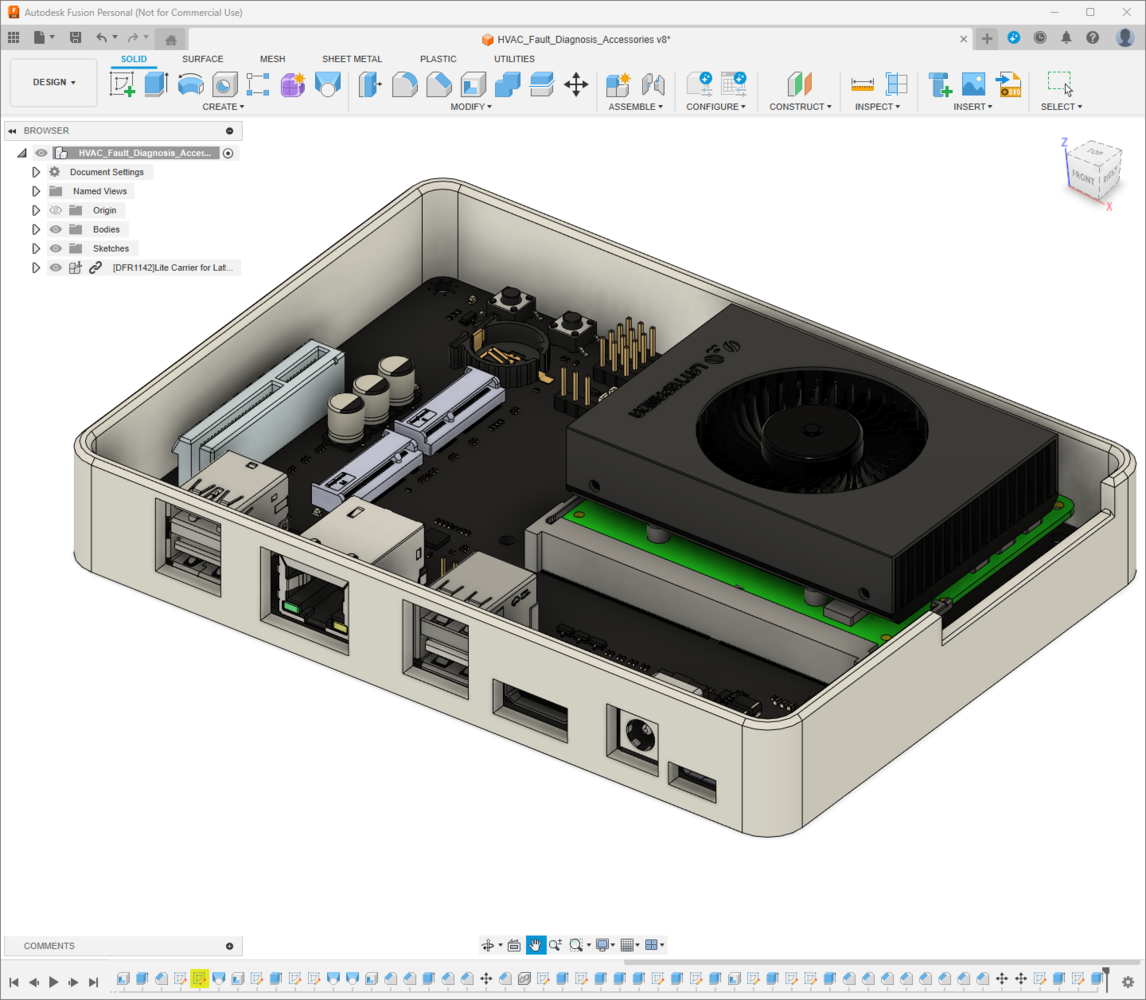
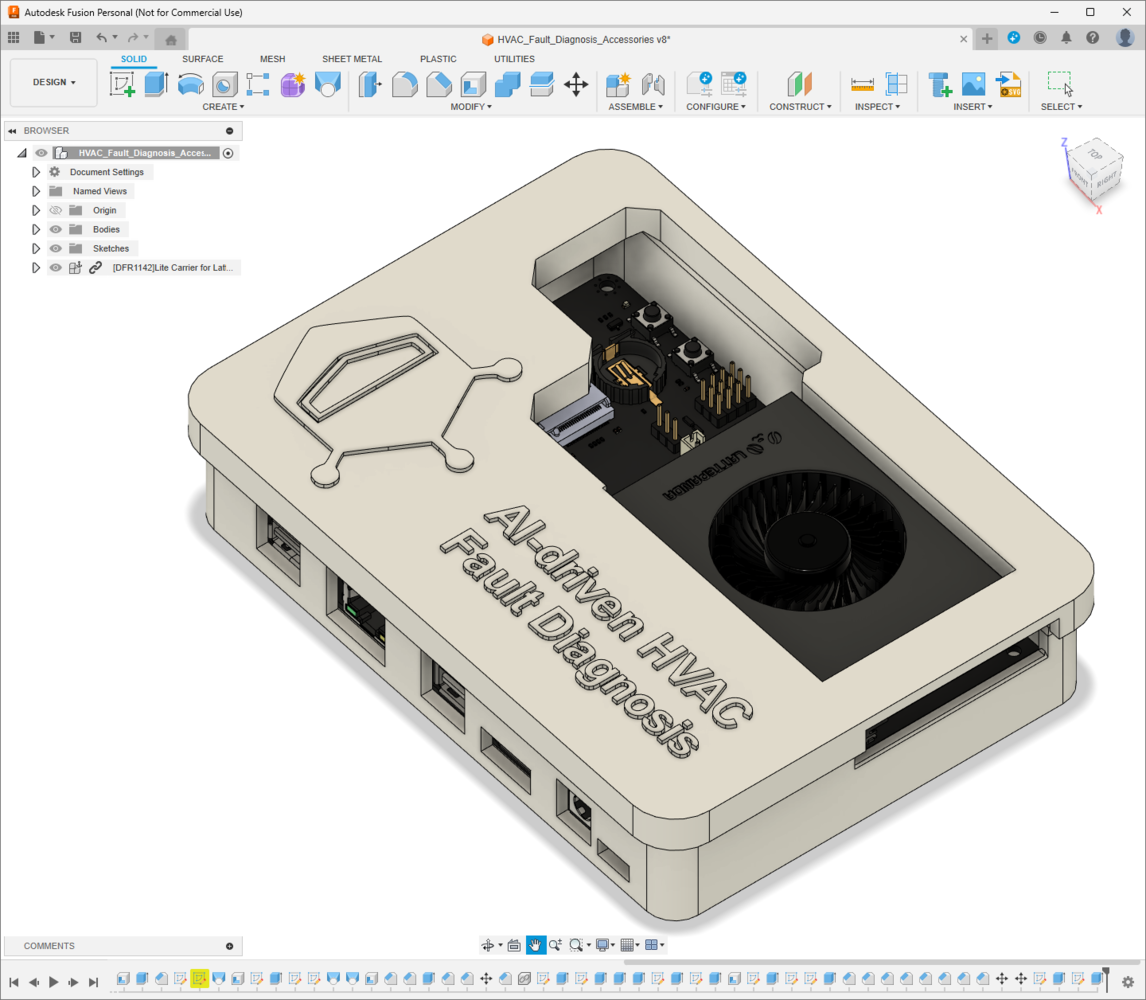
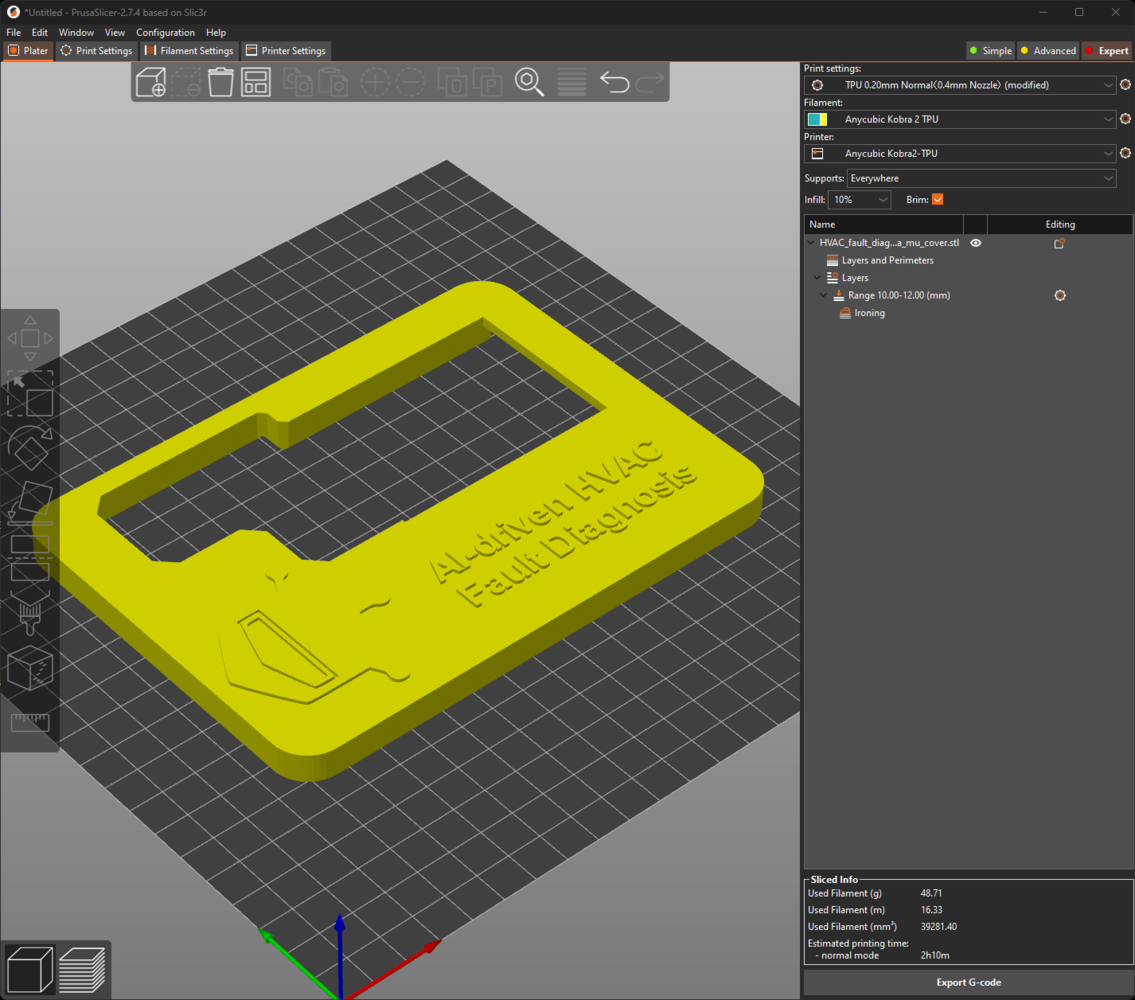
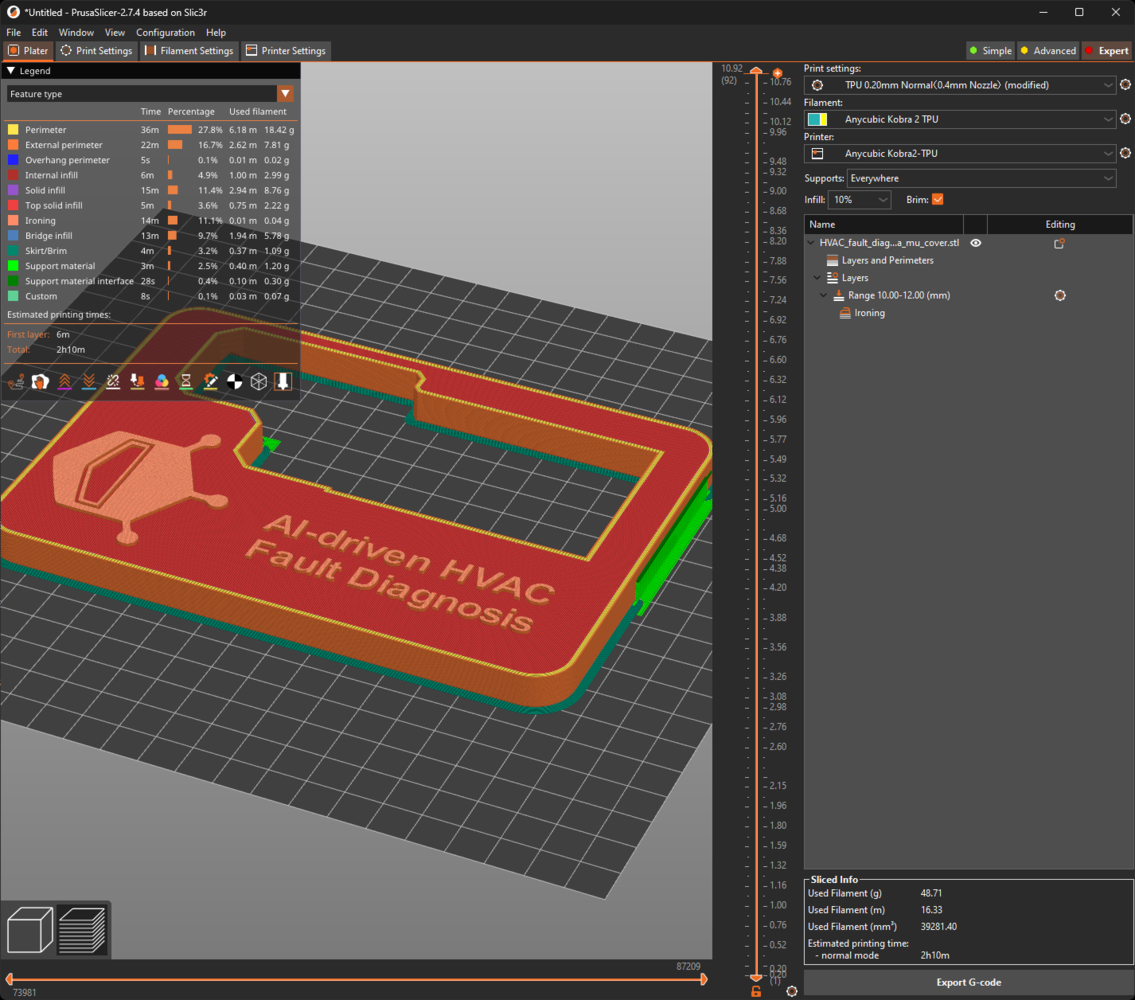
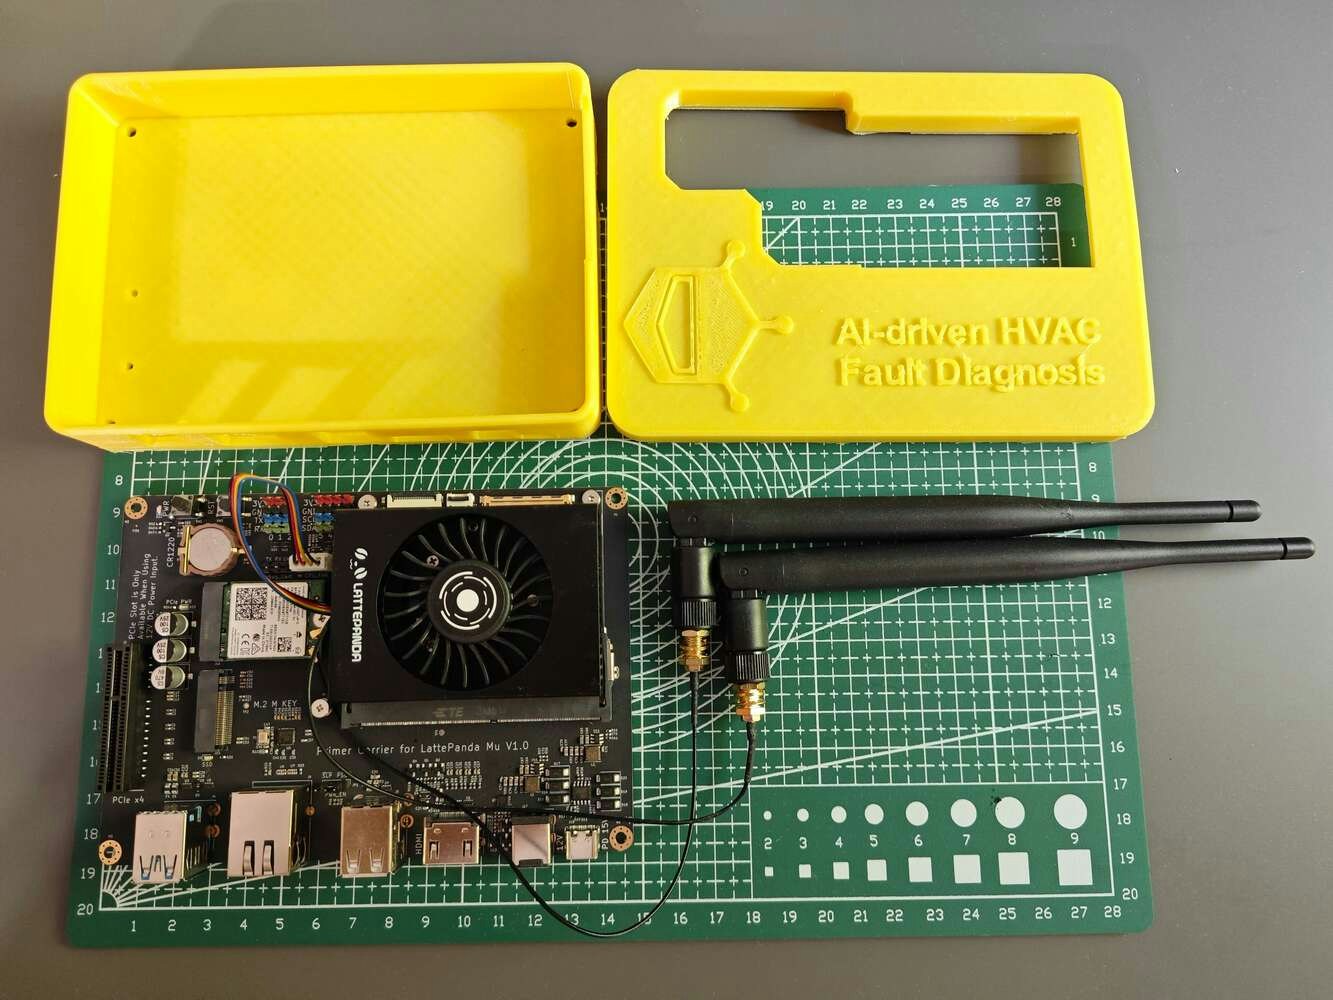
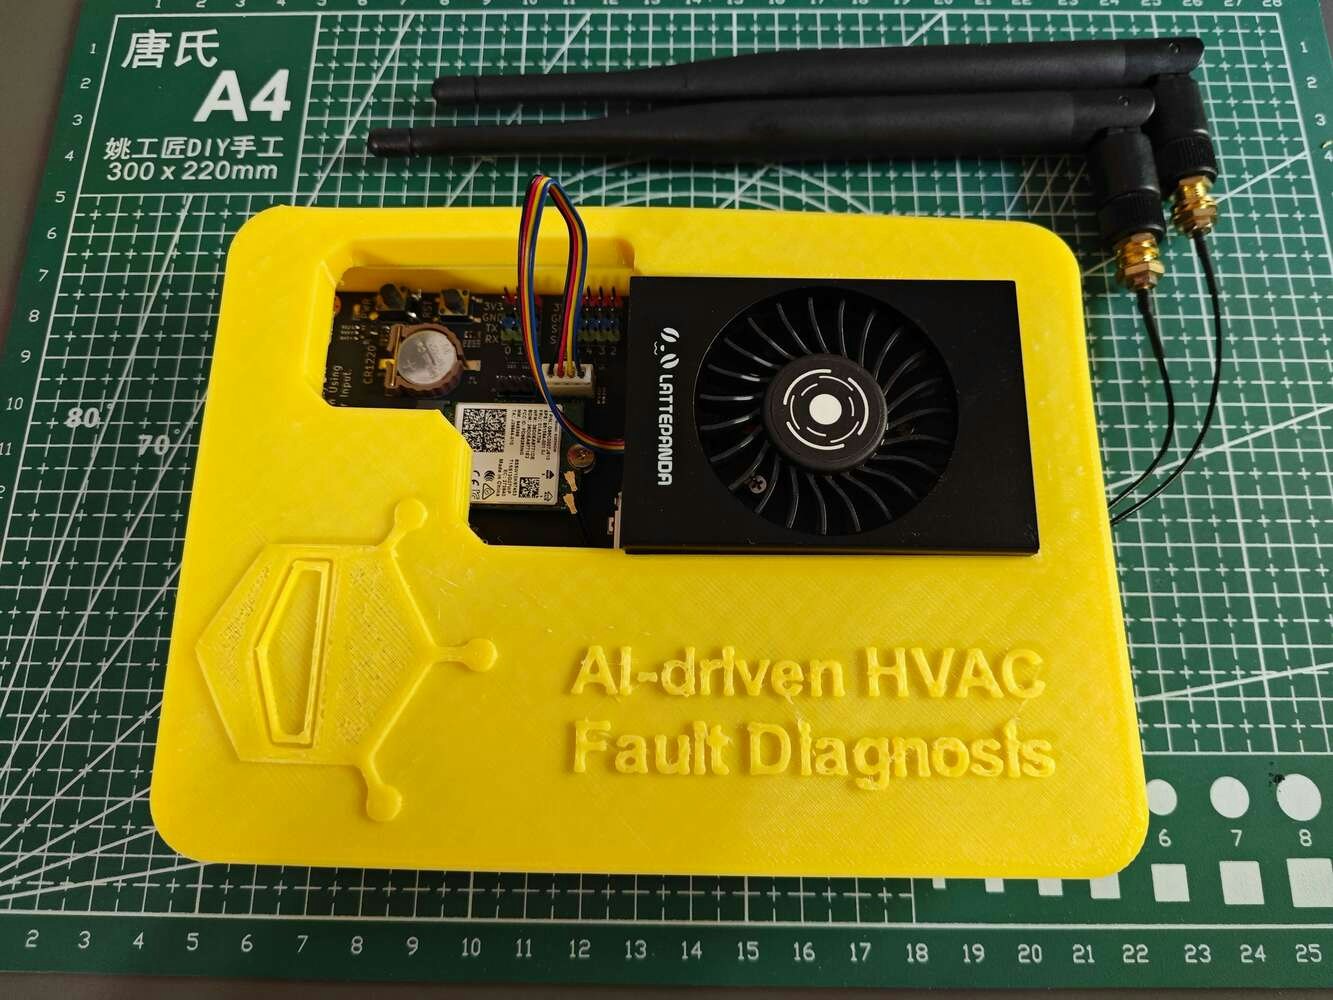
  • a custom case and a removable top cover for LattePanda Mu with the Lite Carrier board.
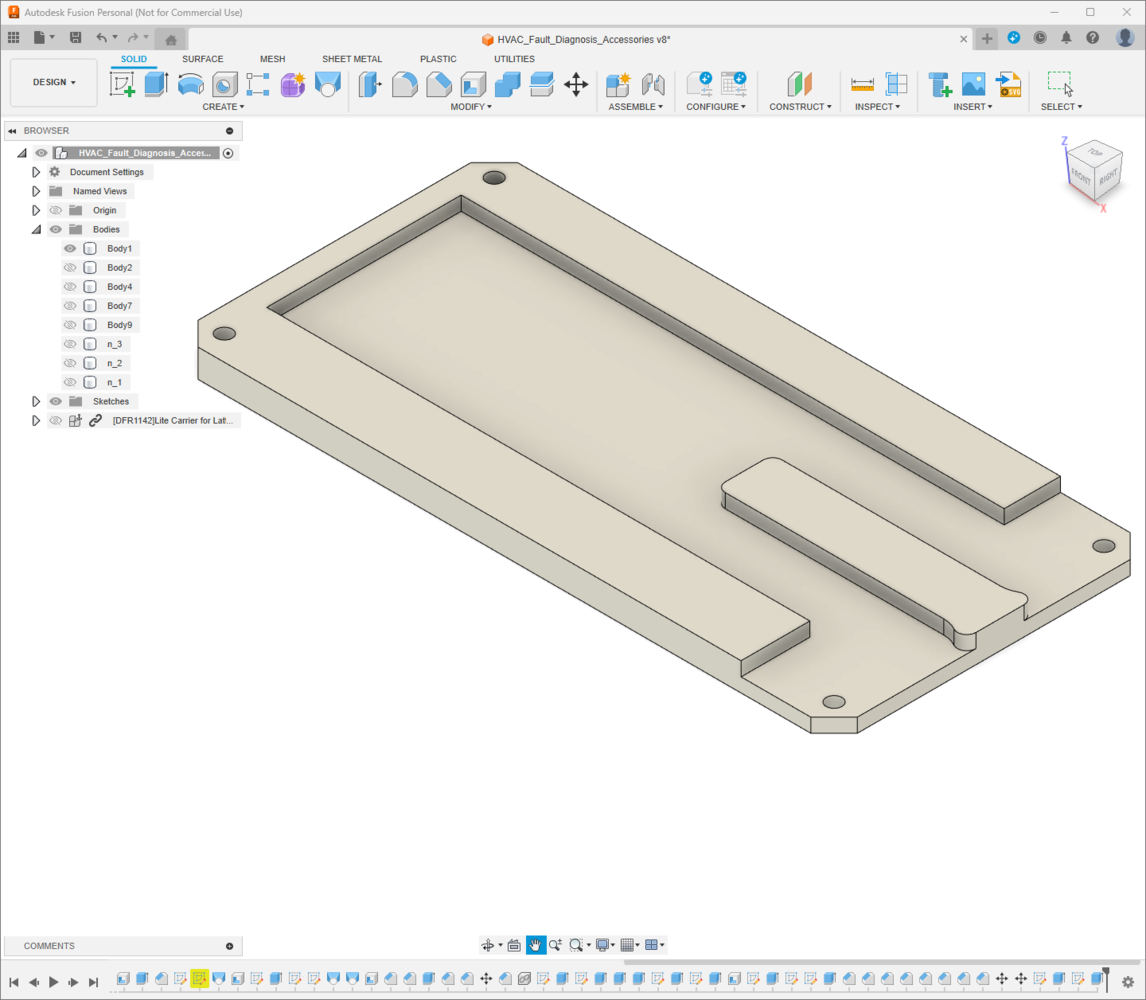
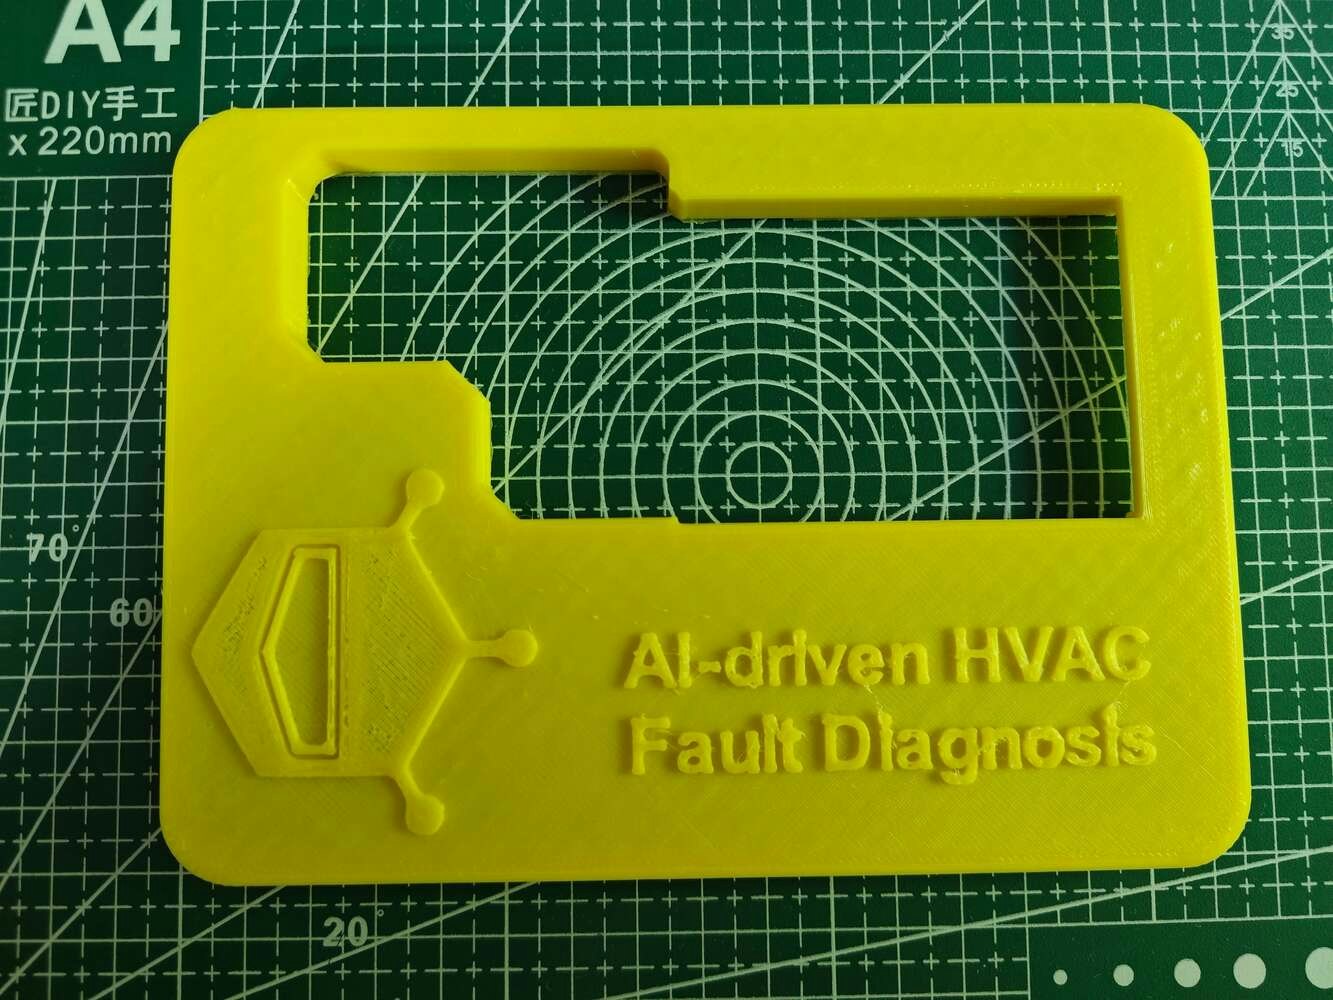
Furthermore, I decided to emboss the DFRobot logo and the project name on the top cover of the LattePanda Mu case to emphasize the qualifications of this segment of the AI-powered HVAC malfunction detection device. I utilized Autodesk Fusion 360 to model all of the mentioned 3D-printable parts and test their clearances to print flawless joints. For further examination, you can download their STL files below.
Fusion 360 angled view of the aluminum cooling block holder

186


Fusion 360 top view of the holder with tubing clearance around the block

187


Fusion 360 side view of the water reservoir body

188


Fusion 360 close-up of the reservoir top cover with two fittings

189


Fusion 360 fit-check view of the inlet and outlet fitting openings

190


Fusion 360 mounted view of the reservoir lid seated on the tank

191


Fusion 360 rear view of the LattePanda Mu case base

192


Fusion 360 exploded view of the removable LattePanda Mu top cover

193


Fusion 360 detail view of the Lite Carrier board clearance inside the case

194


Fusion 360 front view of the DFRobot logo embossed on the cover

195

After designing 3D models and exporting them as STL files, I sliced the exported models in PrusaSlicer, which provides lots of groundbreaking features such as paint-on supports and height range modifiers.
Fusion 360 angled view of the project label embossed on the case top

196


Fusion 360 top view of the ventilation cutouts for the LattePanda case

197


Fusion 360 side view of the cable opening on the LattePanda enclosure

198


Fusion 360 close-up of the cover alignment tabs for the computer case

199


Fusion 360 fit-check view of the complete accessory set arranged in CAD

200


Fusion 360 mounted view of the water reservoir and block holder together

201


Fusion 360 rear view of the LattePanda case beside the coolant parts

202


Fusion 360 exploded view of the final accessory assembly from above

203


Fusion 360 detail view of the printed part clearances before export

204


Fusion 360 front view of the complete water-cooling accessory CAD model

205

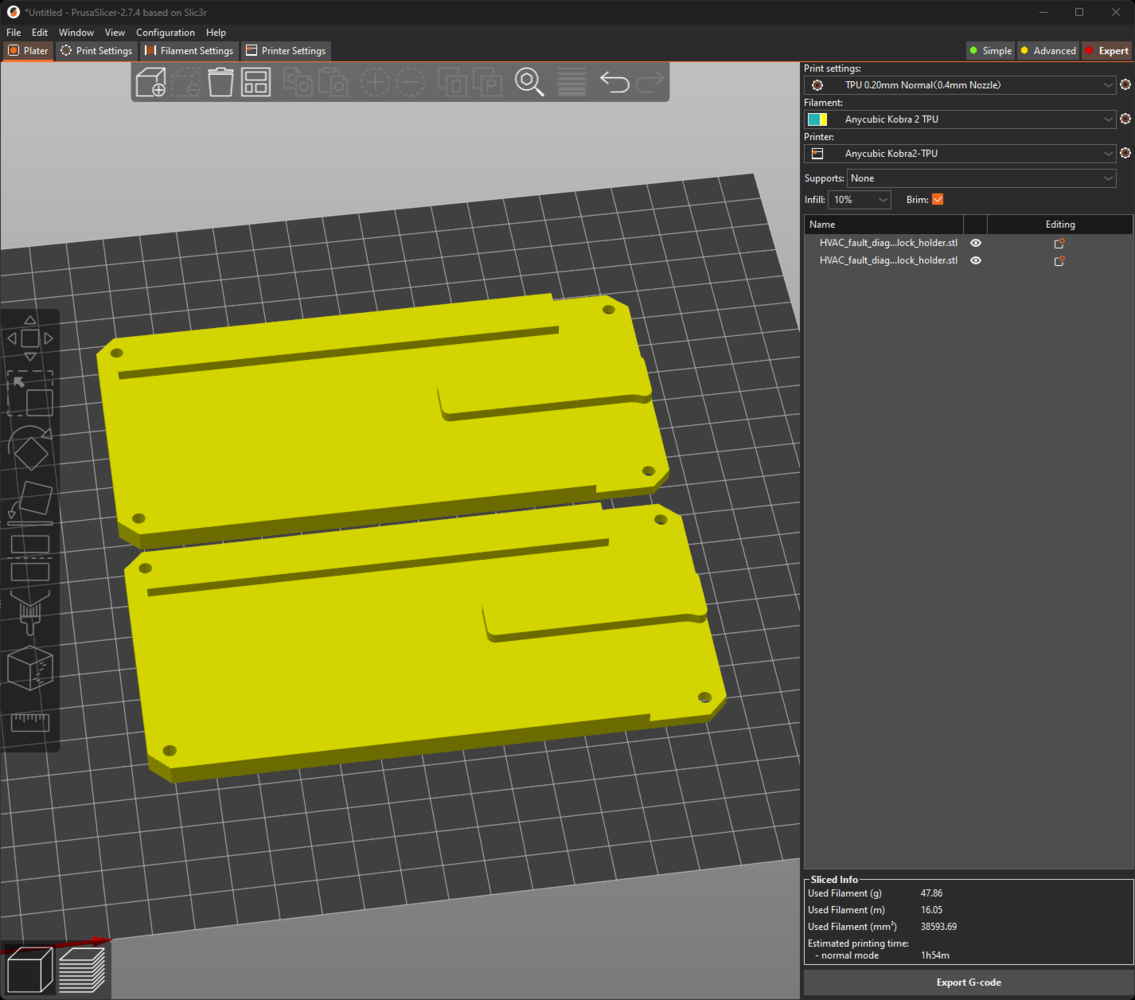
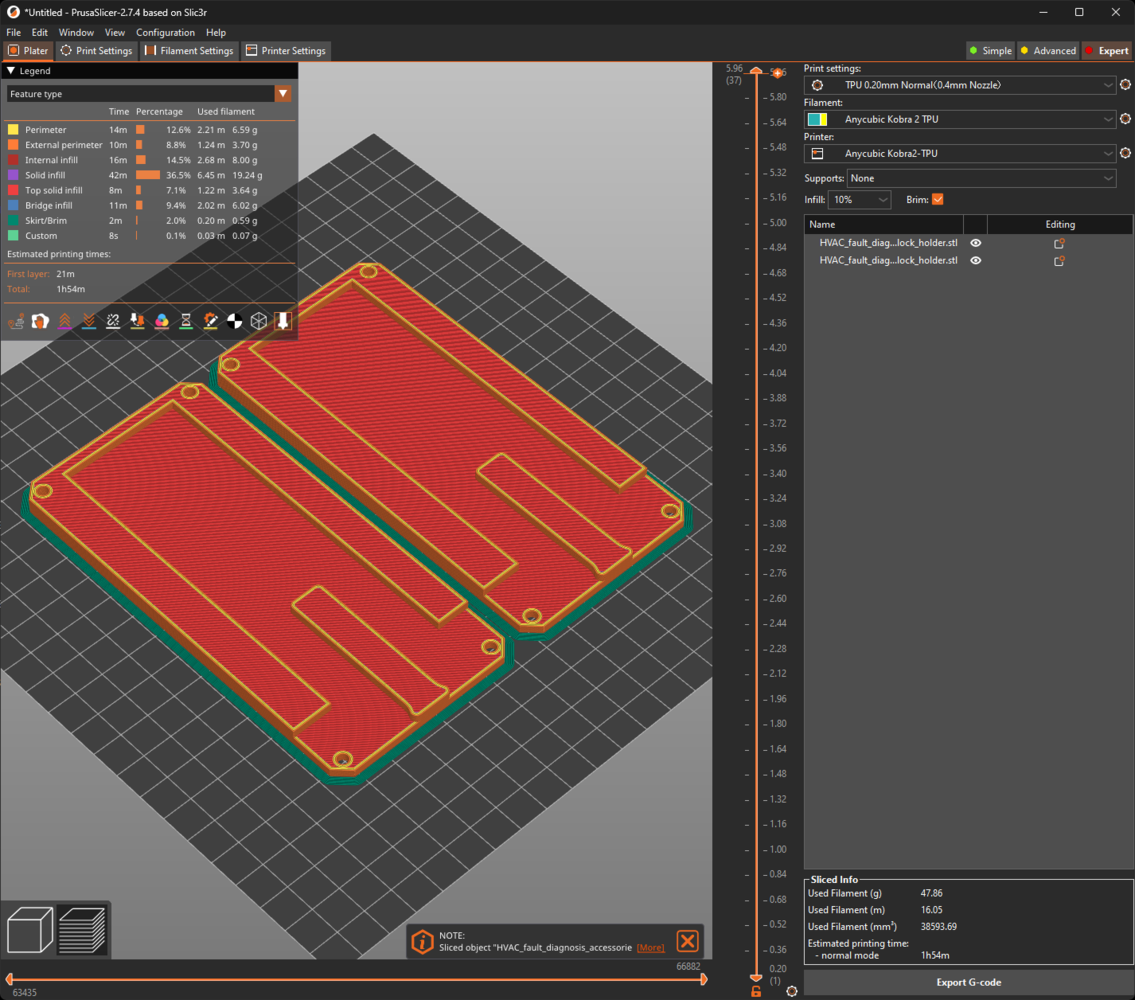
Since I wanted to print pliable parts unsusceptible to water pressure and enclosing the Lite Carrier board perfectly, I utilized this TPU (flexible) filament:
  • eTPU-95A Color Change by Temp
Thanks to this TPU filament’s temperature-based color-changing ability, I was able to observe the current water temperature effortlessly while simulating thermal cooling malfunctions. Finally, I printed all of the mentioned models with my Anycubic Kobra 2 3D Printer.
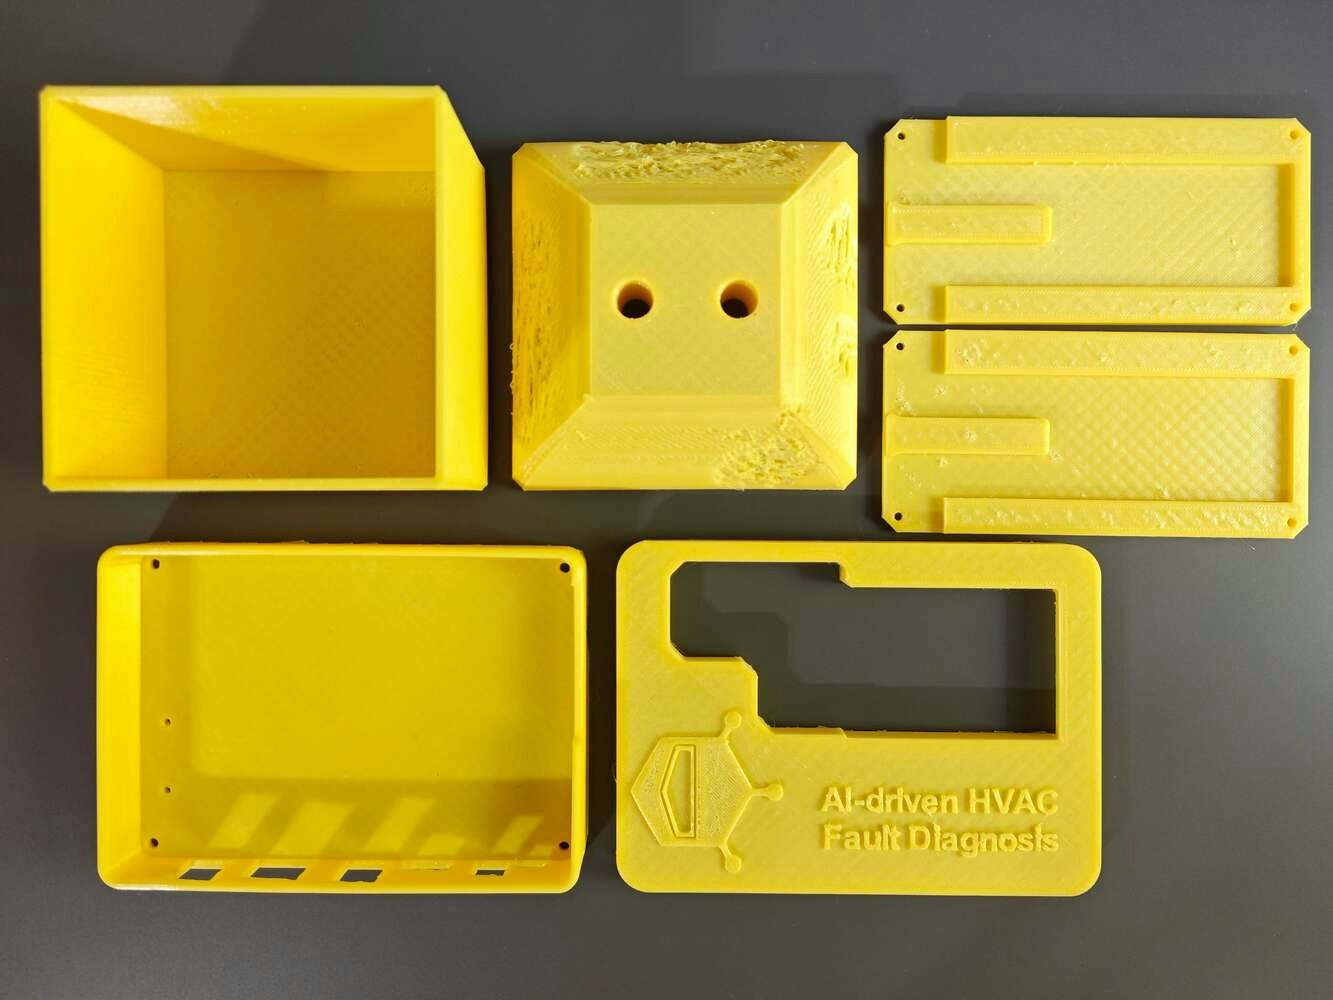
All printed HVAC accessory parts grouped by subsystem before final assembly

206

Step 2.c.1: Assembling the 3D-printed components

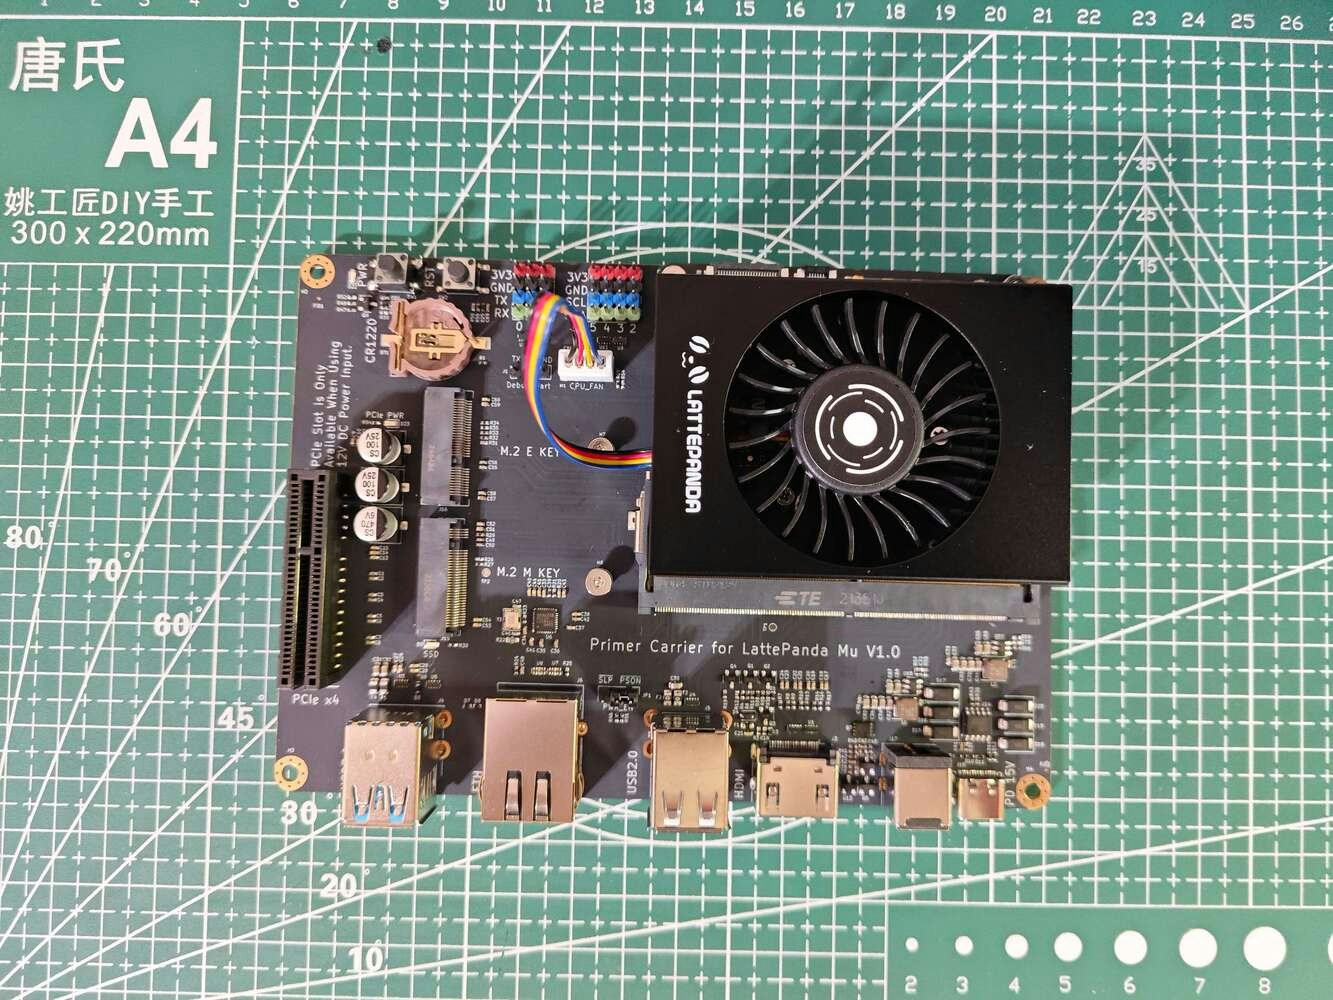
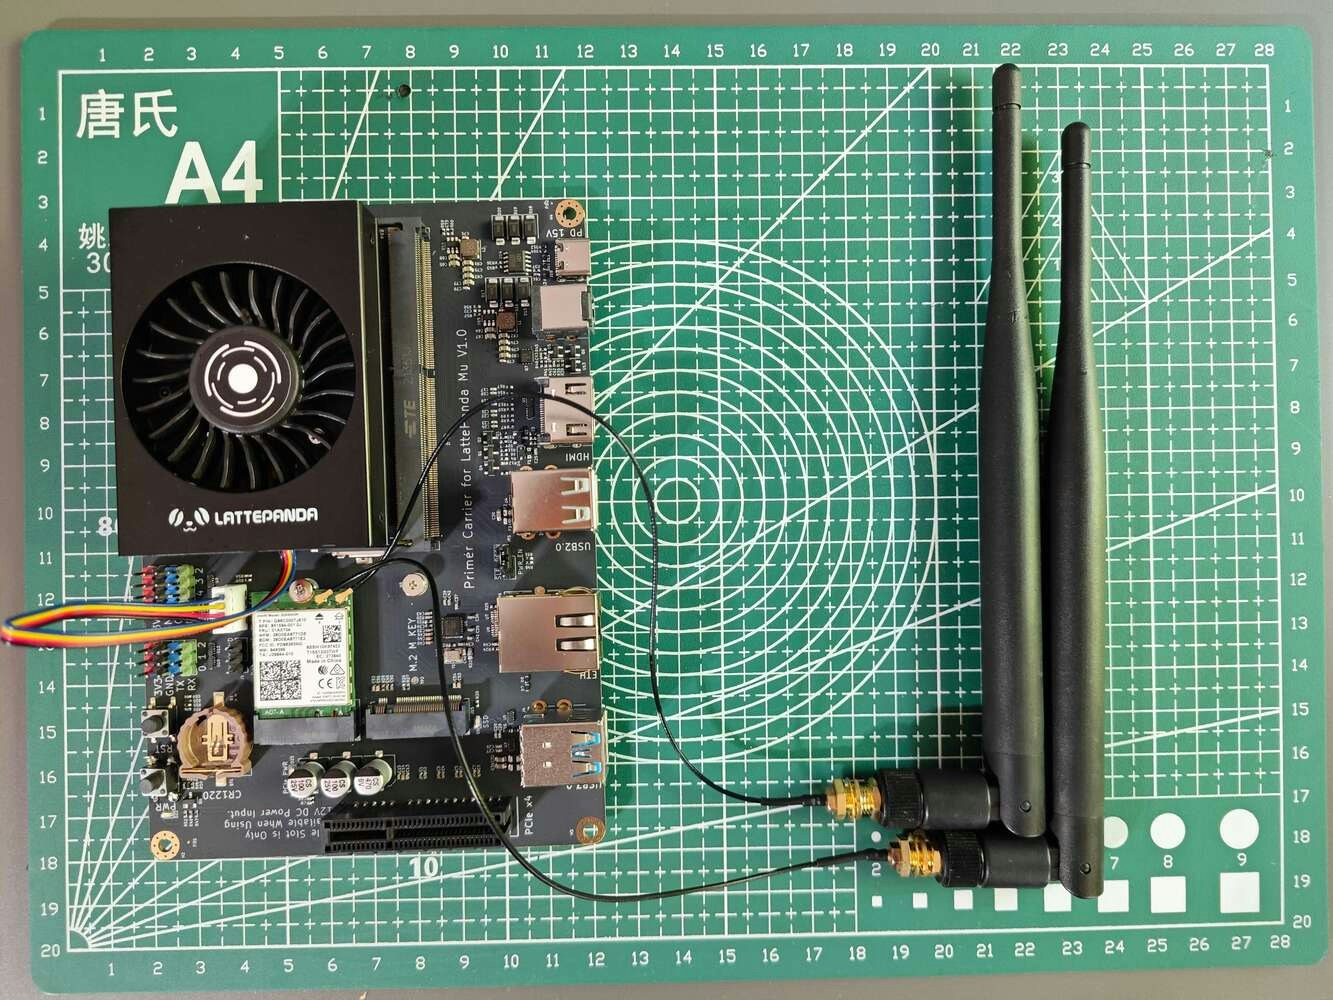
After printing all 3D models related to the additional features, I started to combine the components with their associated parts. First, I installed the special heatsink, providing thermal paste, on LattePanda Mu and attached LattePanda Mu to the Lite Carrier board via the built-in connector (slot). Since the Lite Carrier board does not support Wi-Fi connection out of the box, I connected an AC8265 wireless NIC module (WLAN expansion card) via the built-in M.2 E Key (2230).
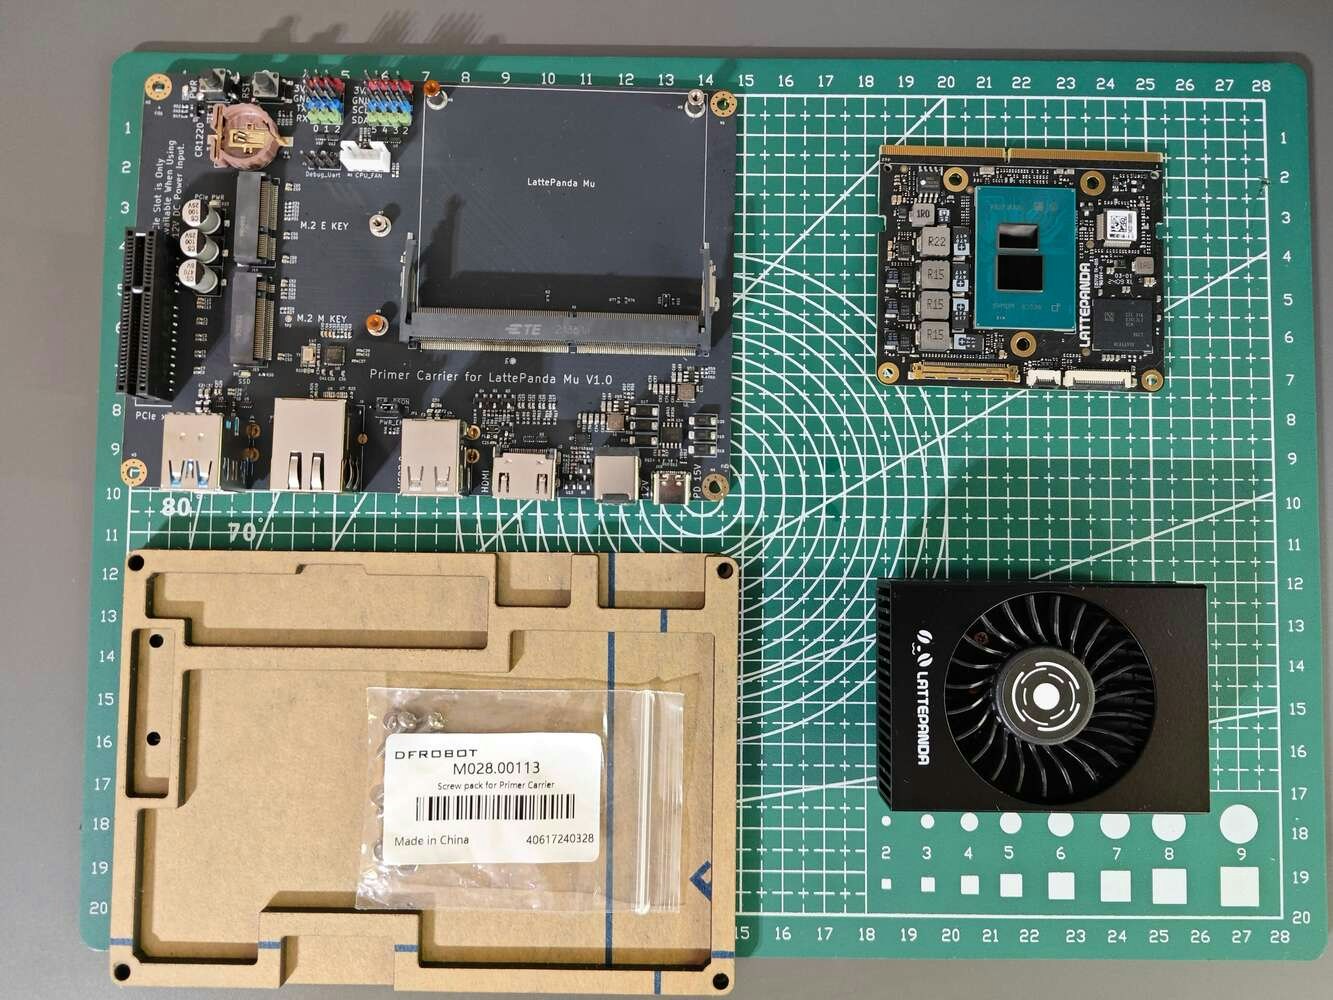
LattePanda Mu mounted on the Lite Carrier board with heatsink installed

207


AC8265 wireless module connected to the LattePanda Mu M.2 E Key slot

208


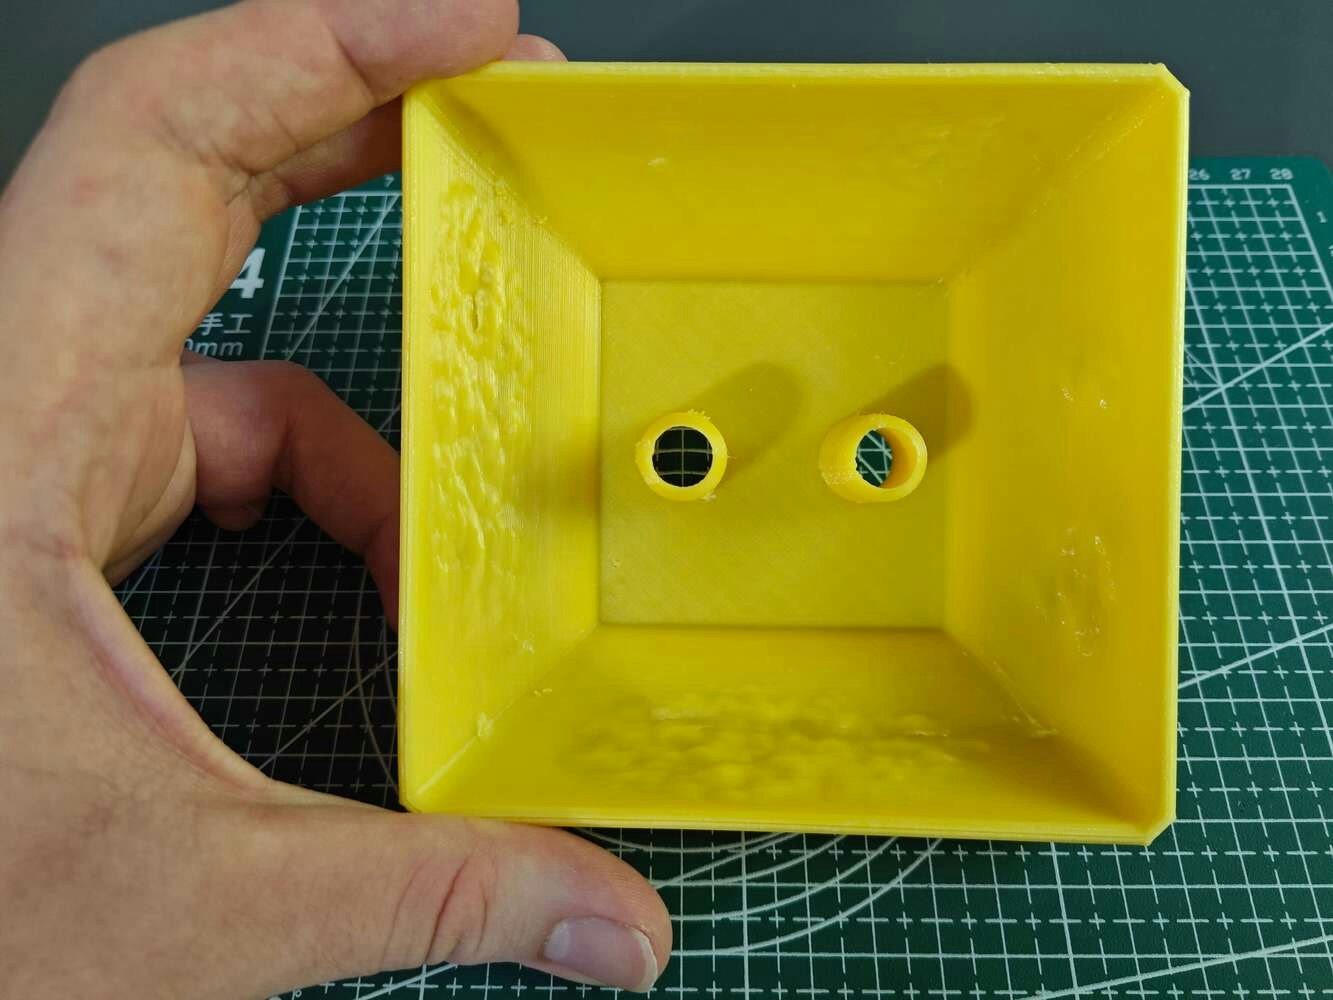
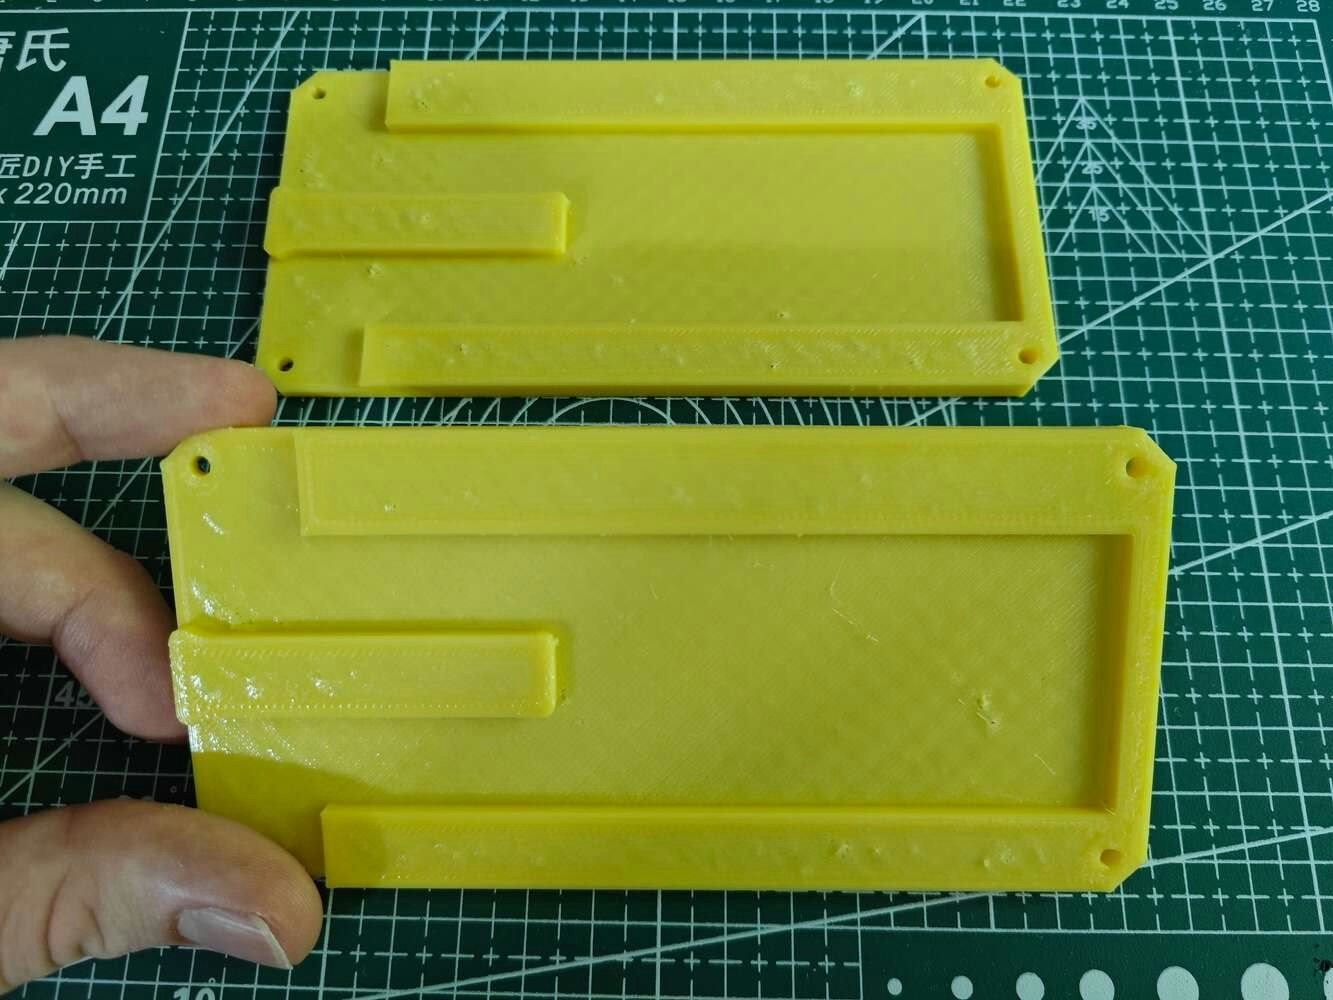
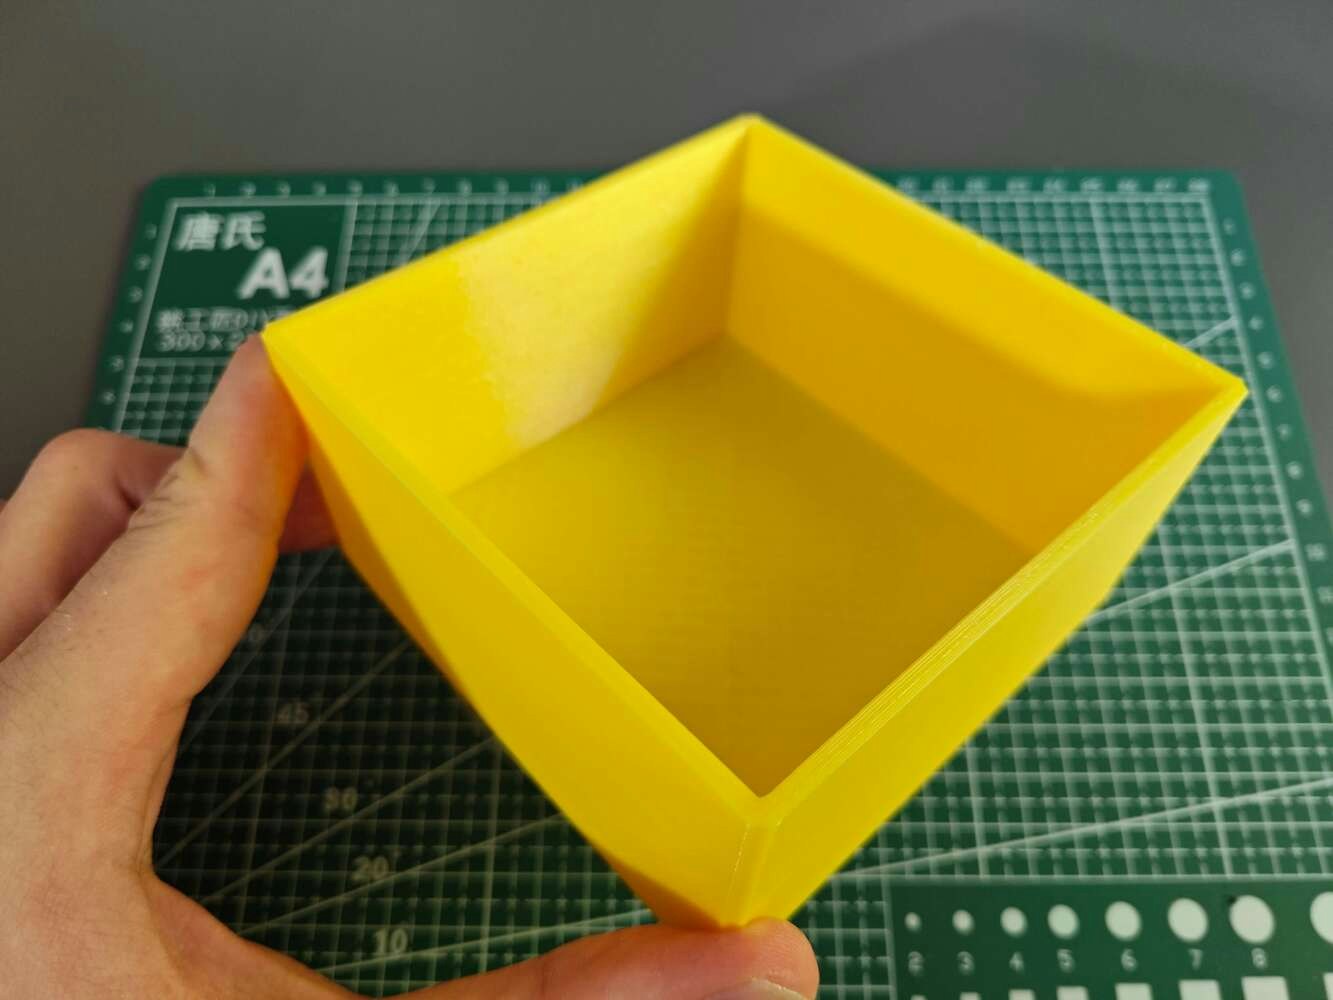
LattePanda Mu assembly seated in the yellow printed case base

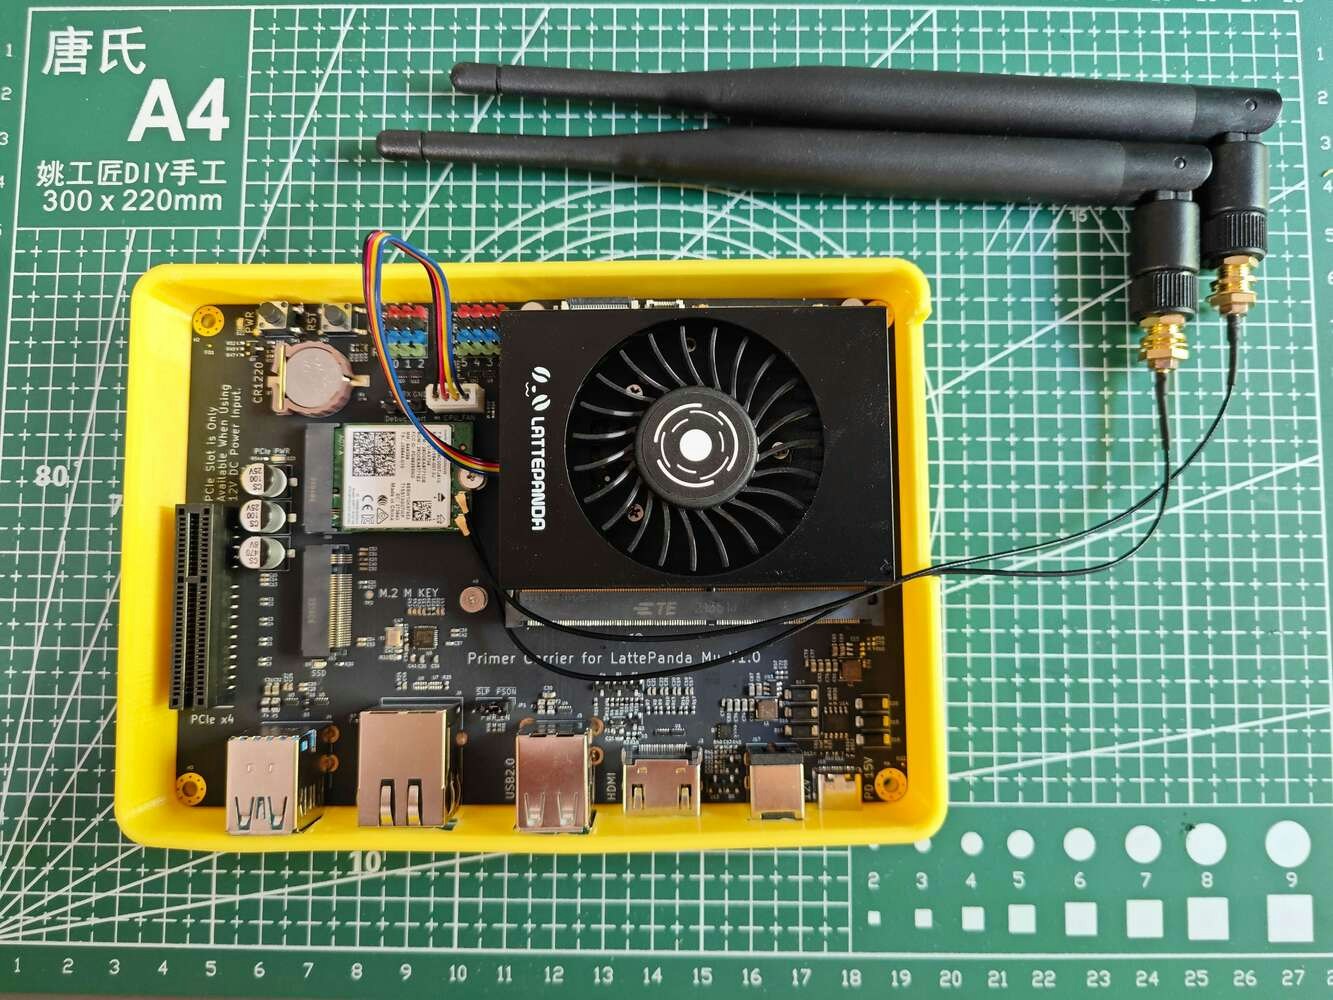
209

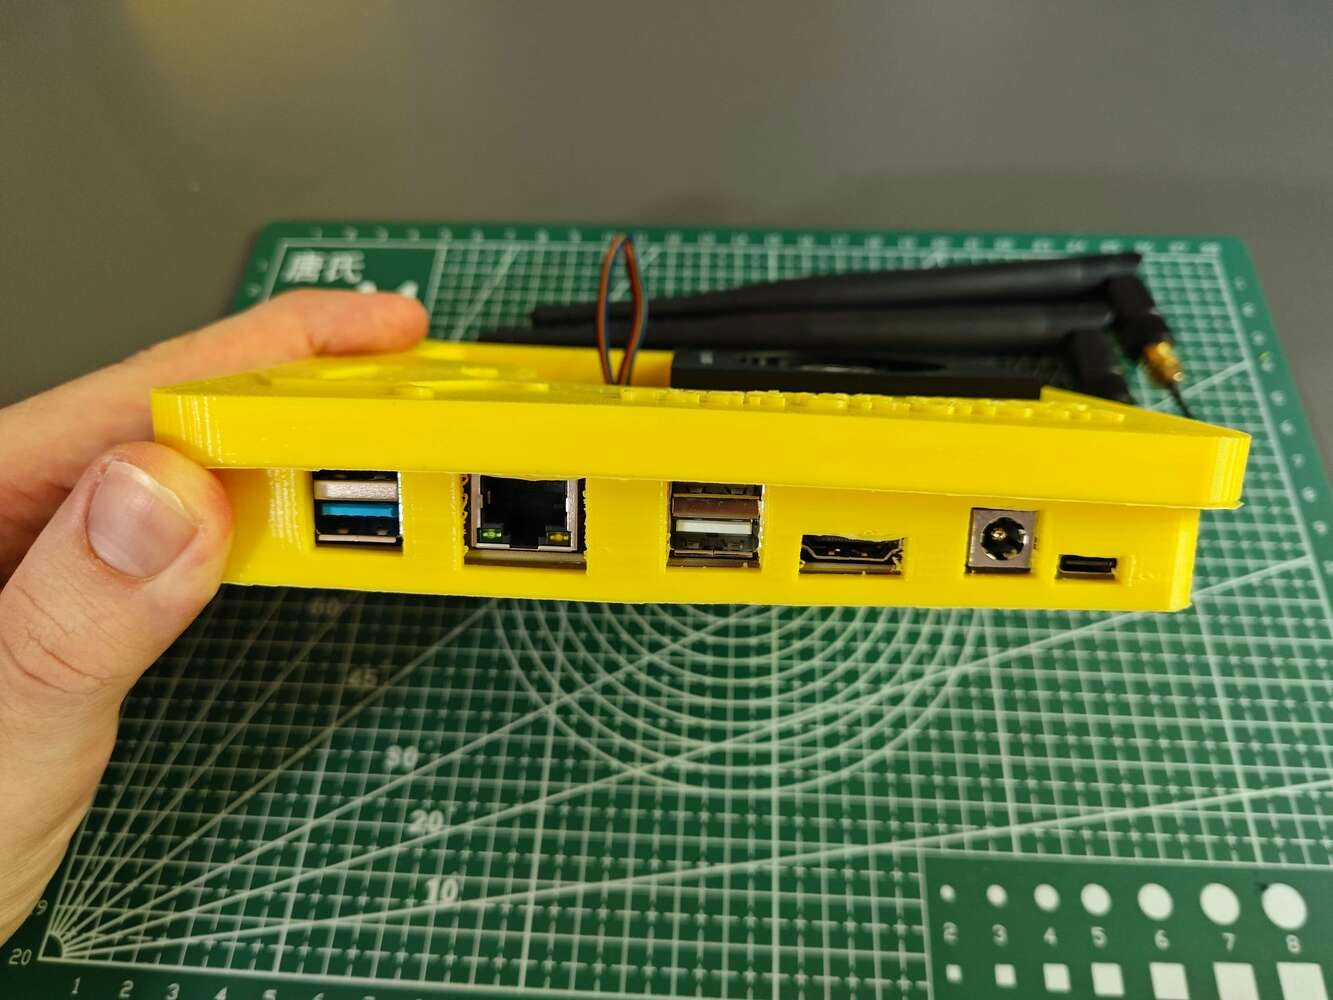
Since the water reservoir does not need assembly, I simply placed its removable top cover. Then, I fastened the aluminum cooling blocks to their holders via the hot glue gun. Since the LattePanda Mu case is printed with a flexible filament, I was able to place the Lite Carrier board into the case effortlessly.
Water-cooling accessory assembly step 1, aligning parts from an angled view with the reservoir, cooling blocks, and LattePanda case

210


Water-cooling accessory assembly step 2, fastening parts in a top view with the reservoir, cooling blocks, and LattePanda case

211


Water-cooling accessory assembly step 3, mounting parts in a side view with the reservoir, cooling blocks, and LattePanda case

212


Water-cooling accessory assembly step 4, routing parts in a close-up with the reservoir, cooling blocks, and LattePanda case

213


Water-cooling accessory assembly step 5, checking parts in a fit-check view with the reservoir, cooling blocks, and LattePanda case

214


Water-cooling accessory assembly step 6, reinforcing parts in a mounted view with the reservoir, cooling blocks, and LattePanda case

215


Water-cooling accessory assembly step 7, seating parts in a rear view with the reservoir, cooling blocks, and LattePanda case

216


Water-cooling accessory assembly step 8, joining parts in an exploded view with the reservoir, cooling blocks, and LattePanda case

217


Water-cooling accessory assembly step 9, finishing parts in a detail view with the reservoir, cooling blocks, and LattePanda case

218


Water-cooling accessory assembly step 10, positioning parts in a front view with the reservoir, cooling blocks, and LattePanda case

219


Water-cooling accessory assembly step 11, aligning parts from an angled view with the reservoir, cooling blocks, and LattePanda case

220


Water-cooling accessory assembly step 12, fastening parts in a top view with the reservoir, cooling blocks, and LattePanda case

221


Water-cooling accessory assembly step 13, mounting parts in a side view with the reservoir, cooling blocks, and LattePanda case

222


Water-cooling accessory assembly step 14, routing parts in a close-up with the reservoir, cooling blocks, and LattePanda case

223

Step 3: Setting up a simplified water-cooled HVAC system manifesting potential cooling malfunctions

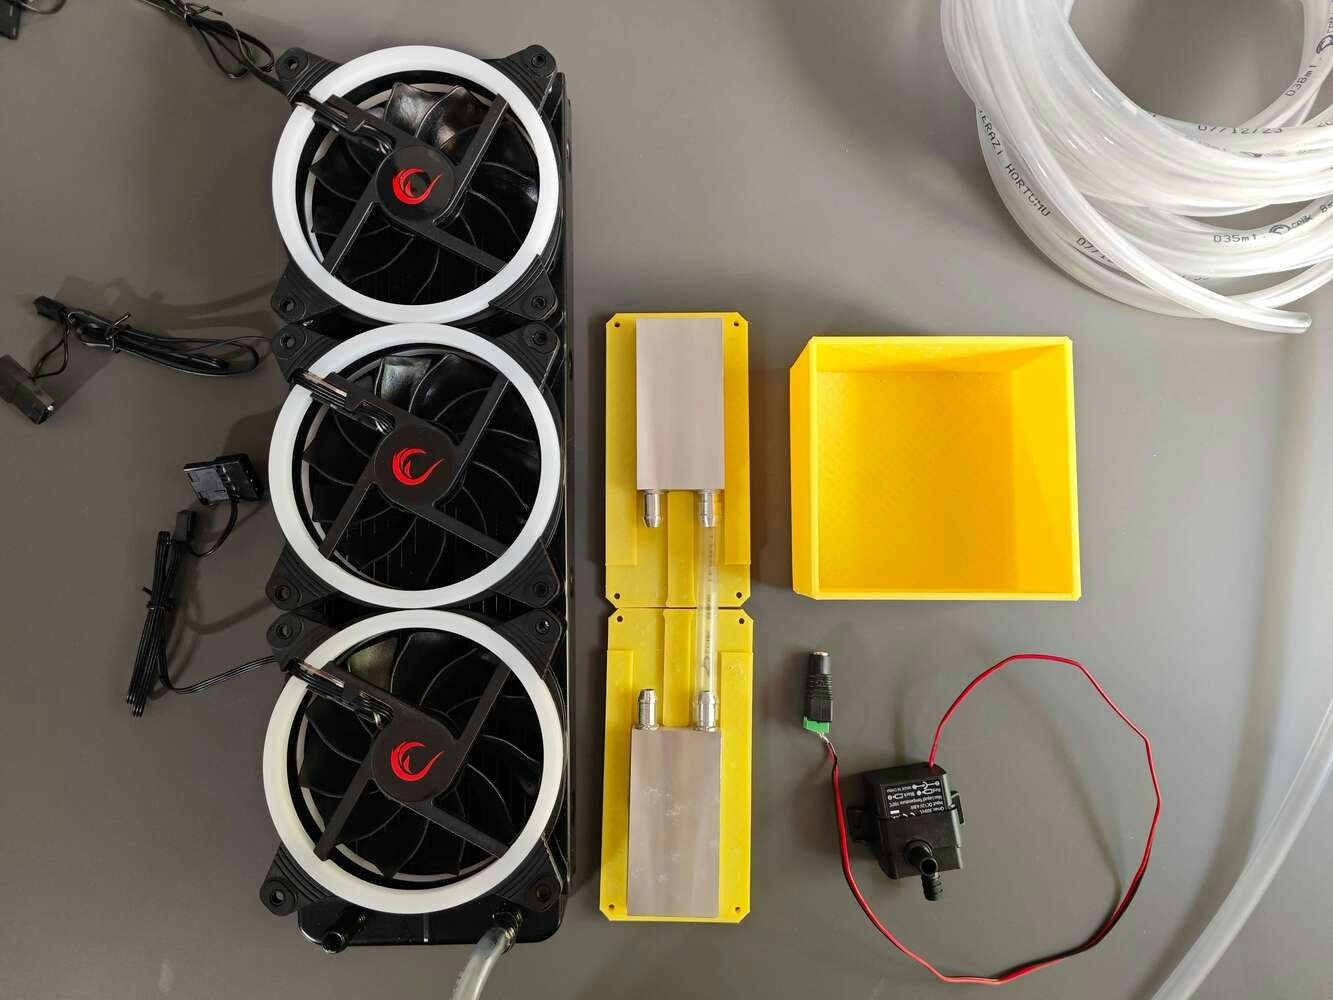
As discussed earlier, I needed to build a simplified water-based HVAC system to construct data sets fulfilling the purpose of multi-model HVAC malfunction diagnosis and to conduct in-field model testing. Since I got heavily inspired by PC (computer) water cooling systems, I built my simplified system by utilizing these water cooling components, reminiscent of a closed-loop PC water cooling design:
  • an aluminum water cooling radiator,
  • two aluminum water cooling blocks (40 x 80 mm),
  • a water cooling pump (4.8 W - 240 L/H),
  • 10 mm plastic tubing (hose),
  • three 120 mm case fans (RGB) compatible with the radiator.
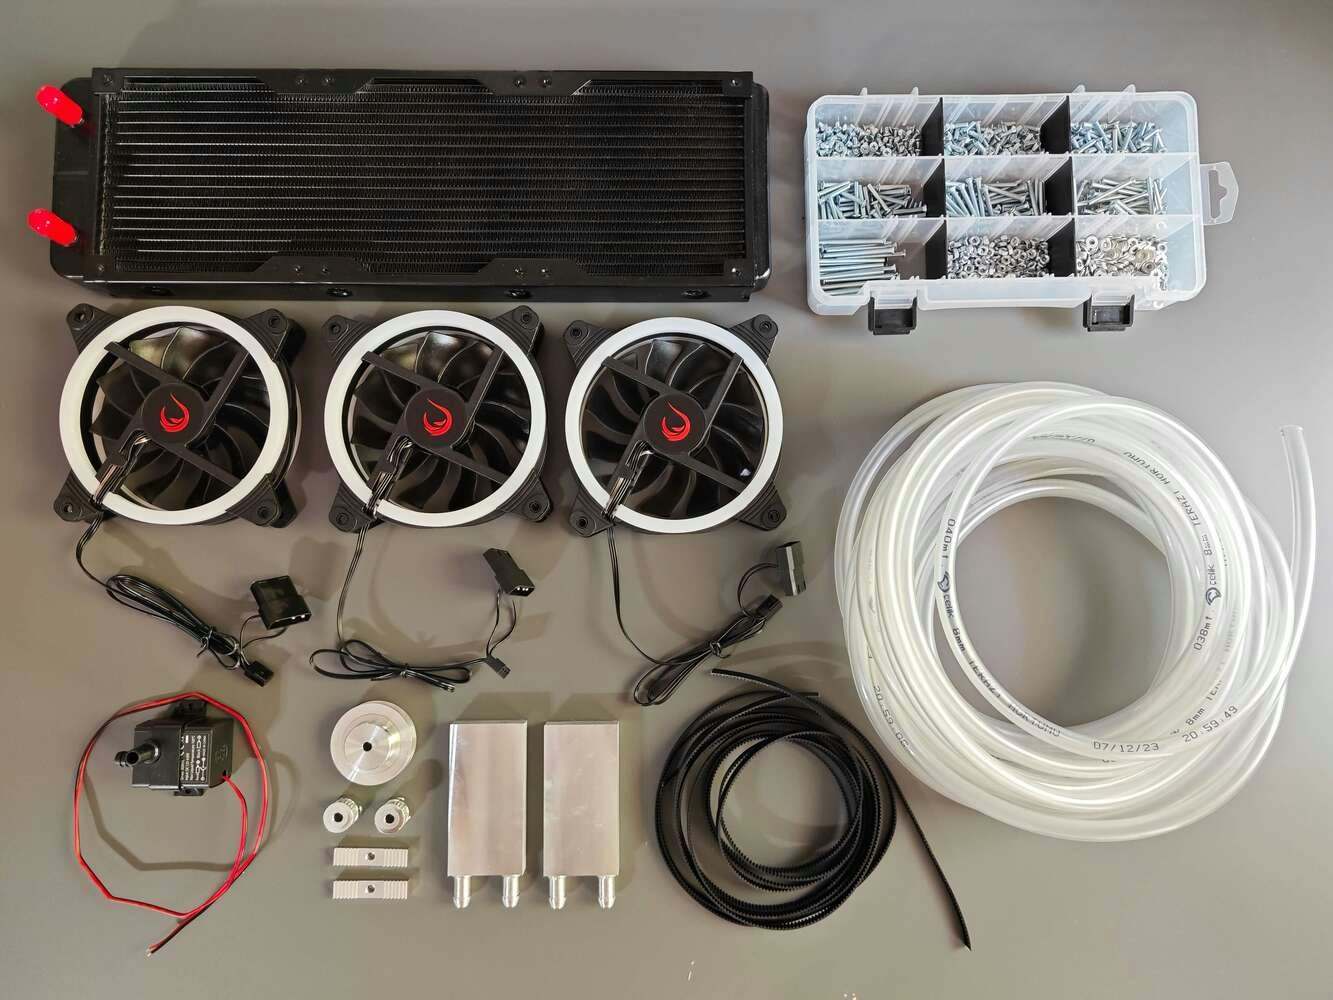
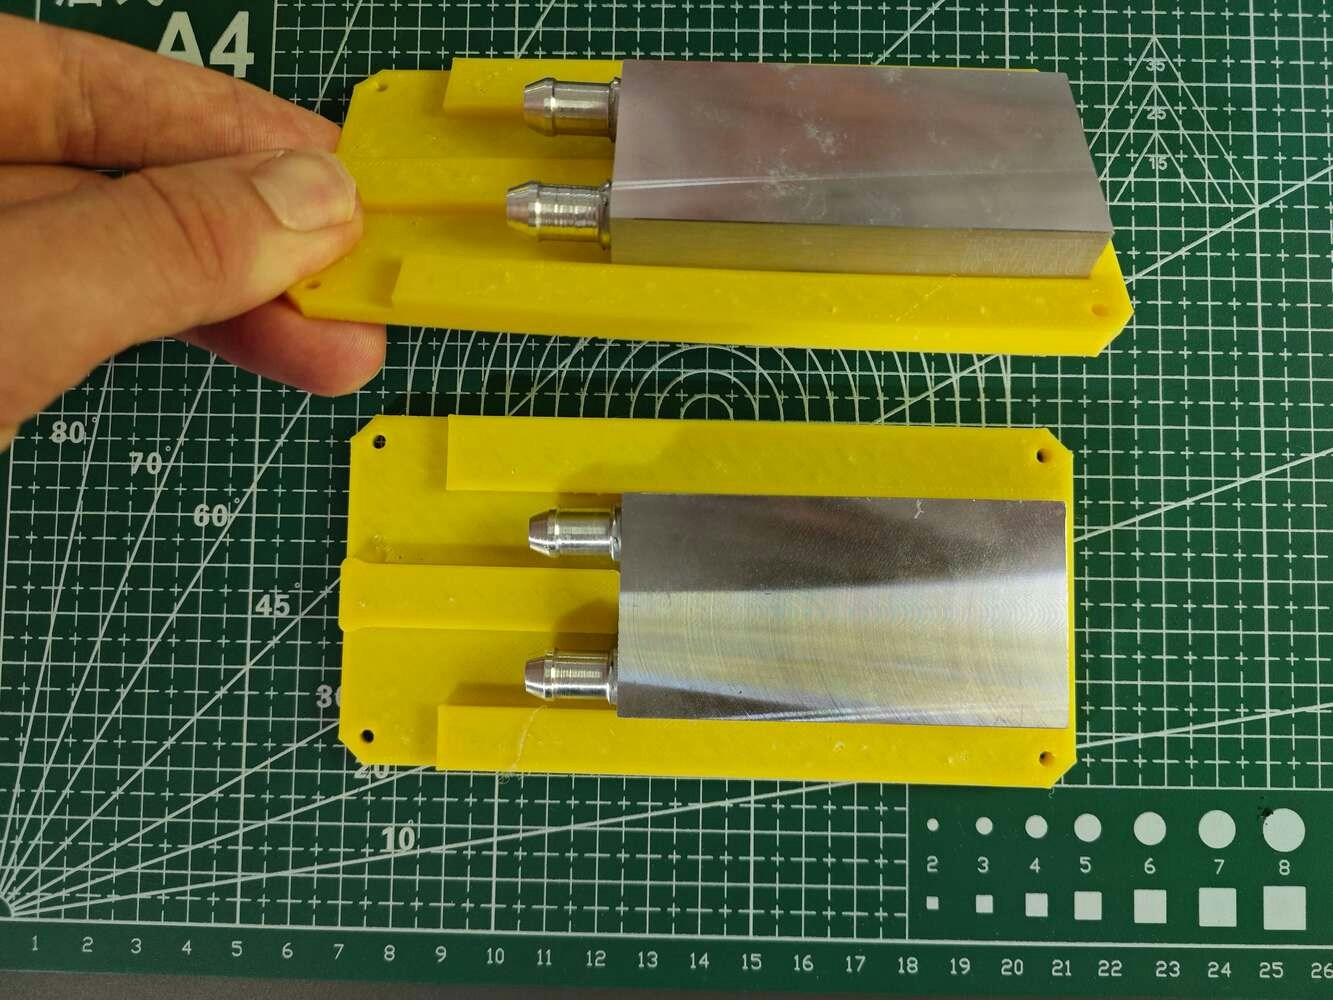
As mentioned, I decided to model a 3D-printable water reservoir, including a removable top cover with built-in plastic tubing fittings (IN and OUT). After concluding assembling all of the 3D-printed parts, I started to build the simplified water-based HVAC system.
Printed mounts, enclosures, reservoir, and CNC pieces prepared for the full HVAC build

224

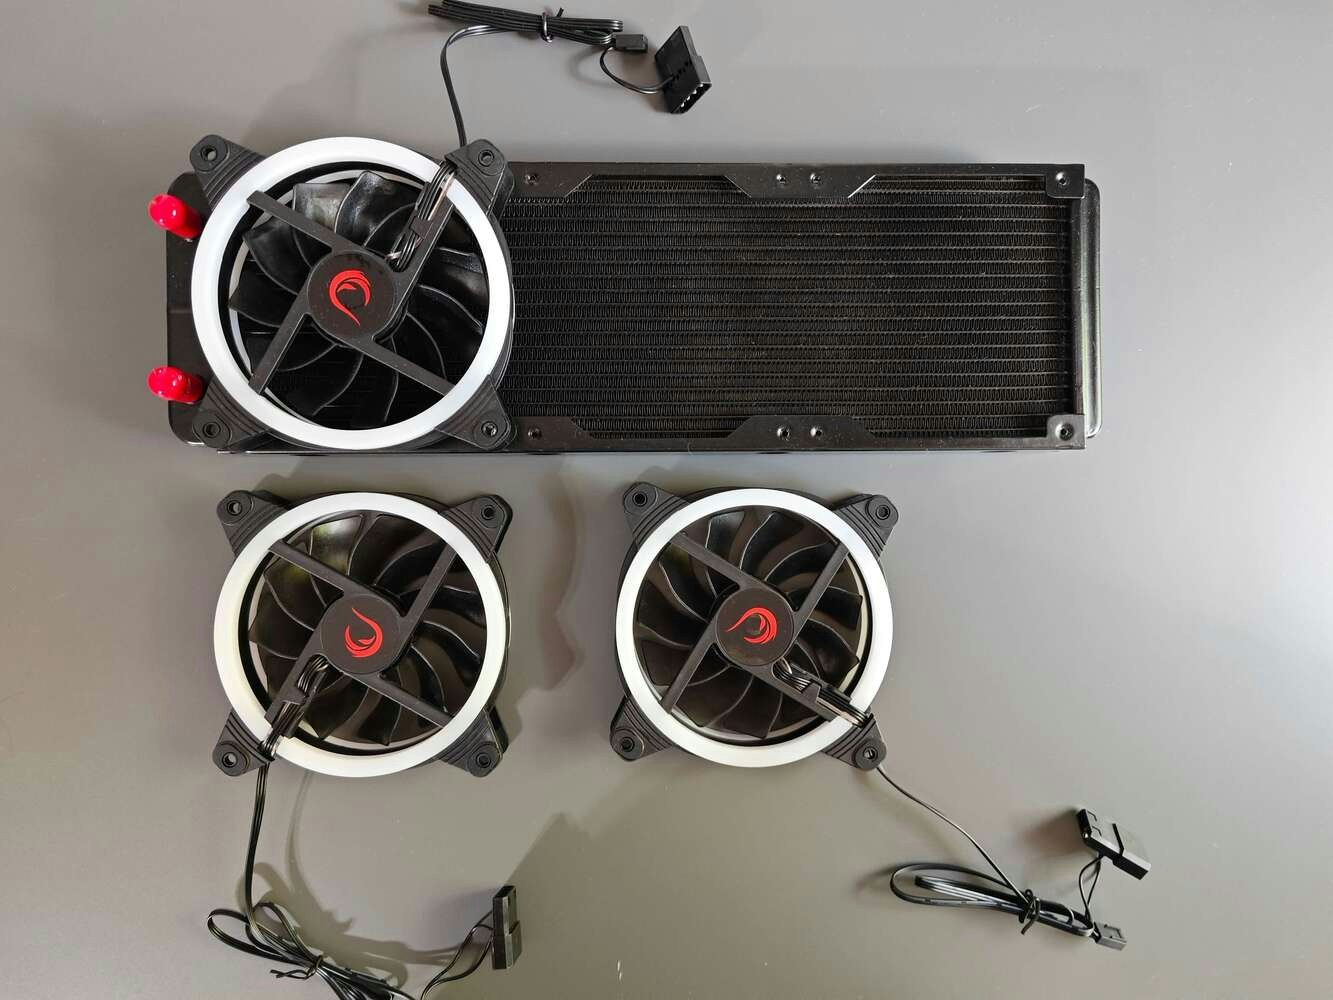
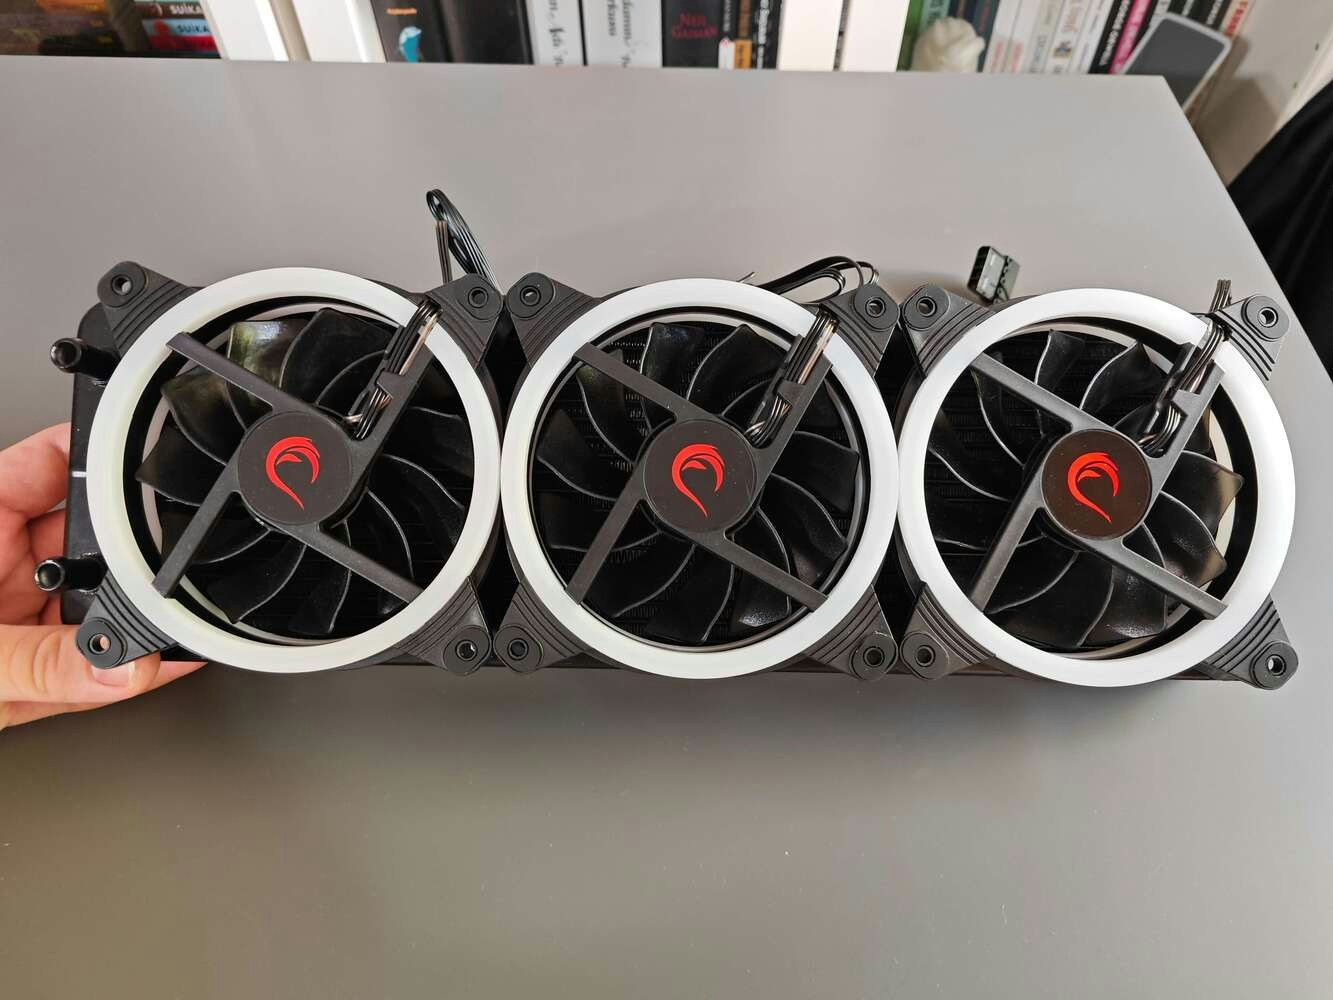
:hash: First, I attached 120 mm RGB case fans to the aluminum radiator via M3 screws and nuts.
Water cooling pump and tubing prepared beside the printed reservoir

225


Plastic tubing routed from the reservoir lid to the pump inlet

226

:hash: Then, I attached a terminal input female DC barrel jack to the water pump and connected two aluminum cooling blocks via plastic tubing.
Aluminum cooling blocks connected with clear tubing on the workbench

227

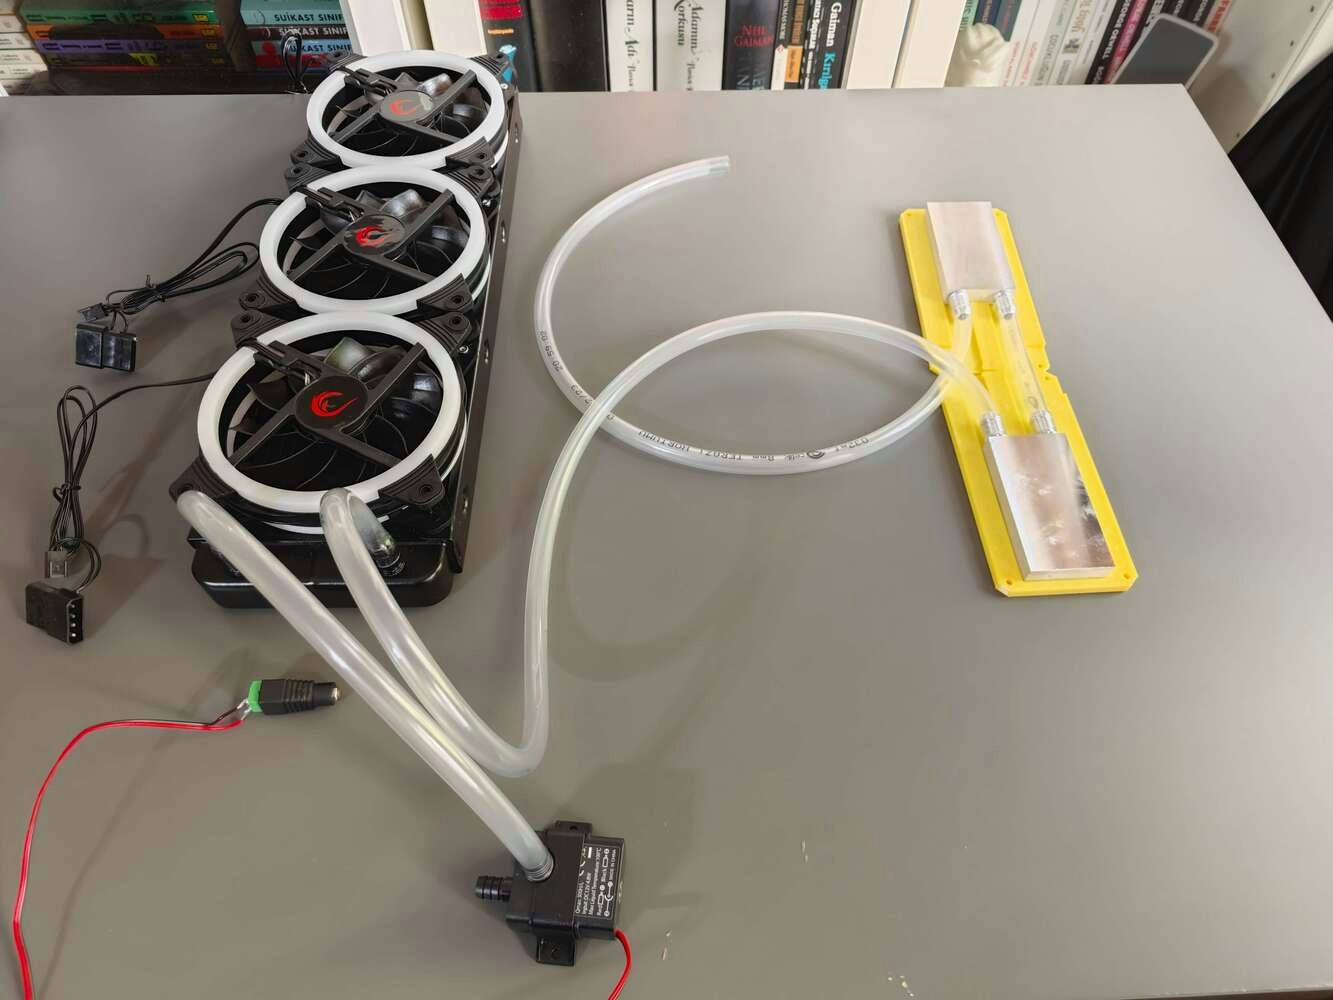
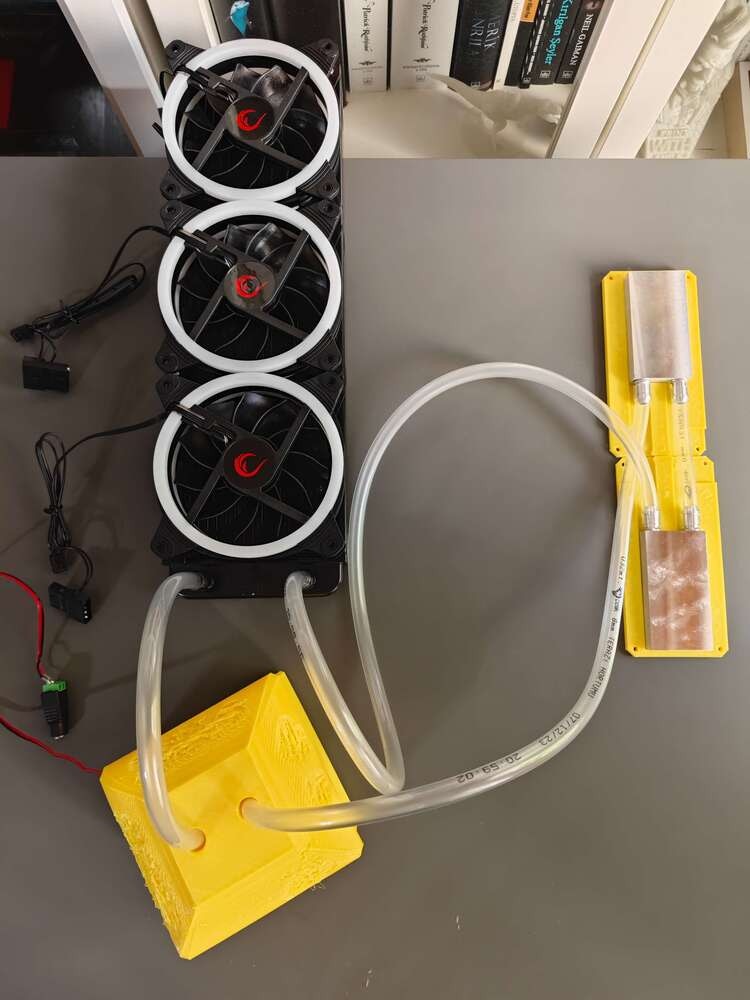
:hash: I created the closed-loop water cooling system by making connections via plastic tubing respectively: Water Pump OUT ➜ Radiator IN ➜ Radiator OUT ➜ First Aluminum Block IN ➜ First Aluminum Block OUT ➜ Second Aluminum Block IN ➜ Second Aluminum Block OUT ➜ Custom Water Reservoir IN
Radiator and three RGB fans attached to the coolant loop

228

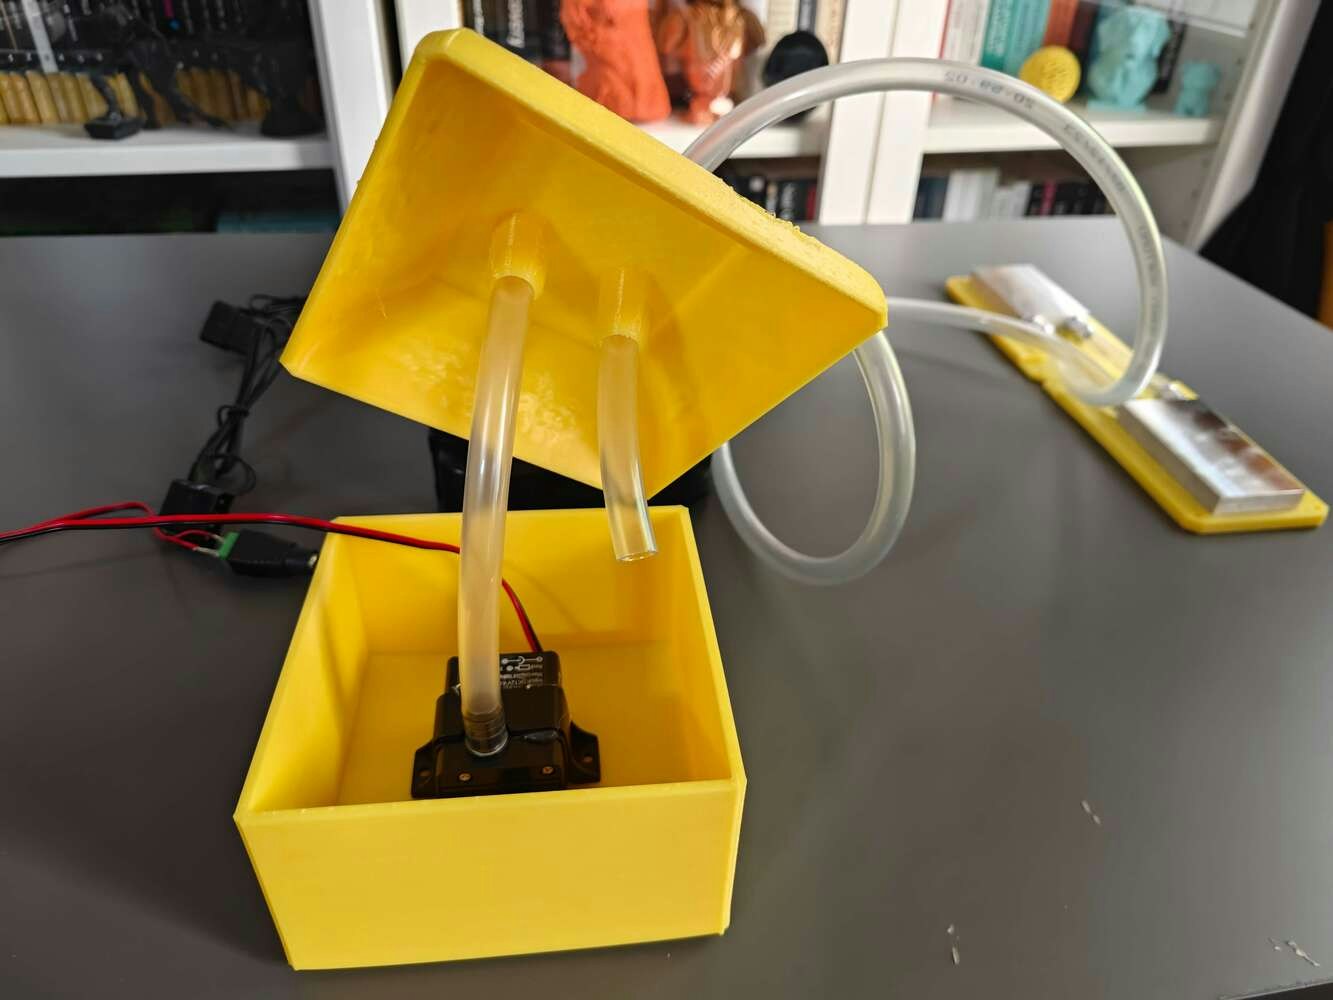
:hash: Finally, I fastened the water pump into the custom water reservoir and passed the cooling system IN and OUT tubing through the built-in plastic fittings on the reservoir top cover. Since I utilized TPU flexible filament to print the custom water cooling parts, I did not encounter any issues while connecting plastic tubing or circulating water through the system.
Reservoir, pump, radiator, and cooling blocks joined into a closed loop

229


Filled water-cooling loop circulating through the simplified HVAC system

230

After completing the simplified closed-loop water cooling system, I started to work on combining PCBs, 3D parts, and the remaining components. :hash: First, I attached the Kyogre PCB to its unique encasement affixed to the right radiator mount.
Full HVAC monitoring system assembly step 1, aligning parts from an angled view with the radiator, reservoir, CNC rig, and dashboard

231

:hash: Then, I made the required connections between the ULN2003 driver board and the Kyogre PCB via jumper wires.
Full HVAC monitoring system assembly step 2, fastening parts in a top view with the radiator, reservoir, CNC rig, and dashboard

232

:hash: I fastened the micro switch (JL024-2-026) to its connector attached to the left CNC stand and made the required connections between the micro switch and the Kyogre PCB via jumper wires.
Full HVAC monitoring system assembly step 3, mounting parts in a side view with the radiator, reservoir, CNC rig, and dashboard

233

:hash: I attached the Groudon PCB to its unique encasement affixed to the right CNC stand.
Full HVAC monitoring system assembly step 4, routing parts in a close-up with the radiator, reservoir, CNC rig, and dashboard

234

:hash: I fastened the MLX90641 thermal imaging camera to its slot on the thermal camera container head via the hot glue gun. Then, I made the required connections between the thermal imaging camera and the Groudon PCB by extending the Grove 4-pin connection cable via jumper wires.
Full HVAC monitoring system assembly step 5, checking parts in a fit-check view with the radiator, reservoir, CNC rig, and dashboard

235


Full HVAC monitoring system assembly step 6, reinforcing parts in a mounted view with the radiator, reservoir, CNC rig, and dashboard

236

:hash: I attached the radiator to the radiator mounts in a tilted position and placed the aluminum cooling blocks under the custom CNC router, aligning the thermal imaging camera position.
Full HVAC monitoring system assembly step 7, seating parts in a rear view with the radiator, reservoir, CNC rig, and dashboard

237


Full HVAC monitoring system assembly step 8, joining parts in an exploded view with the radiator, reservoir, CNC rig, and dashboard

238

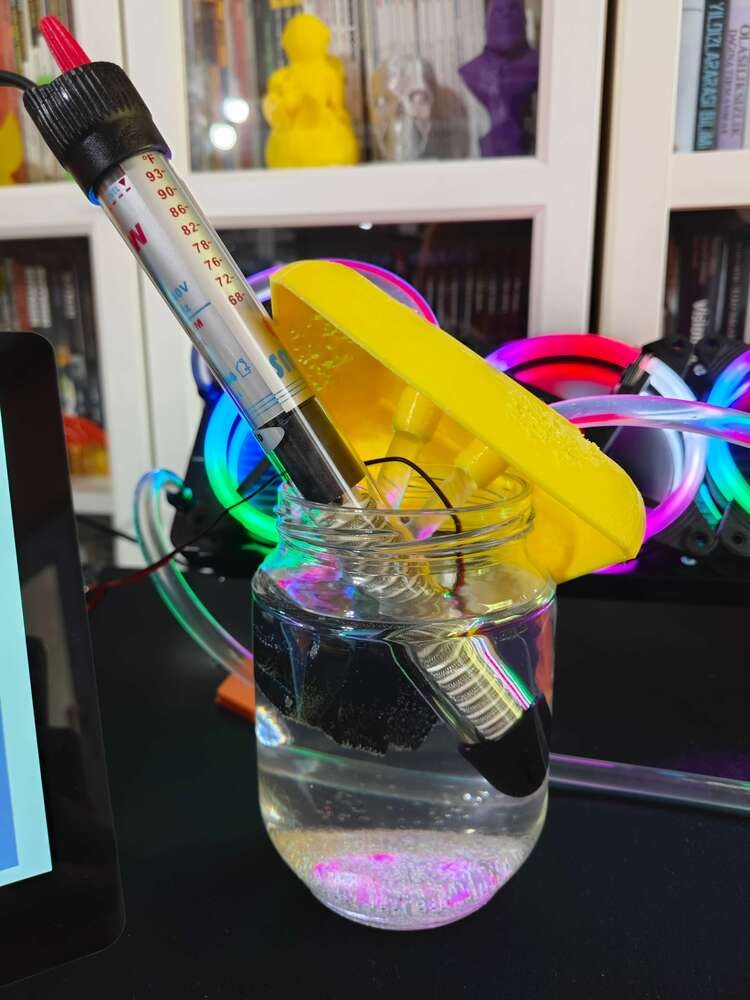
:hash: While conducting experiments with the completed HVAC system, I noticed the custom reservoir started leaking after changing color. I assume the reason is that the color-changing additives in the TPU filament slightly distort the infill shape of the bottom of the 3D-printed reservoir. Thus, I employed a glass jar as the reservoir to replace the leaking one.
Full HVAC monitoring system assembly step 9, finishing parts in a detail view highlighting the simulated faulty cooling component in the radiator, reservoir, CNC rig, and dashboard

239


Full HVAC monitoring system assembly step 10, positioning parts in a front view highlighting the simulated faulty cooling component in the radiator, reservoir, CNC rig, and dashboard

240

:hash: To showcase the web dashboard, I connected the CrowVision 11.6” touchscreen module to LattePanda Mu via an HDMI to Mini-HDMI cable. Since I placed the Lite Carrier board into its custom flexible case, I did not encounter any issues while connecting peripherals to LattePanda Mu.
Full HVAC monitoring system assembly step 11, aligning parts from an angled view with the radiator, reservoir, CNC rig, and dashboard

241


Full HVAC monitoring system assembly step 12, fastening parts in a top view with the radiator, reservoir, CNC rig, and dashboard

242


Full HVAC monitoring system assembly step 13, mounting parts in a side view with the radiator, reservoir, CNC rig, and dashboard

243


Full HVAC monitoring system assembly step 14, routing parts in a close-up with the radiator, reservoir, CNC rig, and dashboard

244

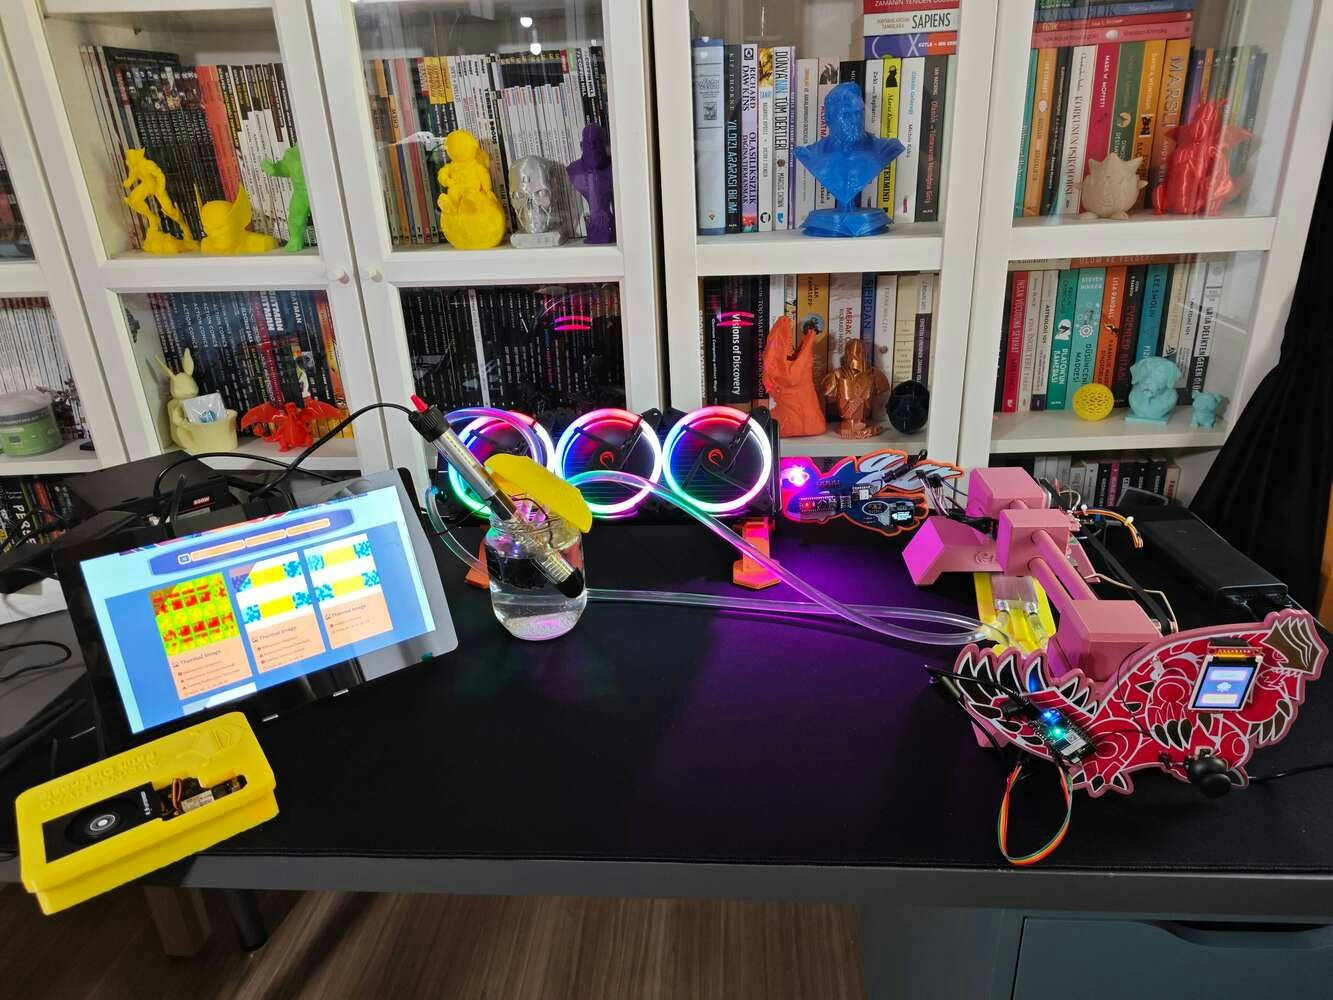
After concluding all of the mentioned assembly stages, I started to conduct experiments to simulate and detect HVAC system cooling malfunctions.
Full HVAC monitoring system assembly step 15, checking parts in a fit-check view with the radiator, reservoir, CNC rig, and dashboard

245


Full HVAC monitoring system assembly step 16, reinforcing parts in a mounted view with the radiator, reservoir, CNC rig, and dashboard

246


Full HVAC monitoring system assembly step 17, seating parts in a rear view with the completed build in place alongside the radiator, reservoir, CNC rig, and dashboard

247

Step 4: Creating an account to utilize Twilio’s SMS API

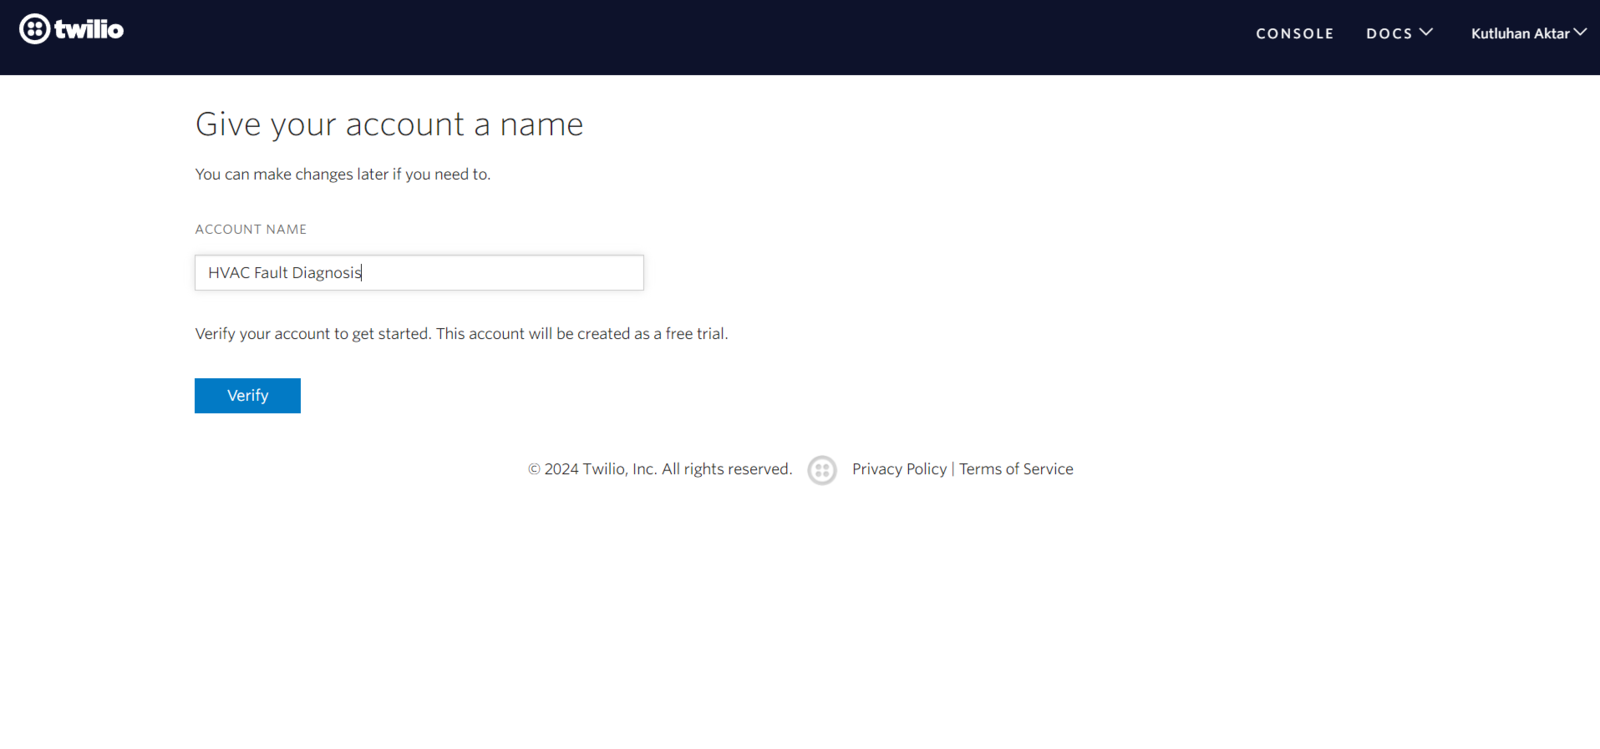
Since I decided to inform the user of the latest diagnosed cooling malfunctions via SMS after running the Audio MFE and visual anomaly detection models consecutively, I decided to utilize Twilio’s SMS API. In this regard, I was also able to transfer the prediction date and the modified resulting image name for further inspection through the web dashboard (application). Twilio provides a trial text messaging service to transfer an SMS from a virtual phone number to a verified phone number internationally. Also, Twilio supports official helper libraries for different programming languages, including PHP, enforcing its suite of APIs. :hash: First of all, sign up for Twilio and navigate to the Account page to utilize the default (first) account or create a new account. I noticed that creating free subsidiary accounts (projects) more than once may lead to the permanent suspension of a Twilio user account. So, I recommend using the default trial account or a previously created account if you have multiple iterations or did not subscribe to a paid plan.
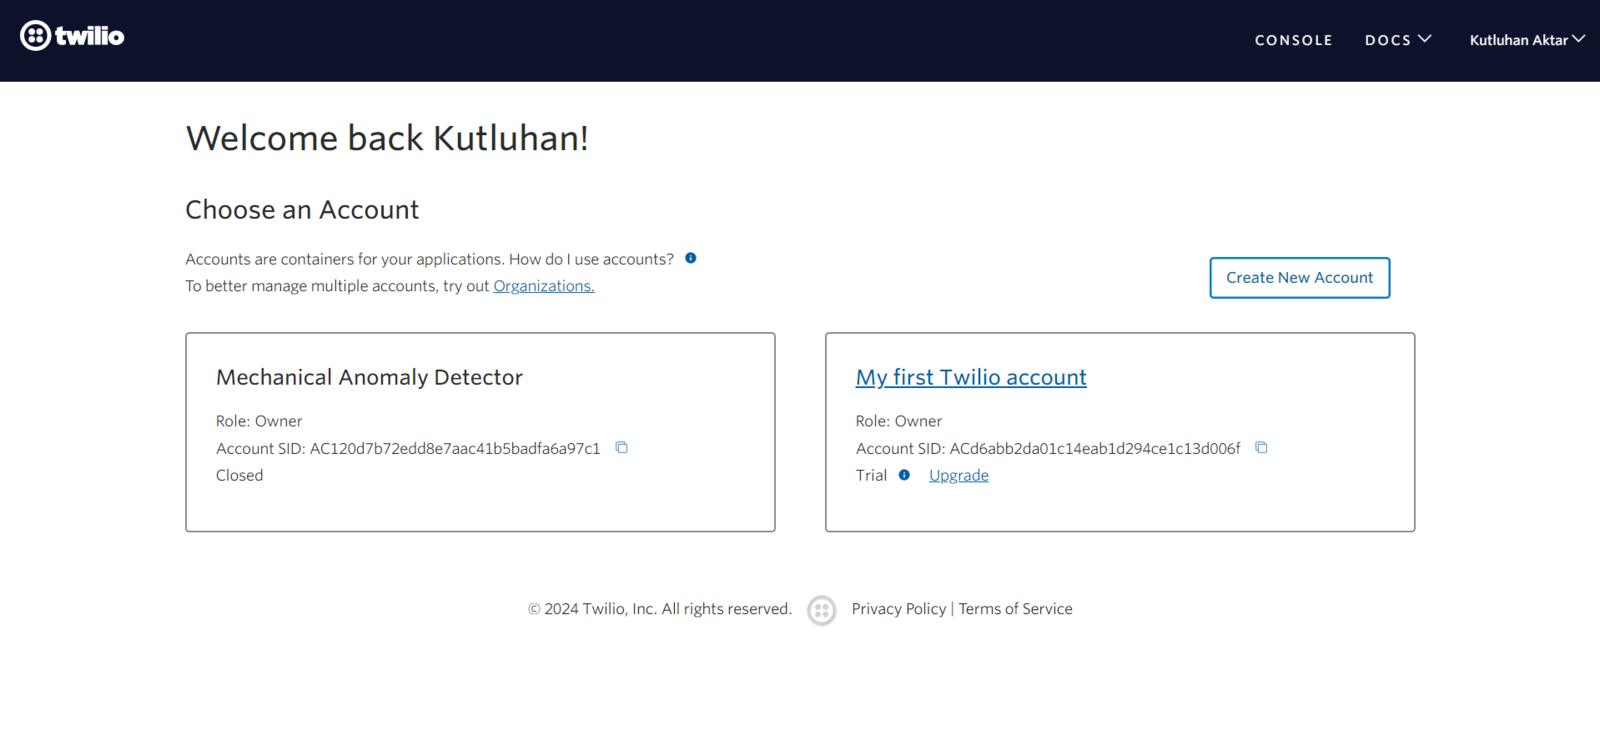
Twilio sign-up page for creating the trial messaging account

248


Twilio account overview showing the default project selection

249

:hash: After verifying a phone number for the selected account (project), set the initial account settings for SMS in PHP.
Twilio verified caller IDs page for adding a phone number

250

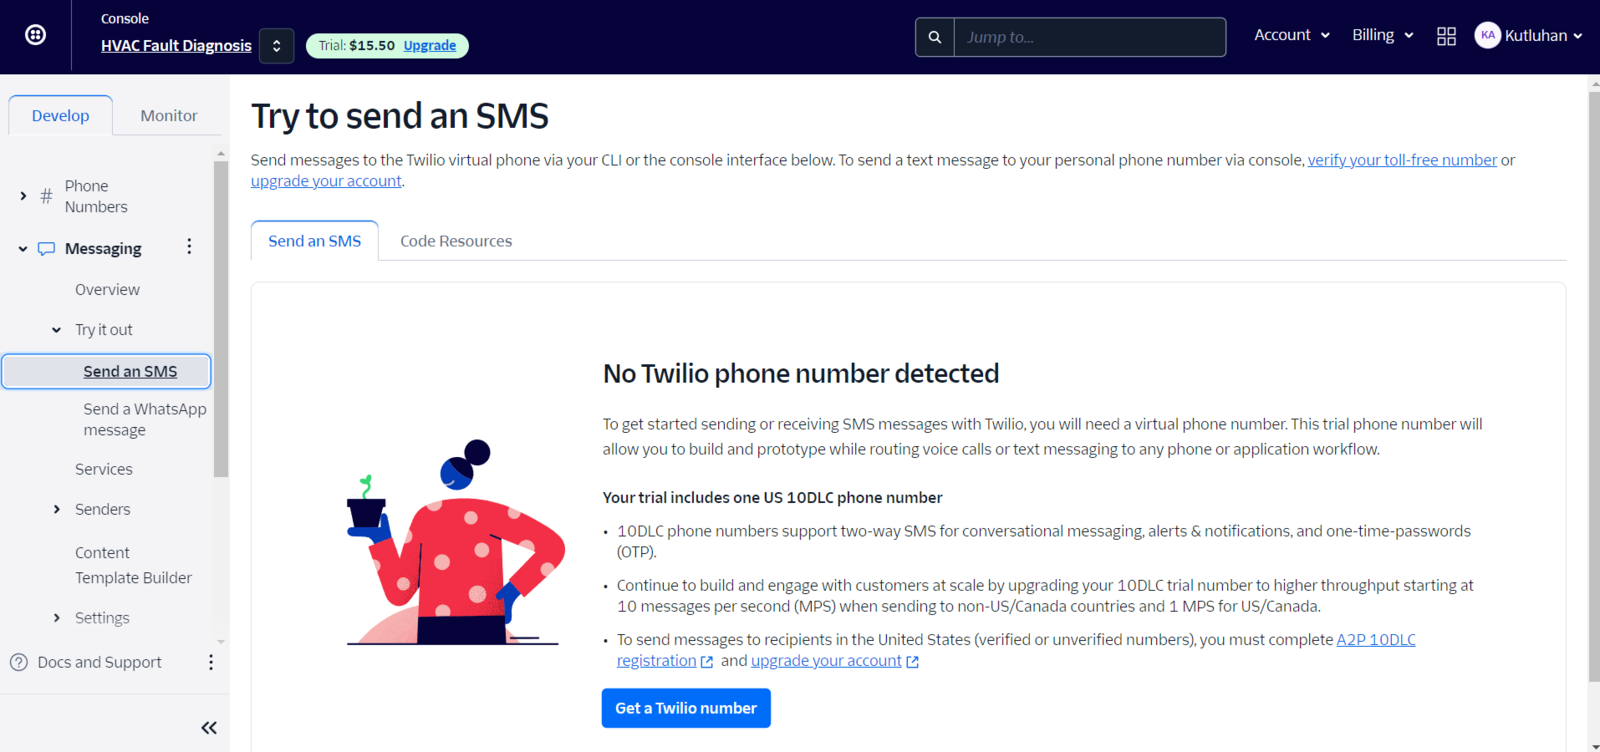
:hash: To configure the SMS settings, go to Messaging ➡ Send an SMS. :hash: Since a virtual phone number is required to transfer an SMS via Twilio, click Get a Twilio number.
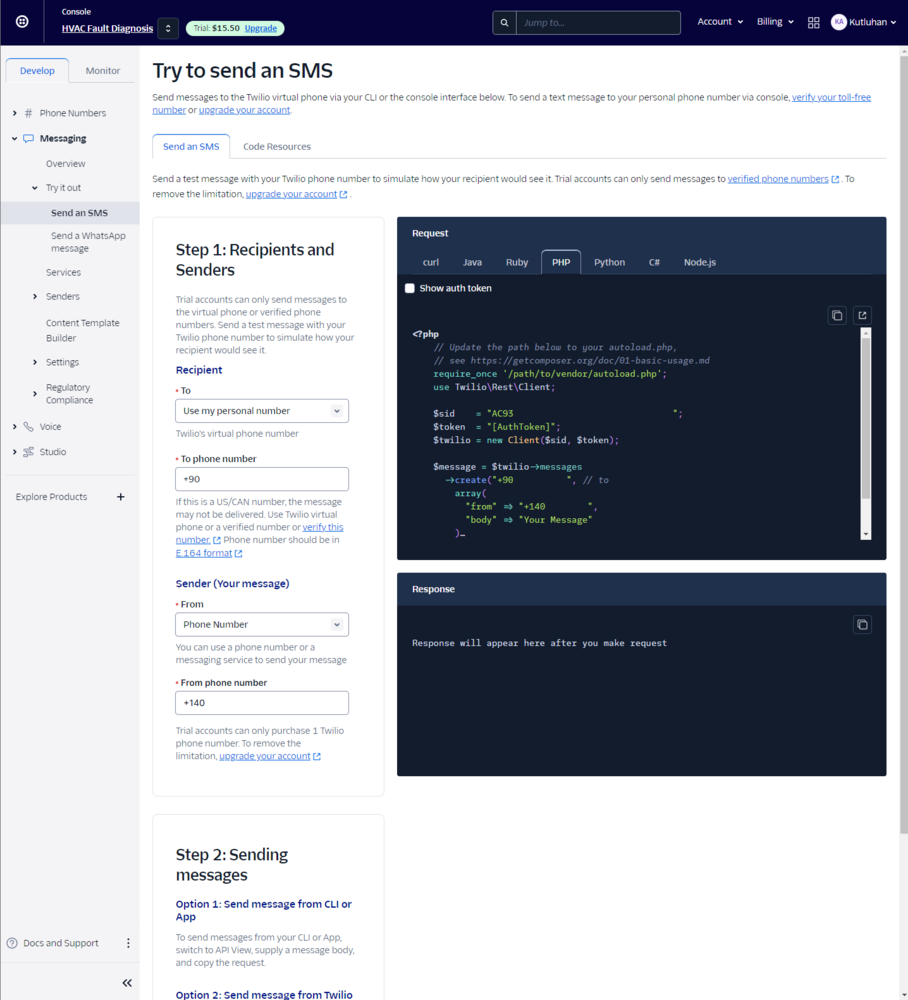
Twilio messaging quickstart page for sending an SMS from PHP

251

Since Twilio provides a free 10DLC virtual phone number for each trial account, Twilio allows the user to utilize the text messaging service immediately after activating the given virtual phone number. :hash: After obtaining the free virtual phone number, download the Twilio PHP Helper Library to send an SMS via the web dashboard.
Twilio console prompt for getting a virtual trial phone number

252

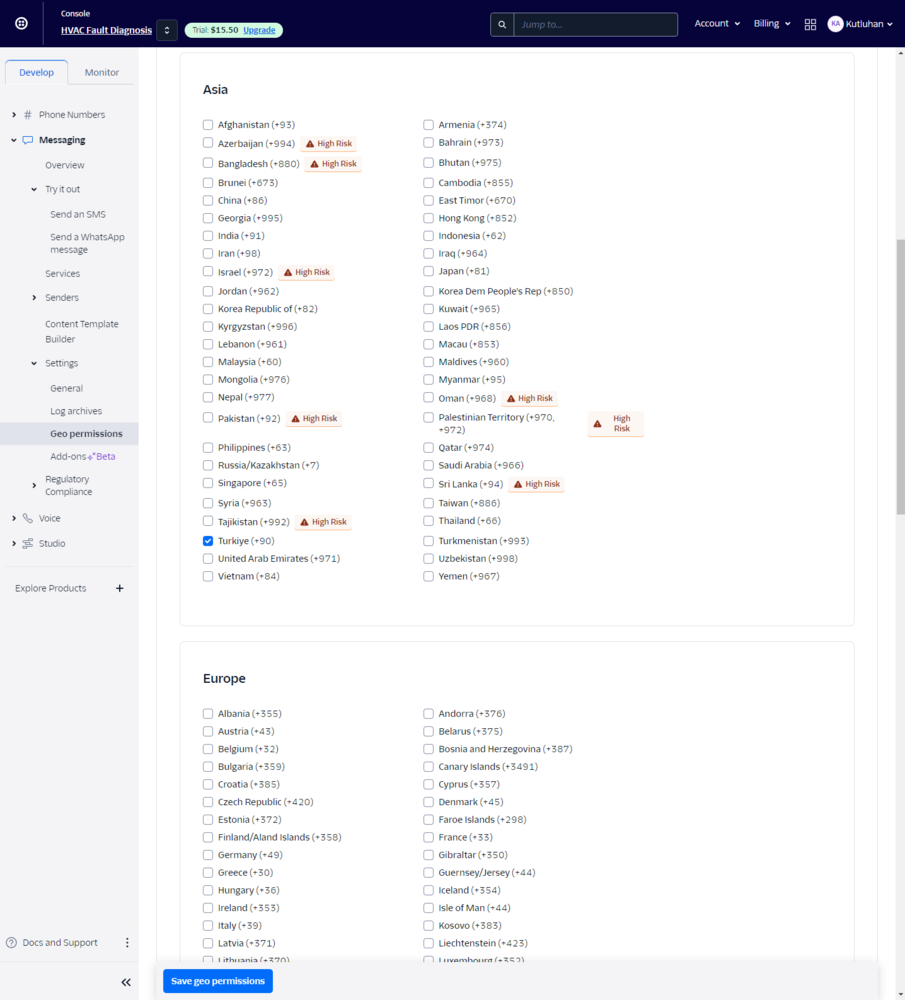
:hash: Finally, go to Geo permissions to adjust the allowed recipients depending on your region.
Twilio SMS configuration page with account SID, token, and phone numbers

253

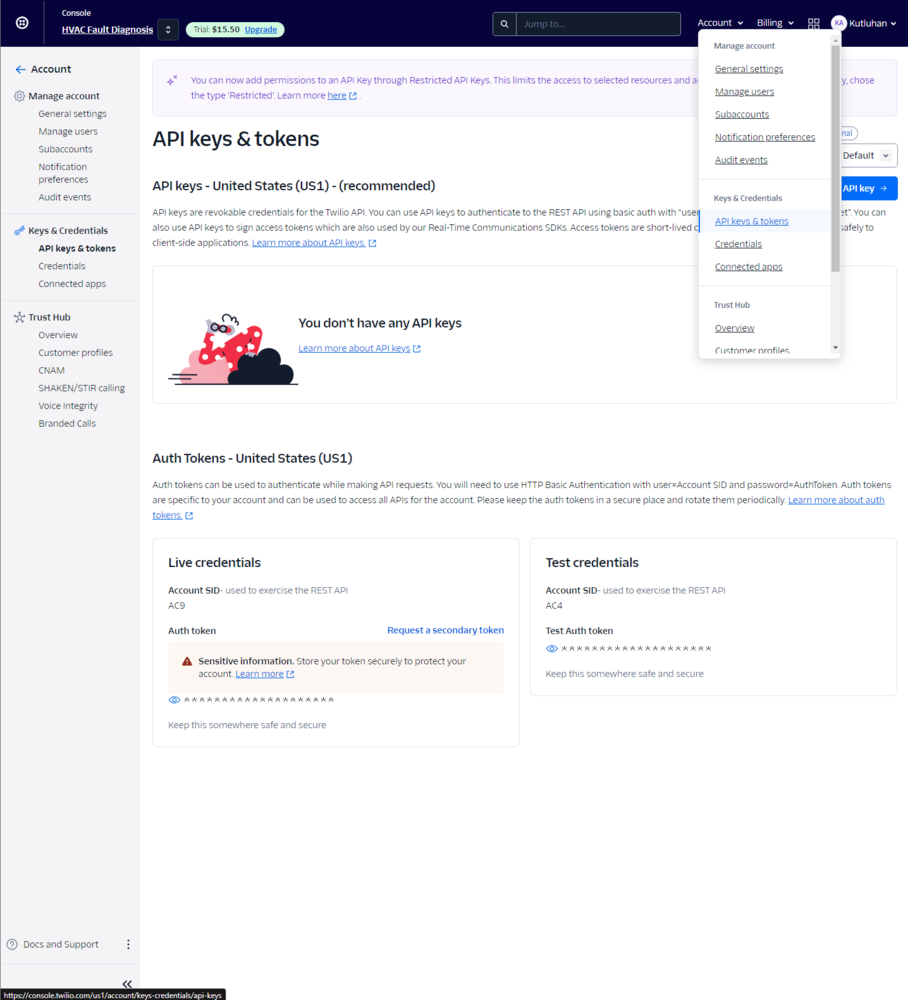
:hash: After configuring the required settings, go to Account ➡ API keys & tokens to get the account SID and the auth token under Live credentials to be able to employ Twilio’s SMS API to send SMS.
Twilio console confirming the messaging setup for the HVAC notification workflow

254

Step 5.0: Setting up the XAMPP application and the required Python modules on LattePanda Mu (Ubuntu 22.04)

Before starting to develop the web dashboard (application), I needed to configure the required software and Python modules on LattePanda Mu to be able to host the web dashboard, produce thermal images for data collection, and run the FOMO-AD visual anomaly detection model. Since the web dashboard heavily relies on Python modules, especially for running the FOMO-AD model via the Edge Impulse Linux Python SDK, I set up Ubuntu as the operating system for LattePanda Mu. As I was working on this device, Ubuntu 22.04 was officially supported by LattePanda Mu. You can inspect the prioritized operating system versions here. Plausibly, the XAMPP application provides an official Linux installer. So, creating a local server with a MariaDB database to host the web dashboard (application) on LattePanda Mu becomes straightforward and effortless. :hash: First, download the XAMPP Linux installer. :hash: After downloading the XAMPP installer, change its permissions via the terminal (command line). sudo chmod 755 /home/kutluhan/Downloads/xampp-linux-x64-8.2.12-0-installer.run
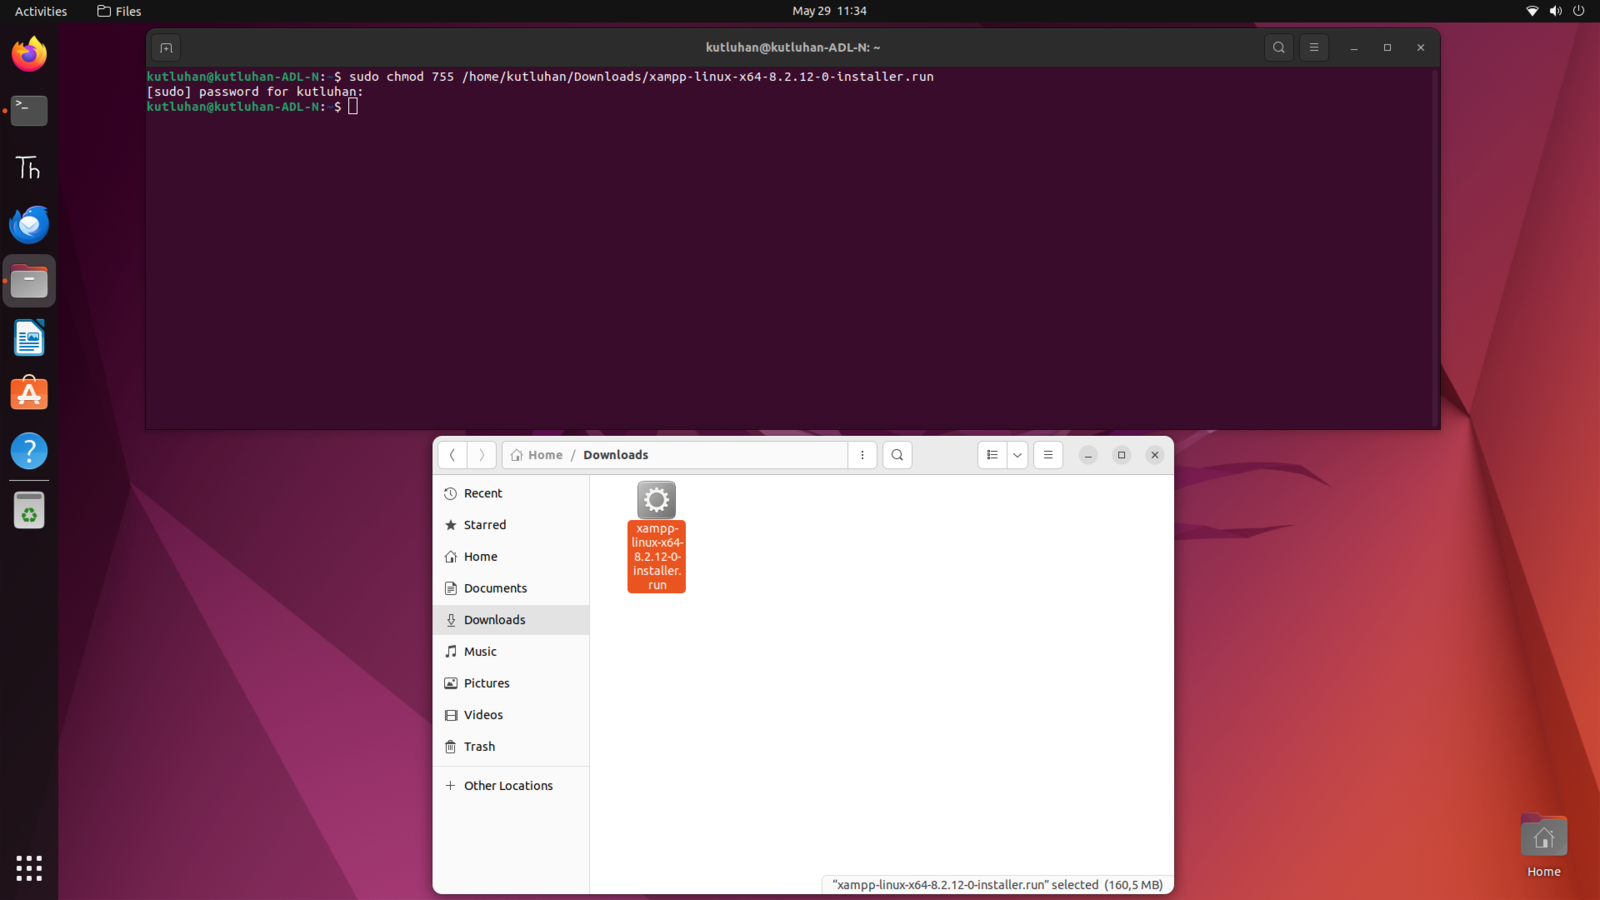
XAMPP Linux installer selected in the Ubuntu downloads folder

255

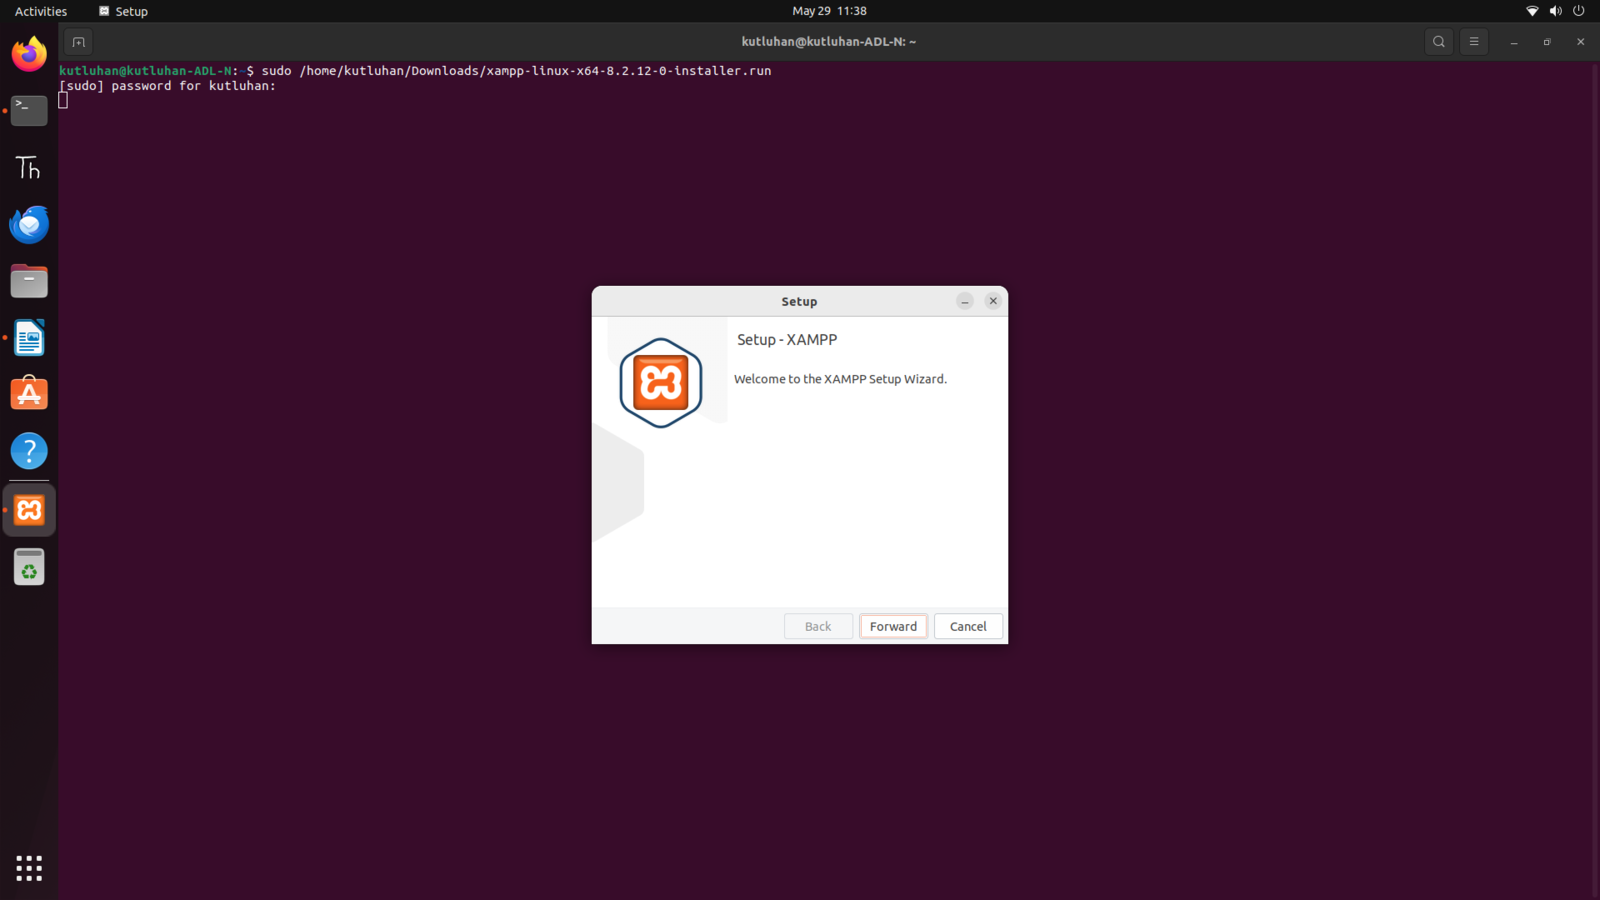
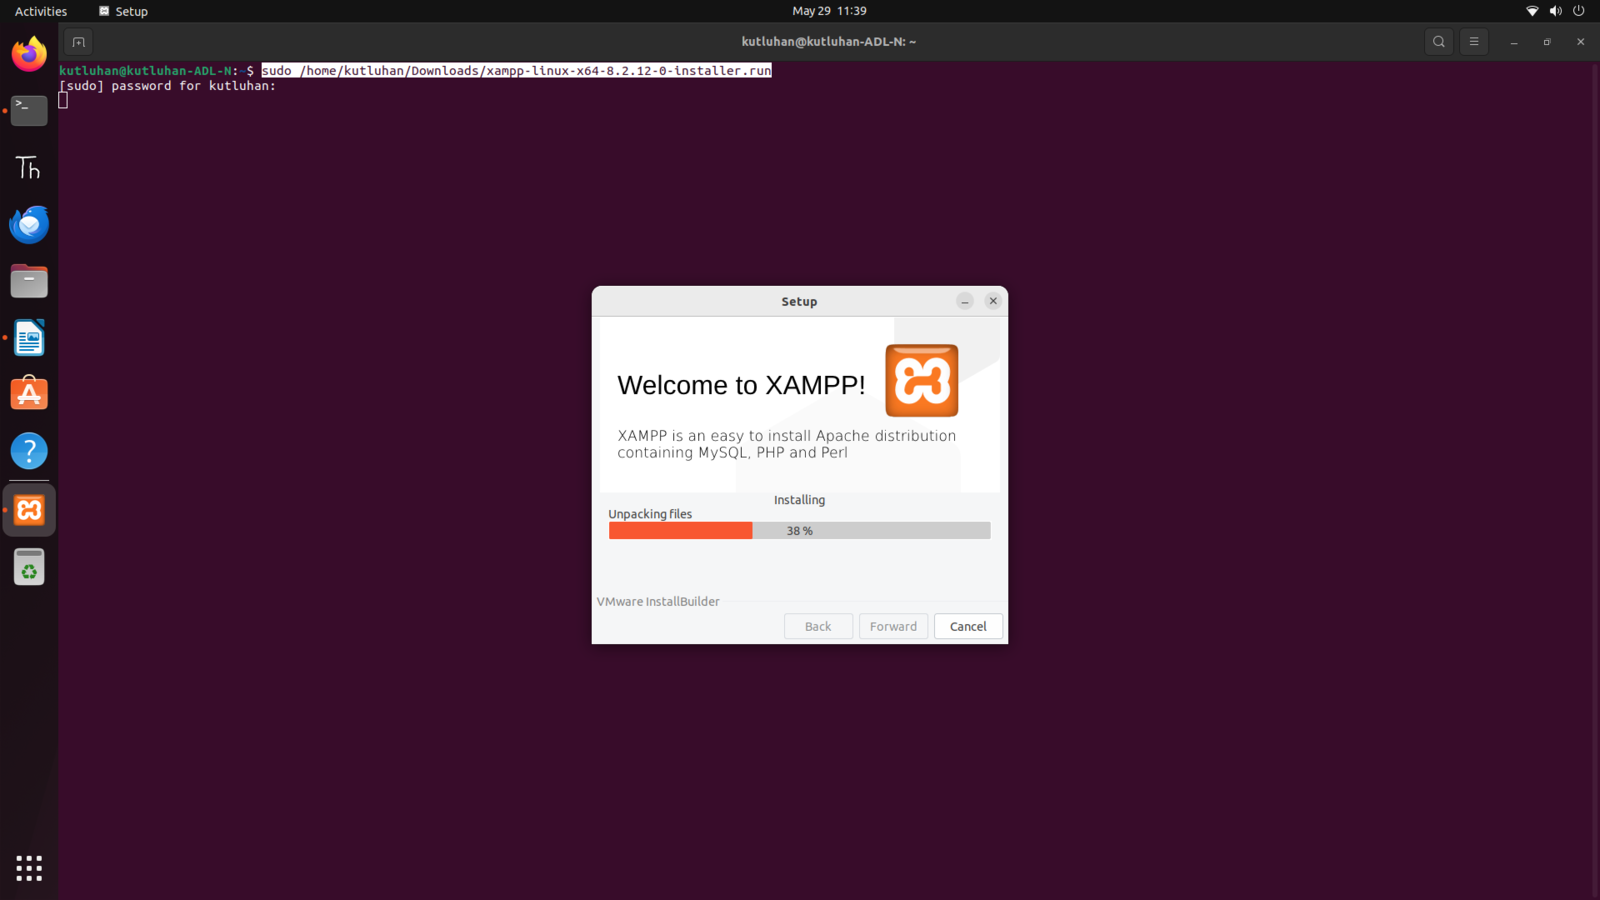
:hash: Then, execute the XAMPP installer via the terminal. sudo /home/kutluhan/Downloads/xampp-linux-x64-8.2.12-0-installer.run
Terminal command changing permissions on the XAMPP installer

256


XAMPP setup wizard running on Ubuntu for the LattePanda Mu server

257

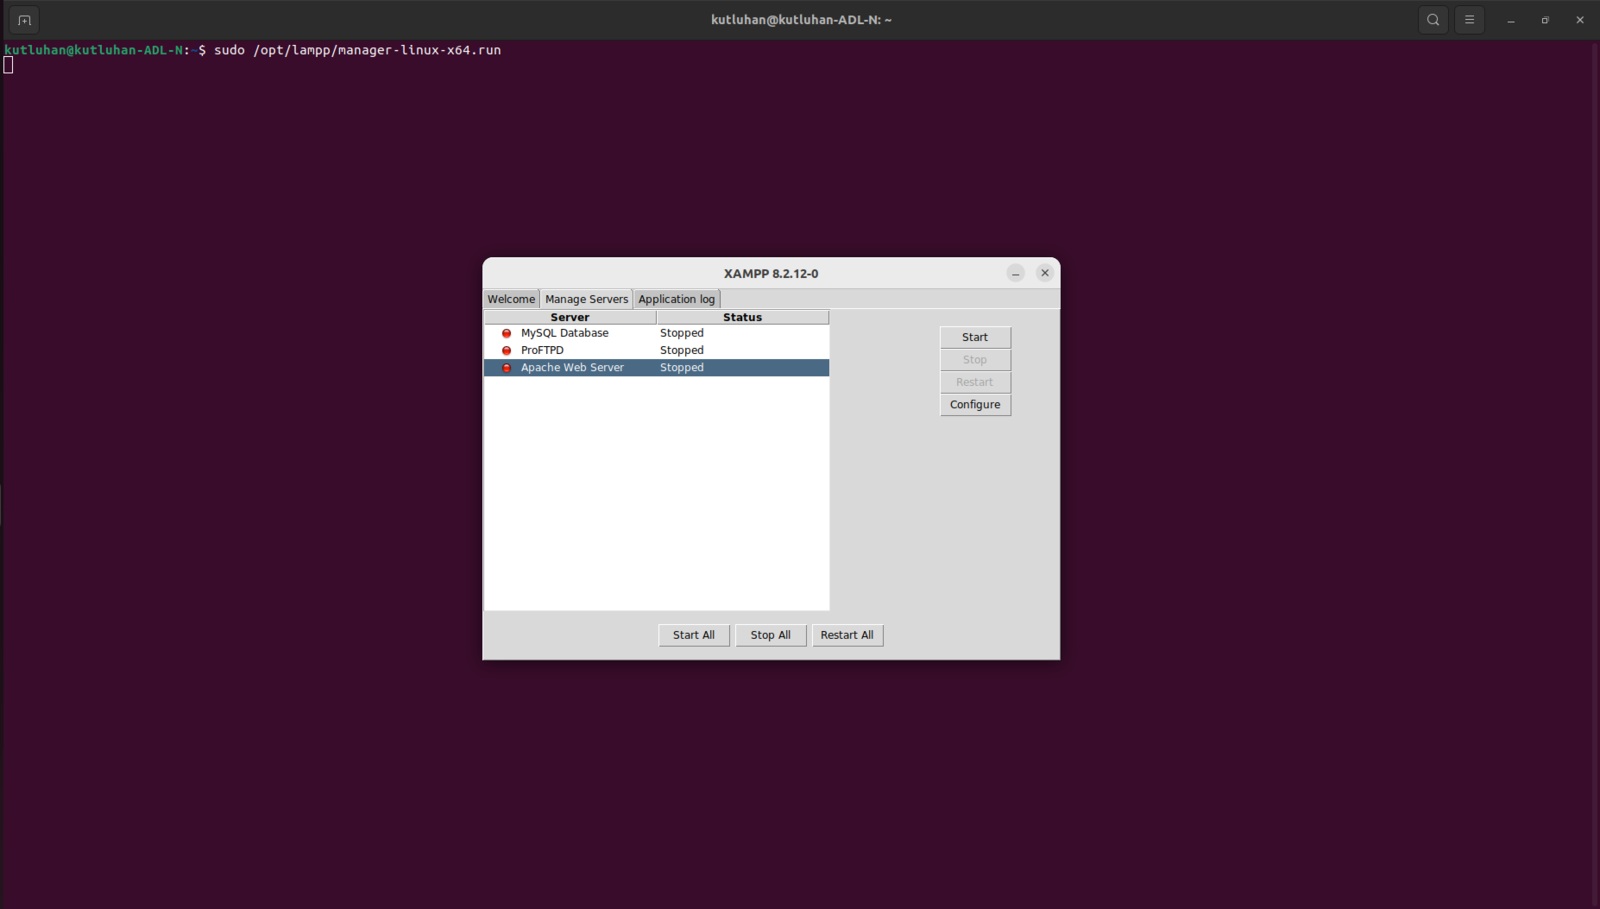
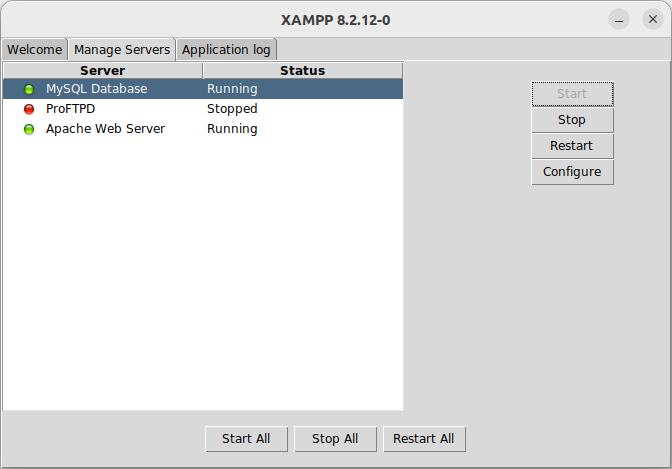
:hash: After configuring the required settings via the installer, run the XAMPP application (lampp) via the terminal. sudo /opt/lampp/manager-linux-x64.run :hash: Since the XAMPP development environment does not create a shortcut on Linux, you always need to use the terminal to launch XAMPP (lampp) unless you enable autostart.
XAMPP control panel with Apache and MariaDB services available

258


Browser opening the local XAMPP start page on LattePanda Mu

259

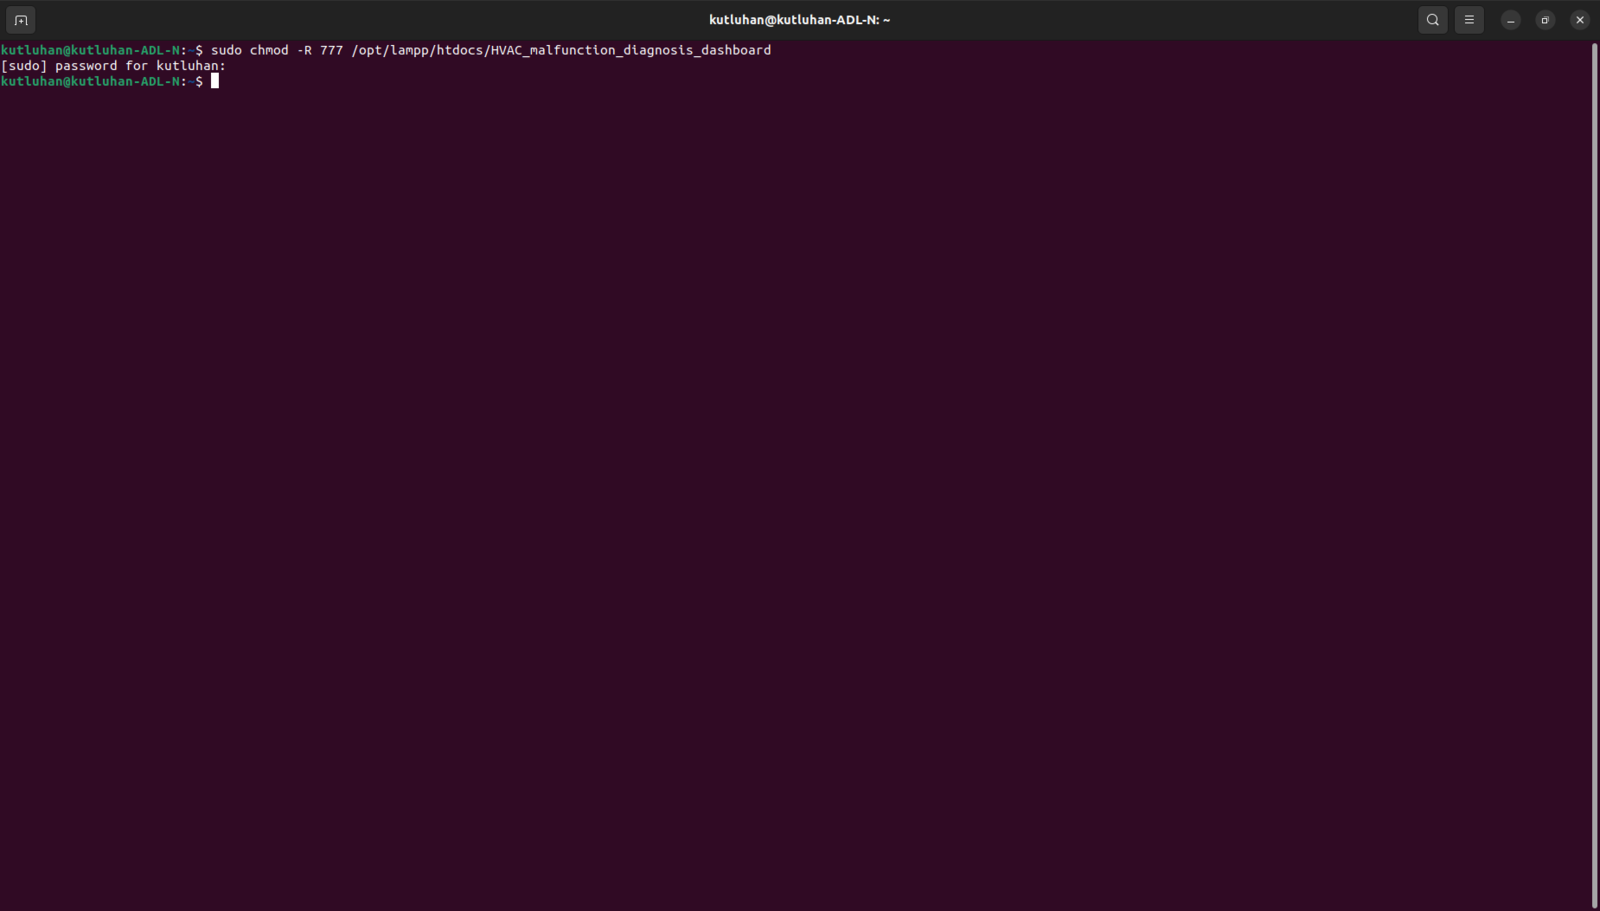
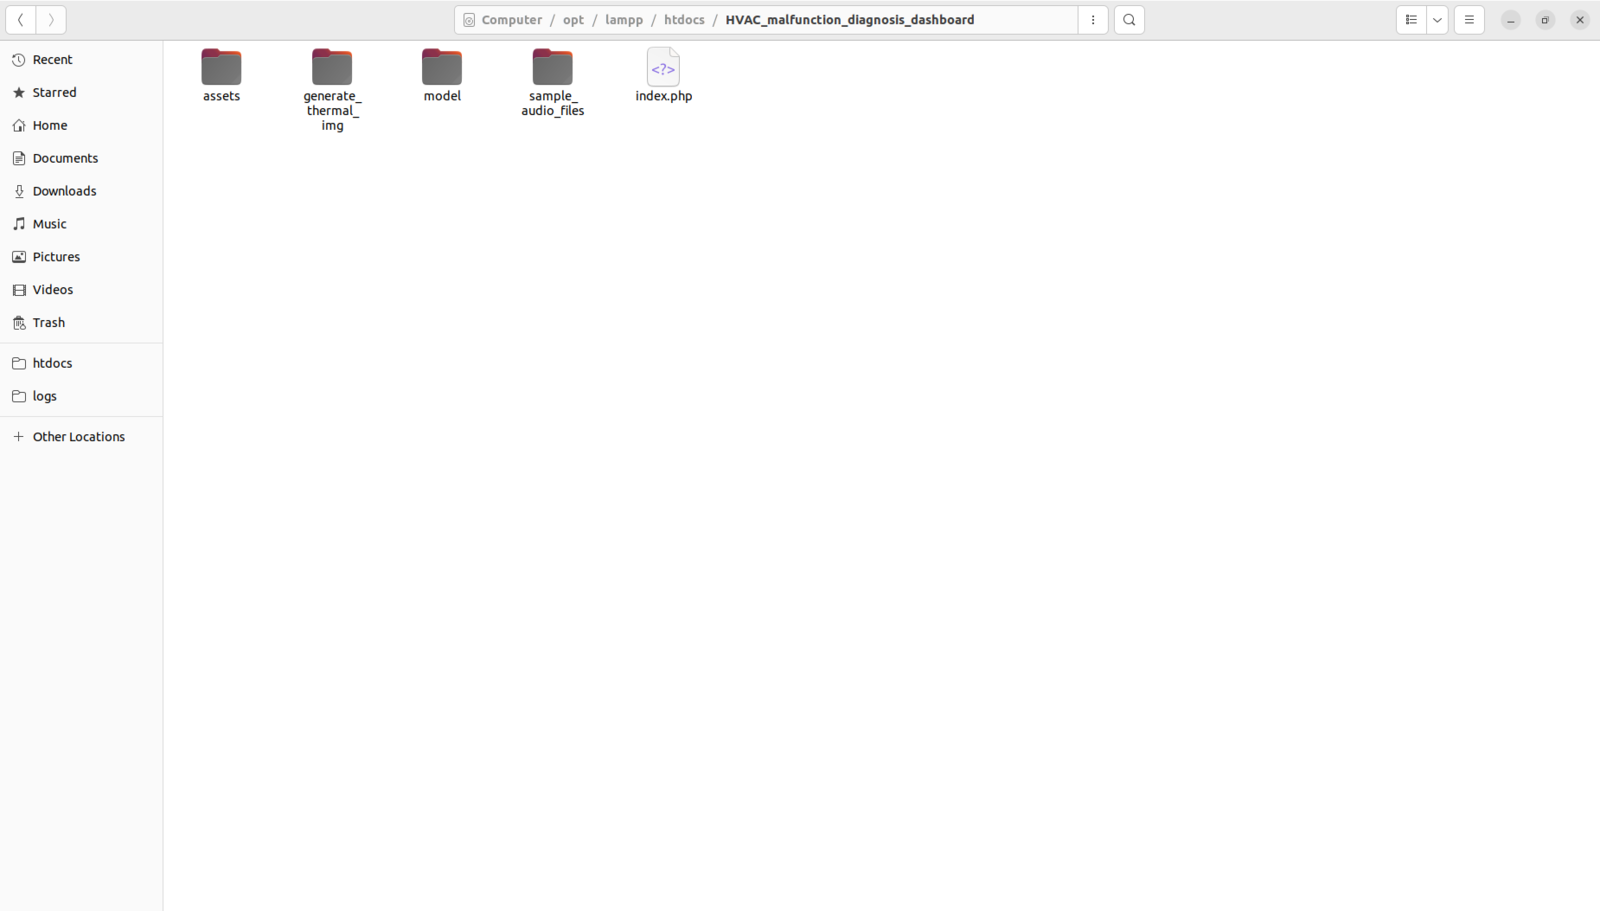
After installing and setting up the XAMPP application (lampp) on LattePanda Mu, I needed to configure some settings to make the web dashboard (application) access the terminal and execute Python scripts. :hash: First, create the web application folder under the lampp folder and change its permissions via the terminal to be able to generate, open, and save files. sudo chmod -R 777 /opt/lampp/htdocs/HVAC_malfunction_diagnosis_dashboard
Apache document root containing the HVAC malfunction diagnosis dashboard files

260

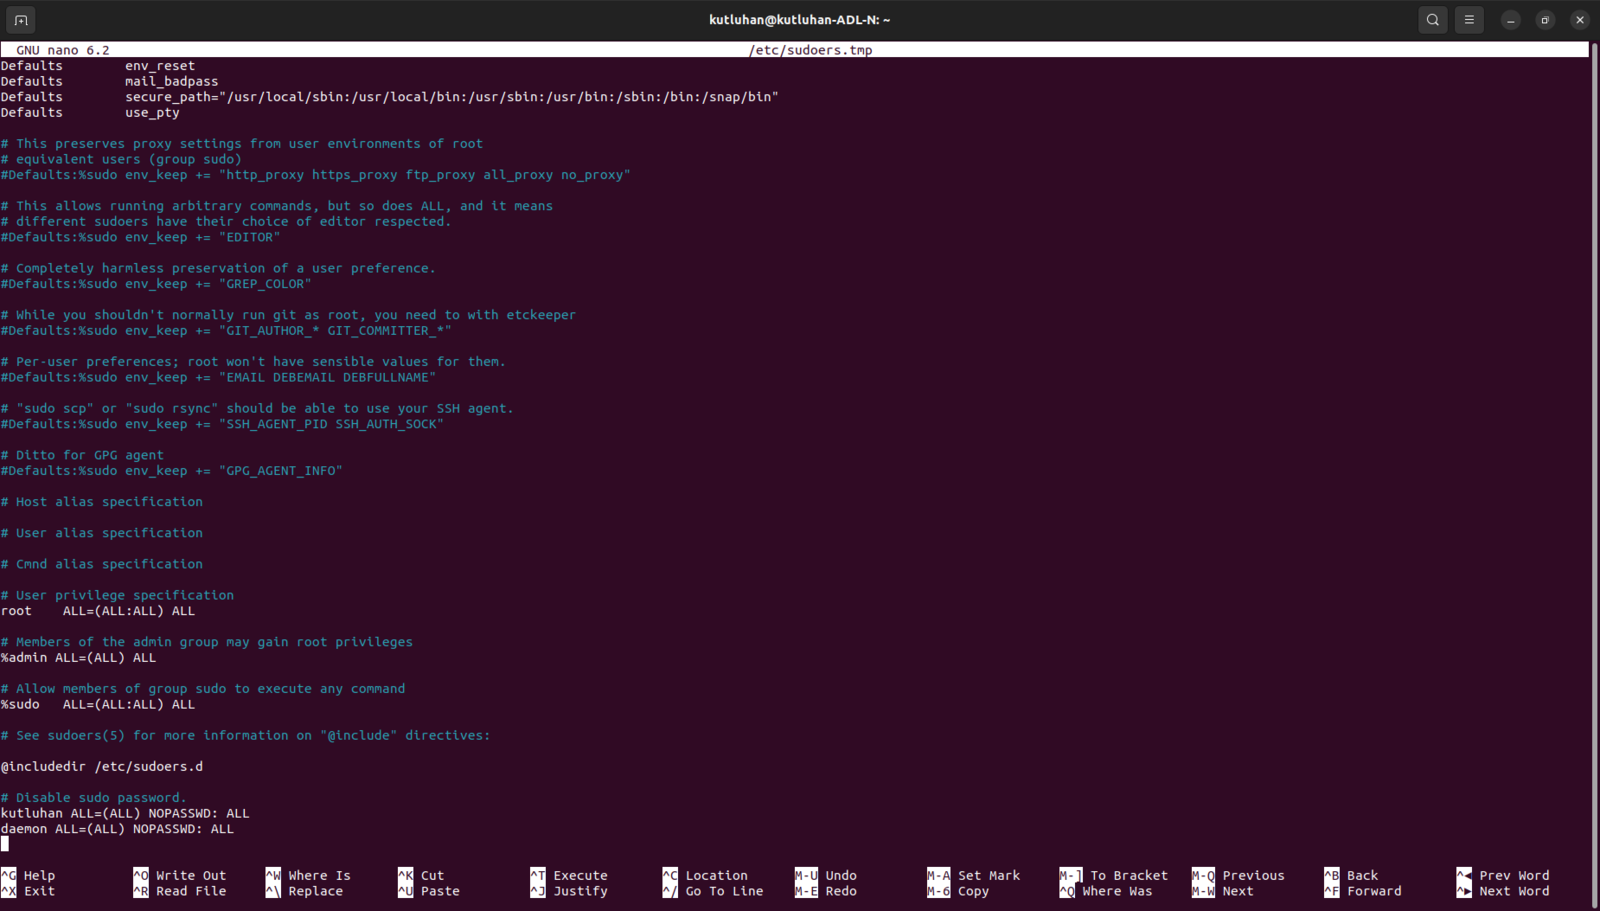
However, even after changing the permissions, the web application cannot access the terminal and utilize the sudo command required to execute necessary Python scripts with the root user (super-user) privileges. Although assigning super-user privileges to different users is a security risk, I decided to give the web application the ability to access the terminal with root user privileges. In this case, it was applicable since the XAMPP application is only operating as a local development environment. :hash: Since we need to edit the sudoers file to change user privileges, open the terminal and utilize the visudo command to alter the sudoers file safely. sudo visudo :hash: Since the XAMPP application (lampp) employs daemon as the user name, add these lines to the end of the sudoers file to enable the web application to run the sudo command without requiring a password.
Browser window opening the locally hosted HVAC dashboard on LattePanda Mu

261

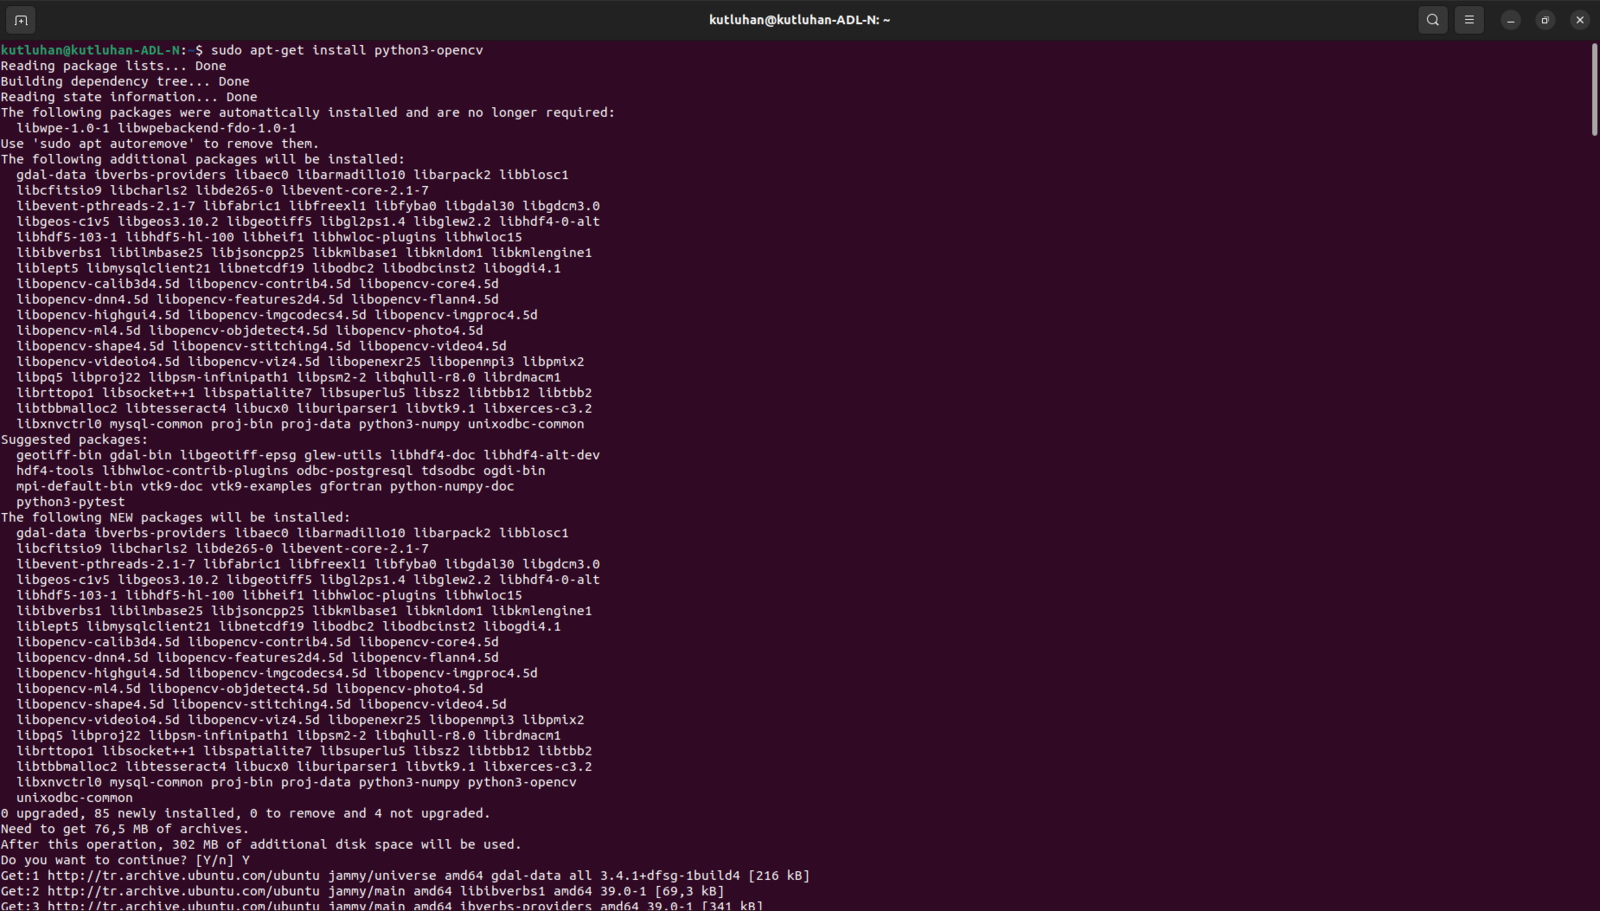
After configuring the required permissions and privileges for the web application, I needed to install the necessary Python modules. :hash: First, install the OpenCV module required to generate and modify thermal images. sudo apt-get install python3-opencv
Ubuntu terminal installing Python modules required by the dashboard scripts

262

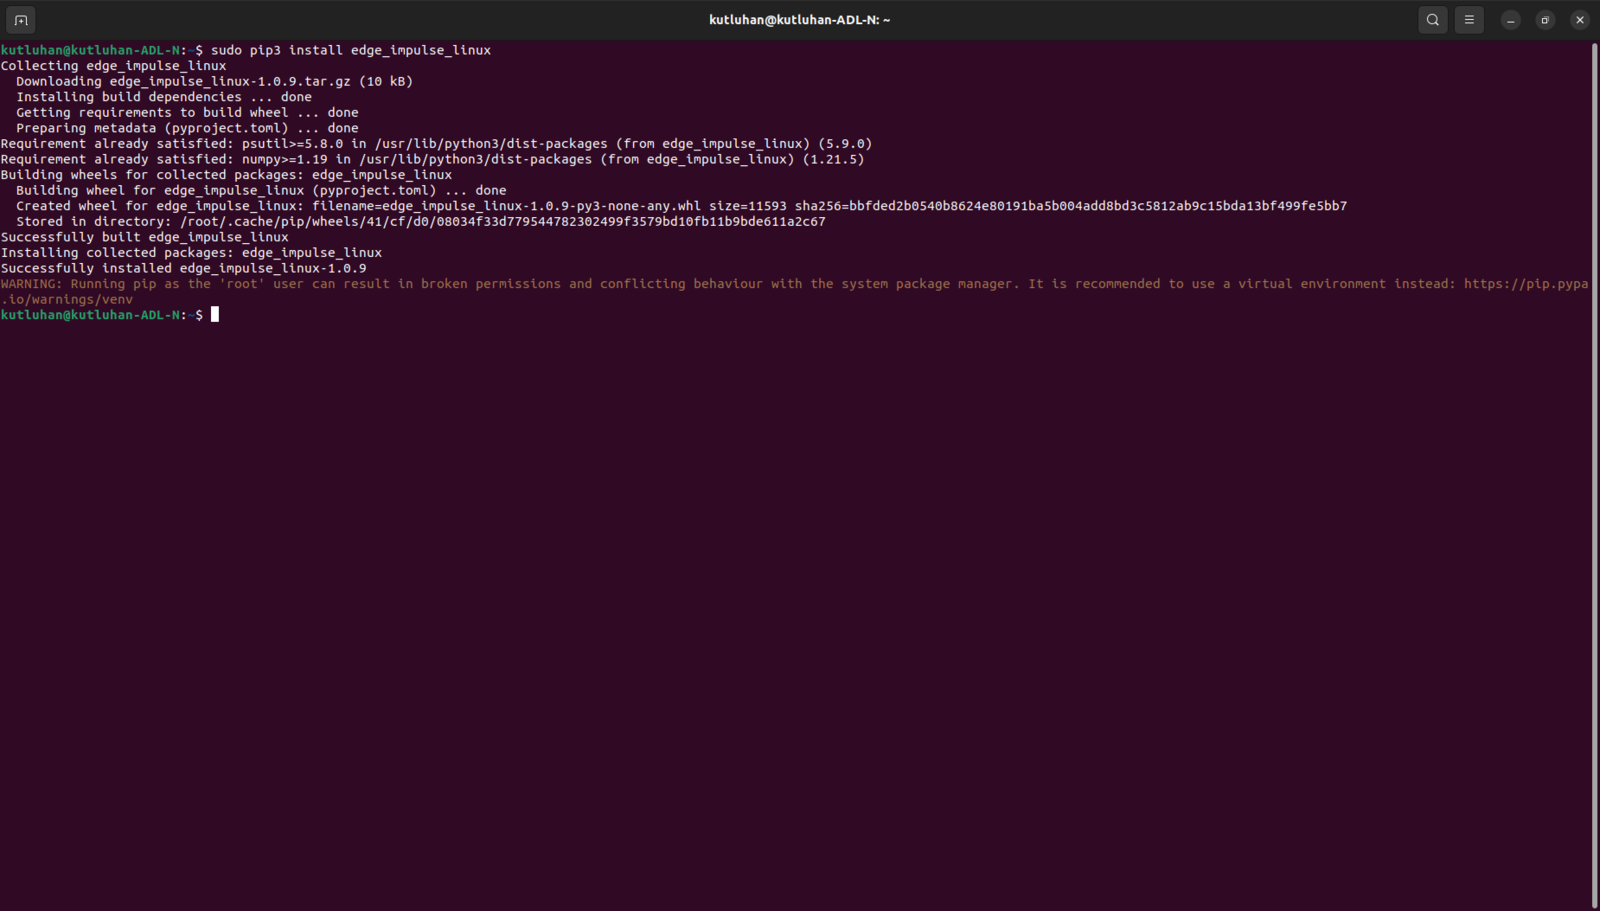
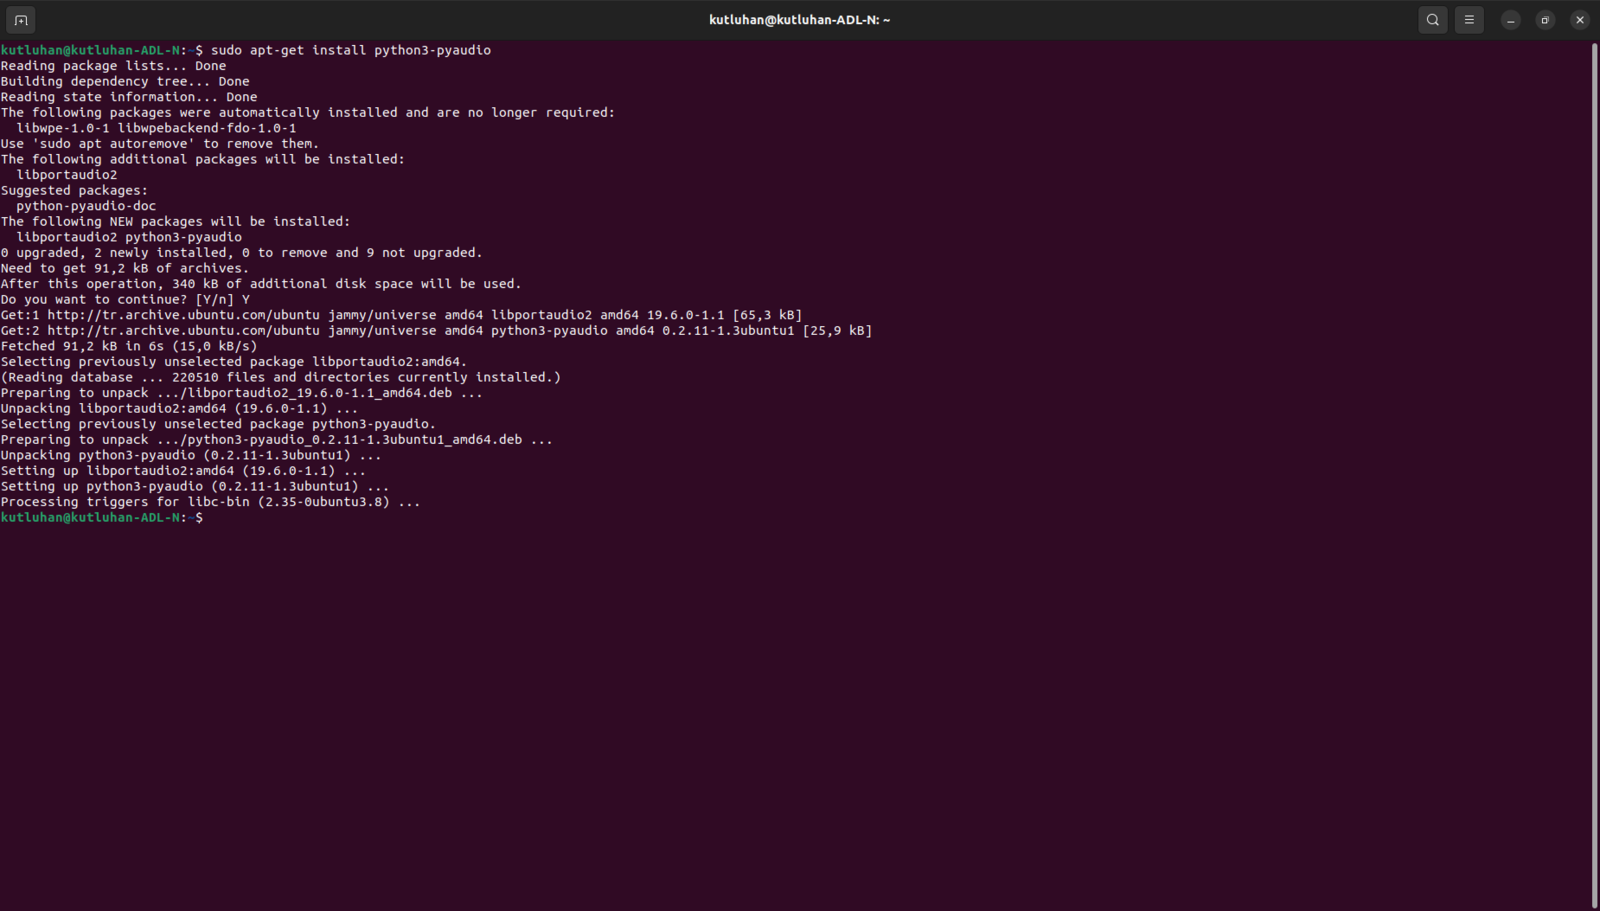
:hash: To run Edge Impulse machine learning models on LattePanda Mu, install the Edge Impulse Linux Python SDK via the terminal. sudo pip3 install edge_impulse_linux sudo apt-get install python3-pyaudio
Terminal output showing Edge Impulse Linux SDK dependencies being installed

263


Python package installation output for OpenCV, NumPy, and supporting modules

264

Step 5: Developing a feature-rich web application to communicate w/ the Particle Cloud and process requests from XIAO ESP32C6

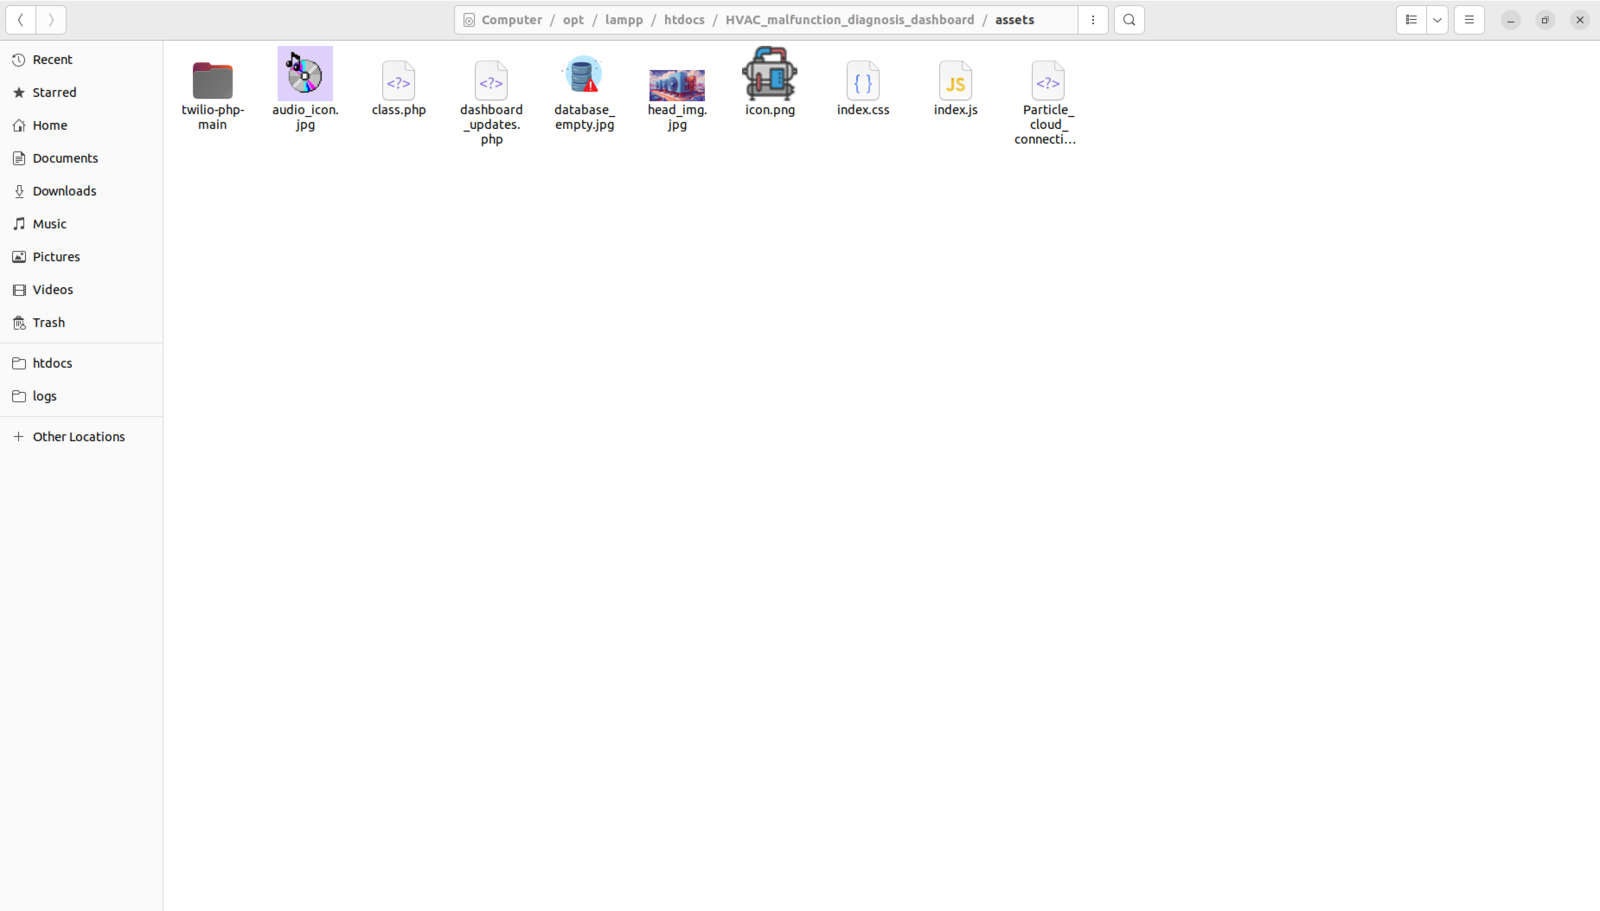
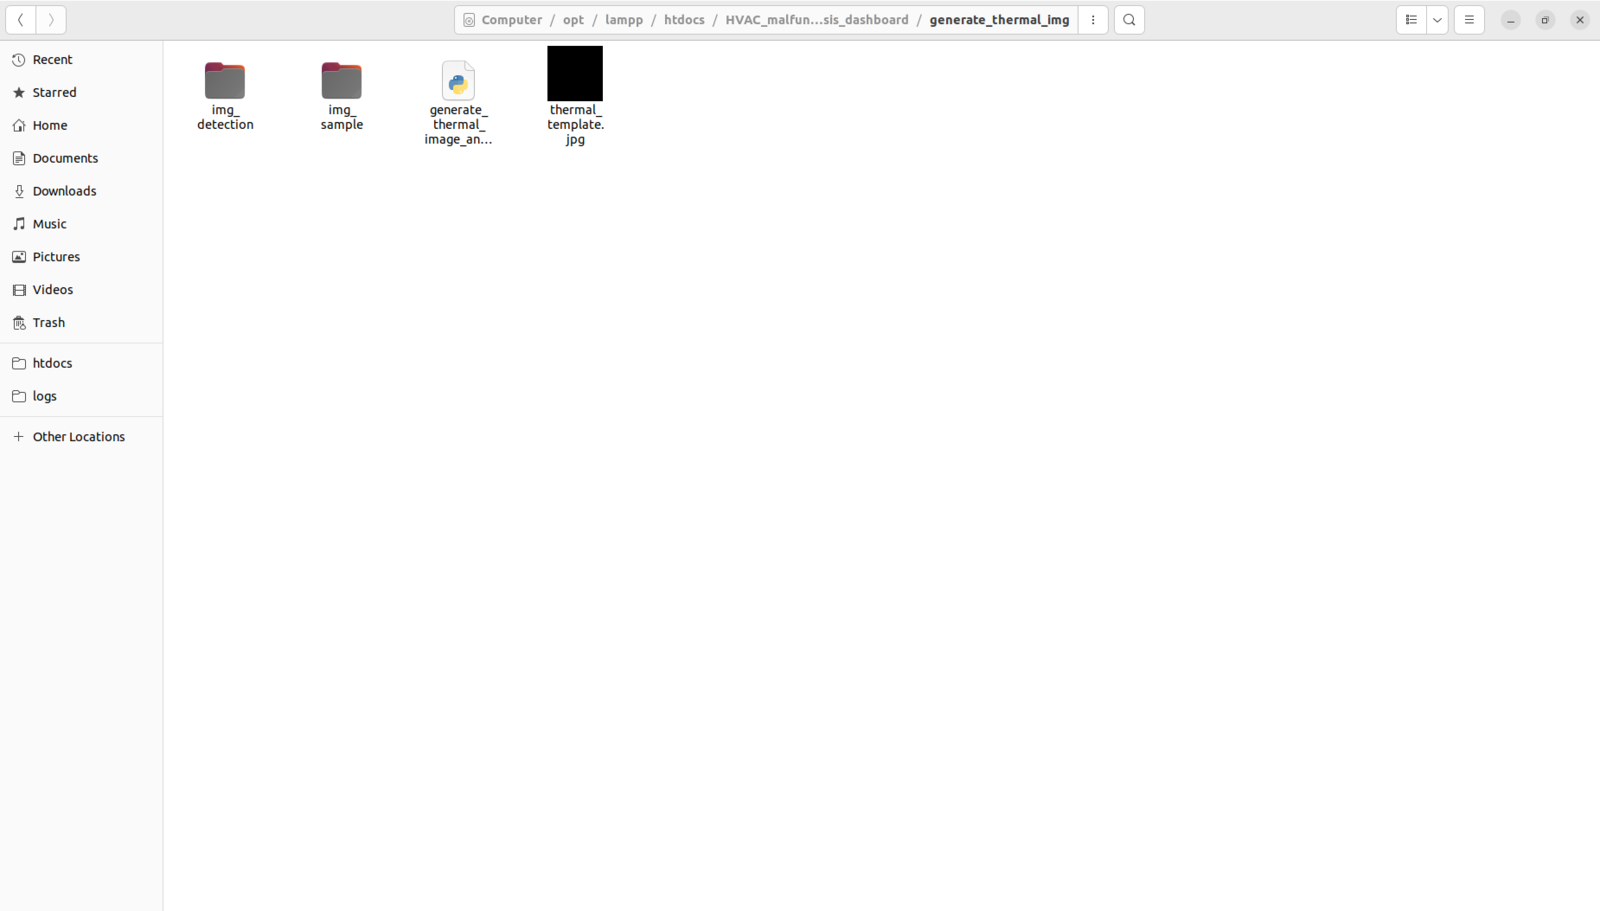
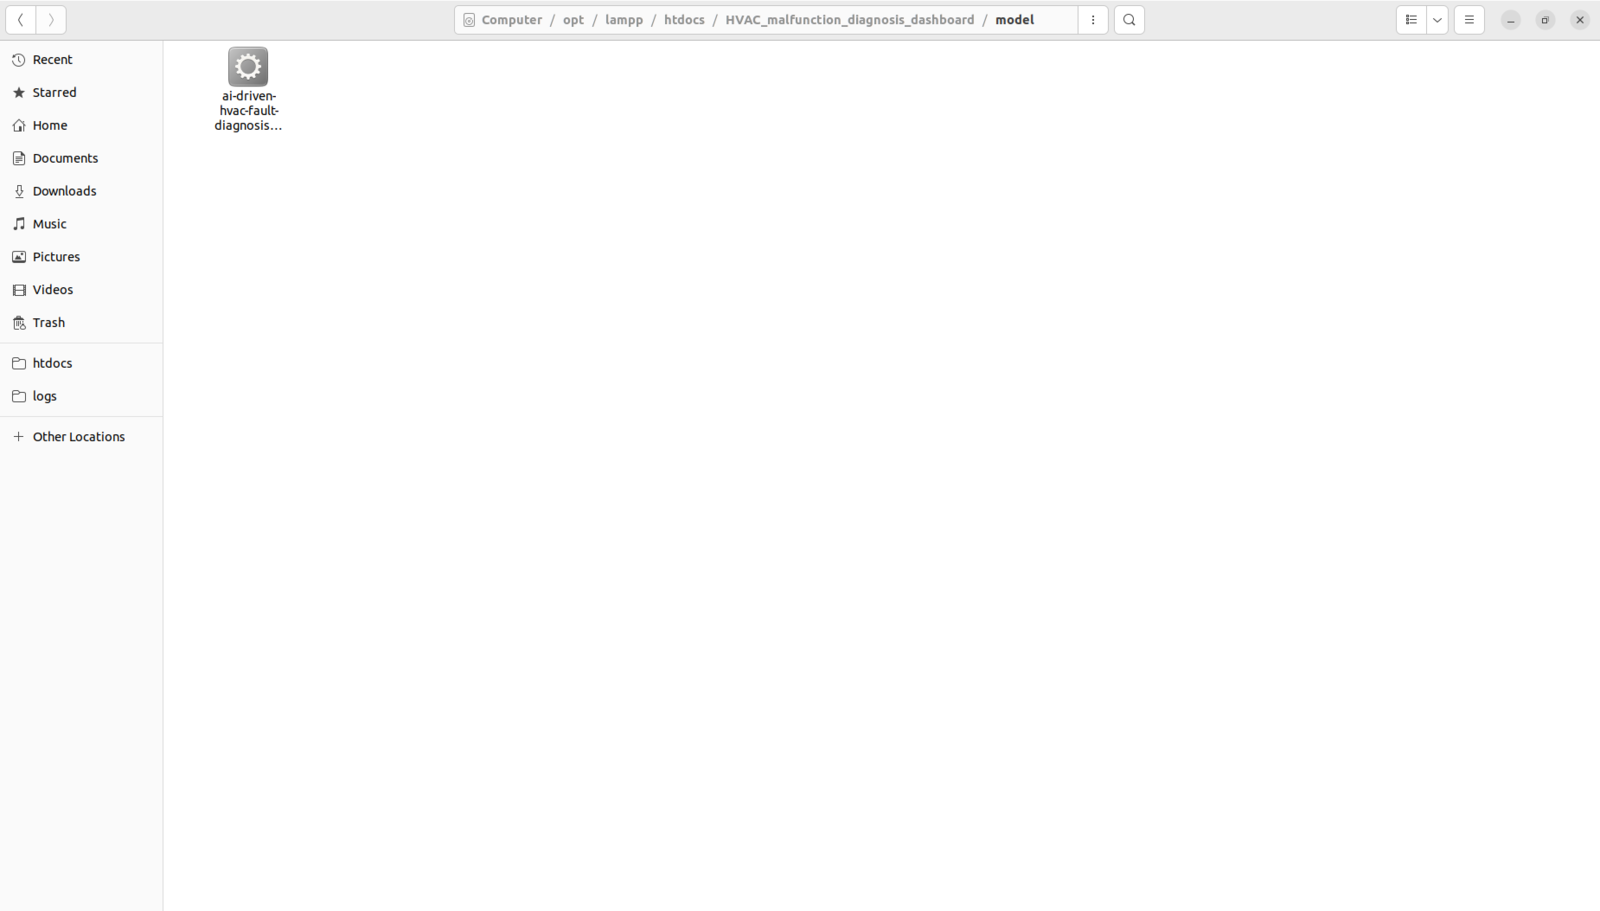
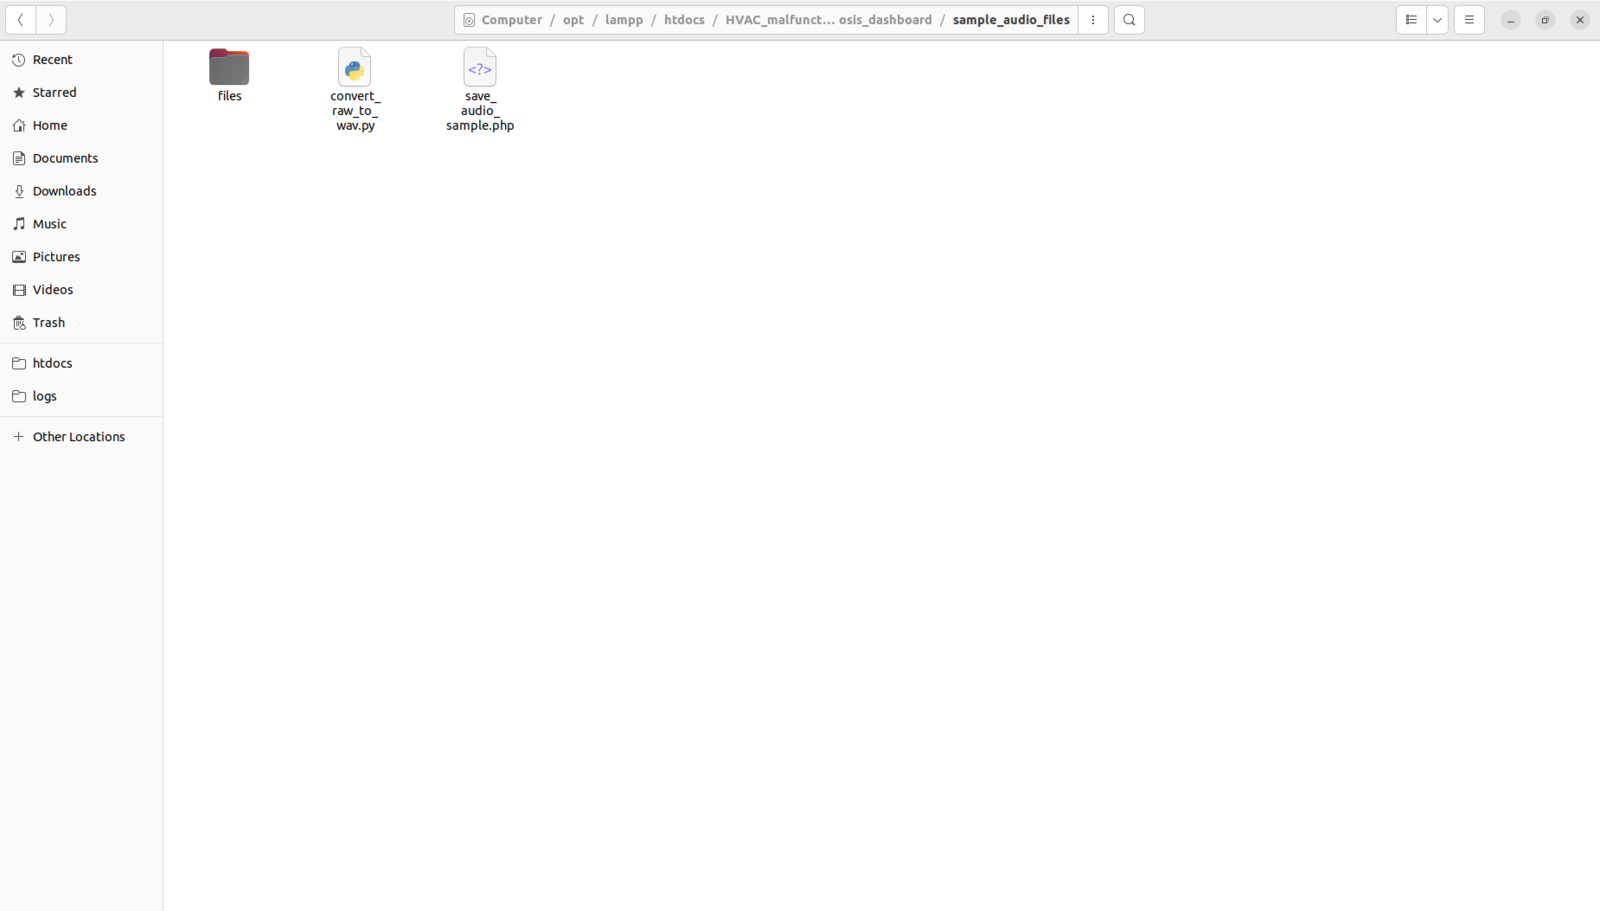
As discussed earlier, I decided to develop a versatile web dashboard (application) to improve the user experience and run essential device features, including but not limited to executing Python scripts. Since the web application features interconnect with data collection and model running procedures executed by different development boards, please refer to the web application code files or the following steps focusing on the device qualifications to review all of the web application capabilities thoroughly. As shown below, the web application consists of seven folders and nine code files in various programming languages:
  • /assets
    • class.php
    • dashboard_updates.php
    • index.css
    • index.js
    • Particle_cloud_connection.php
  • /generate_thermal_img
    • /img_detection
    • /img_sample
    • generate_thermal_image_and_run_model.py
  • /model
  • /sample_audio_files
    • /files
    • convert_raw_to_wav.py
    • save_audio_sample.php
  • index.php
Project folder tree for the PHP, JavaScript, Python, and asset files in the dashboard

265


Assets folder tree containing dashboard scripts, styles, and Particle Cloud connection code

266


Thermal image sample folder structure used by the web dashboard

267


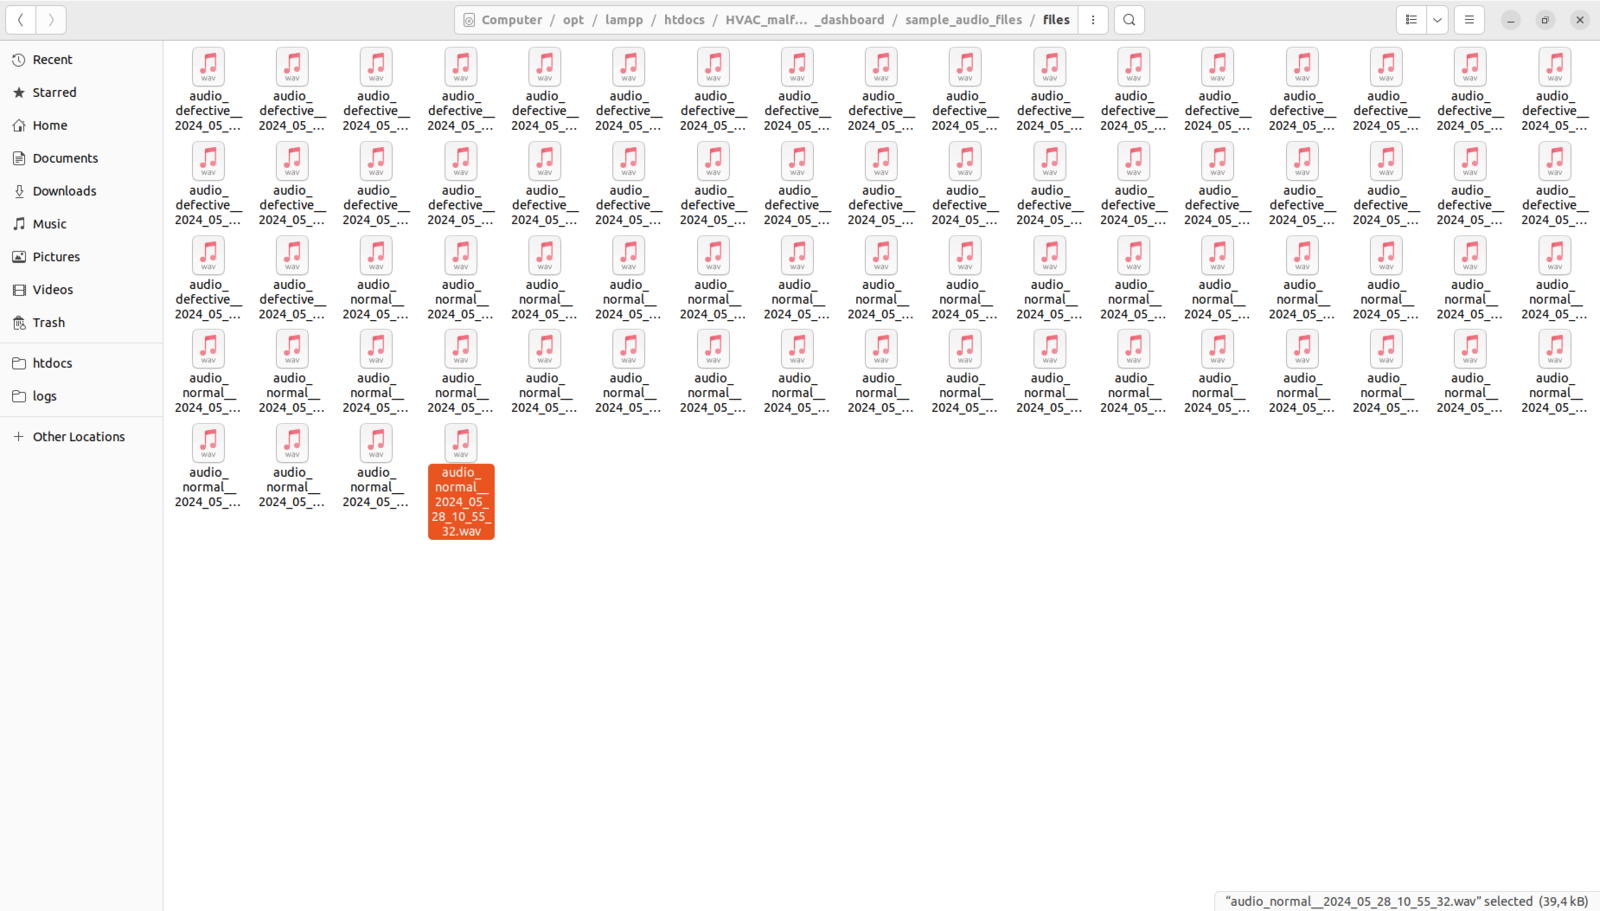
Audio sample folder structure separating raw buffers and WAV outputs

268


Database-related files and dashboard update handlers in the application structure

269

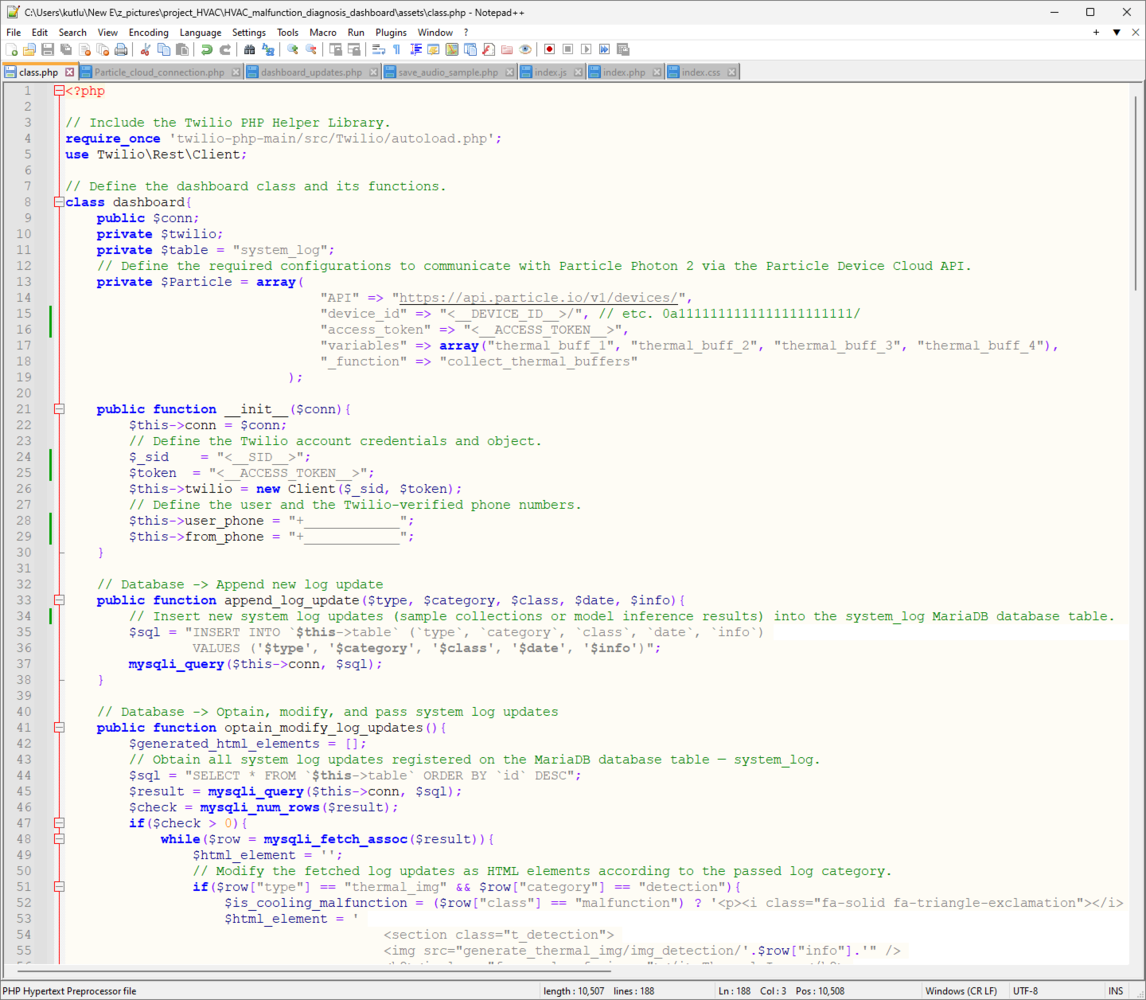
📁 class.php To bundle all functions under a specific structure, I created a class named dashboard. Please refer to the following steps to inspect all interconnected device features. ⭐ Define the required configurations to communicate with Photon 2 via the Particle Device Cloud API. ⭐ In the init function: ⭐ Define the Twilio account credentials and required settings.
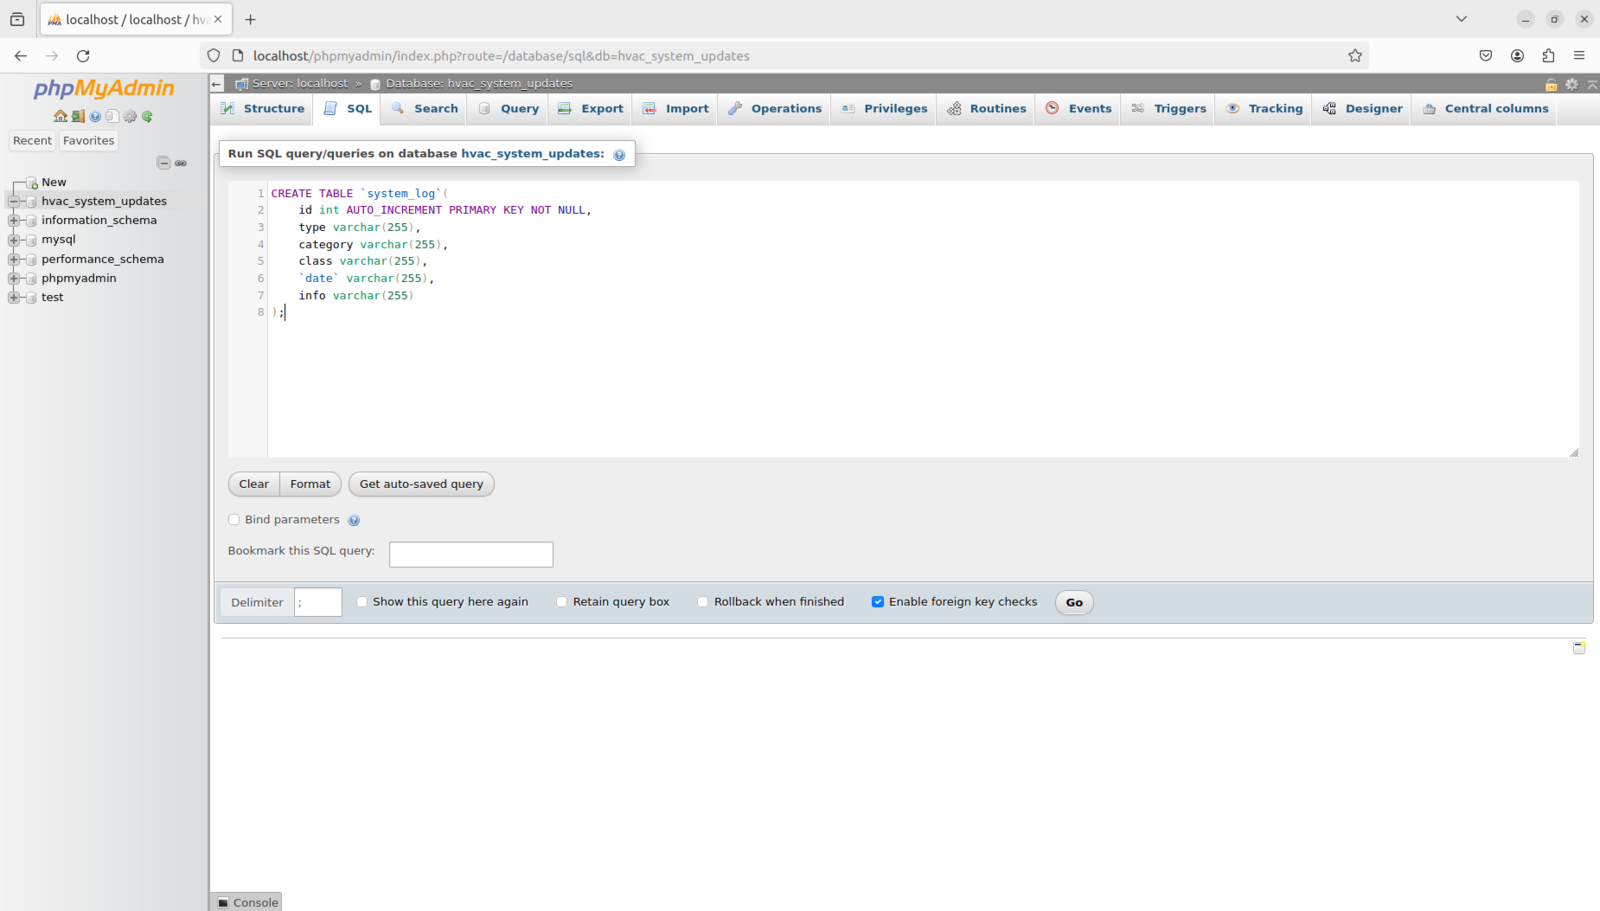
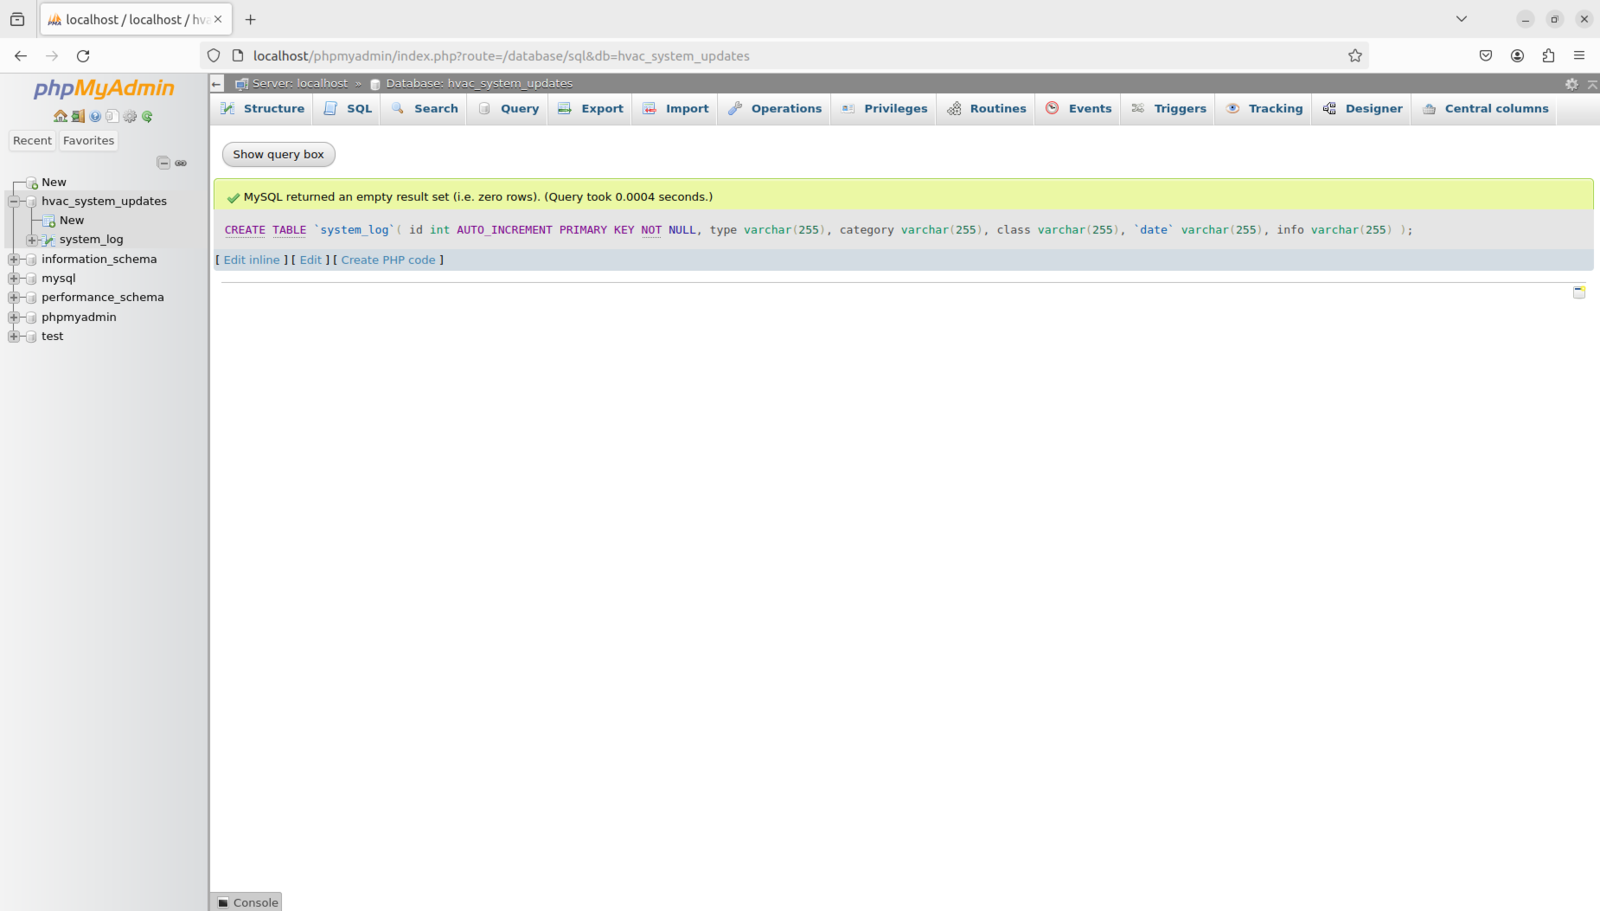
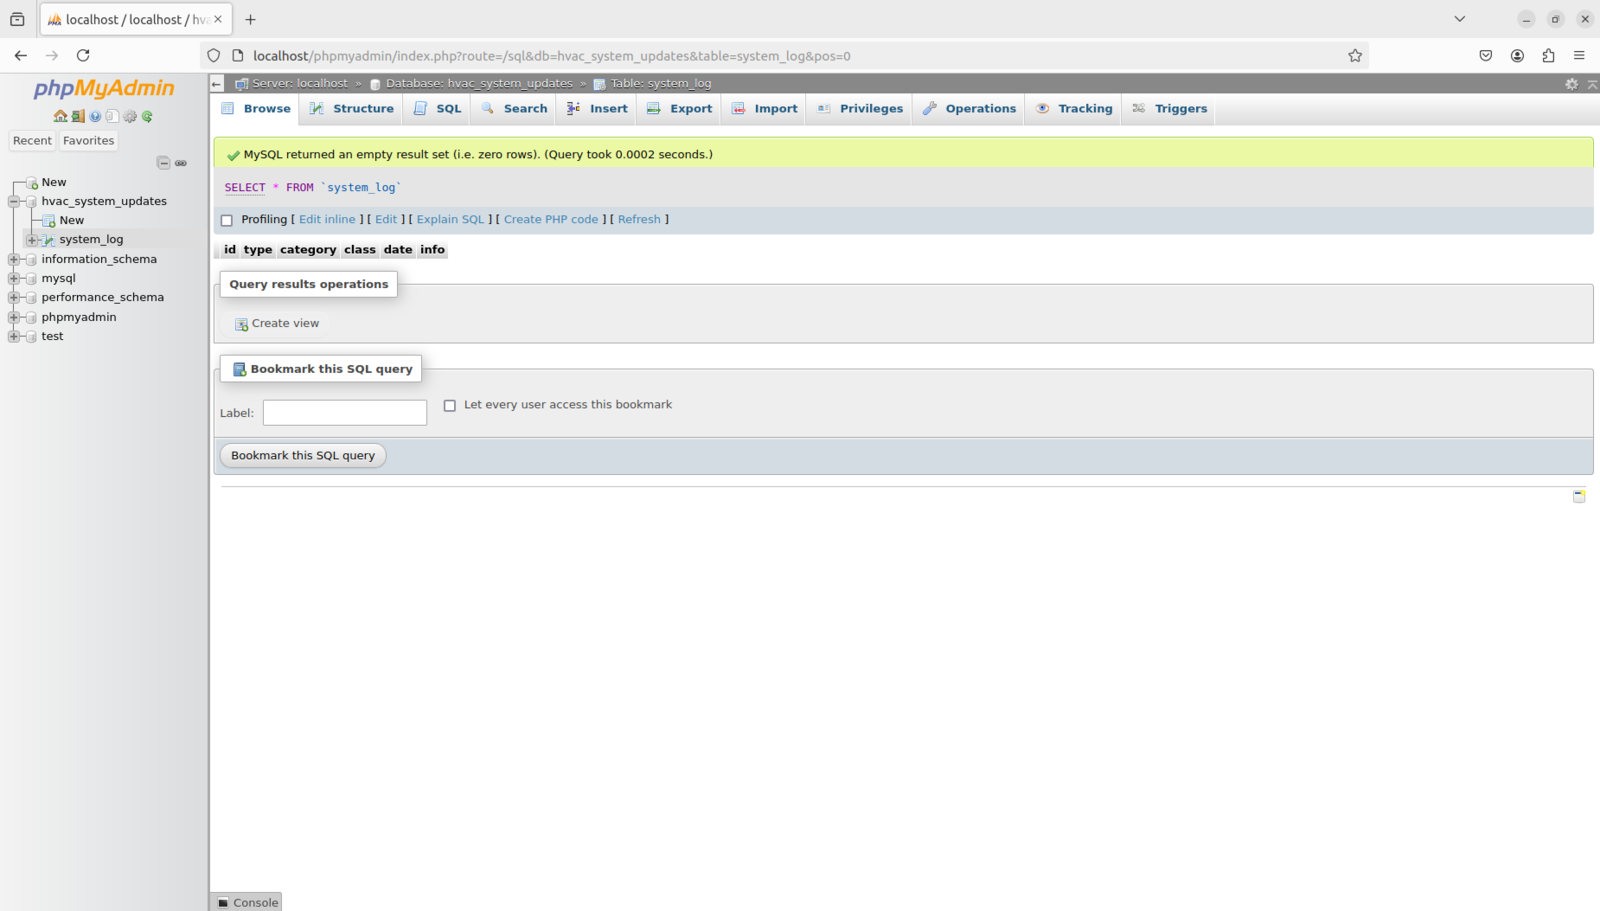
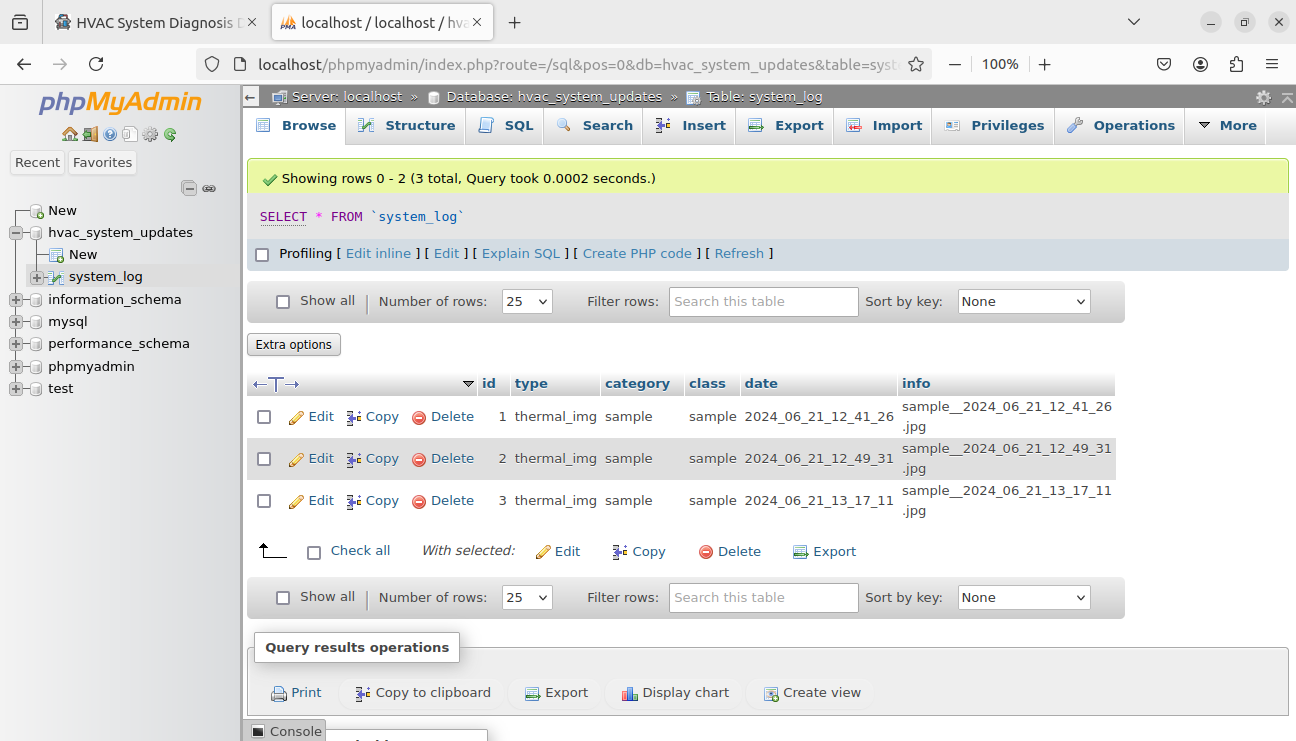
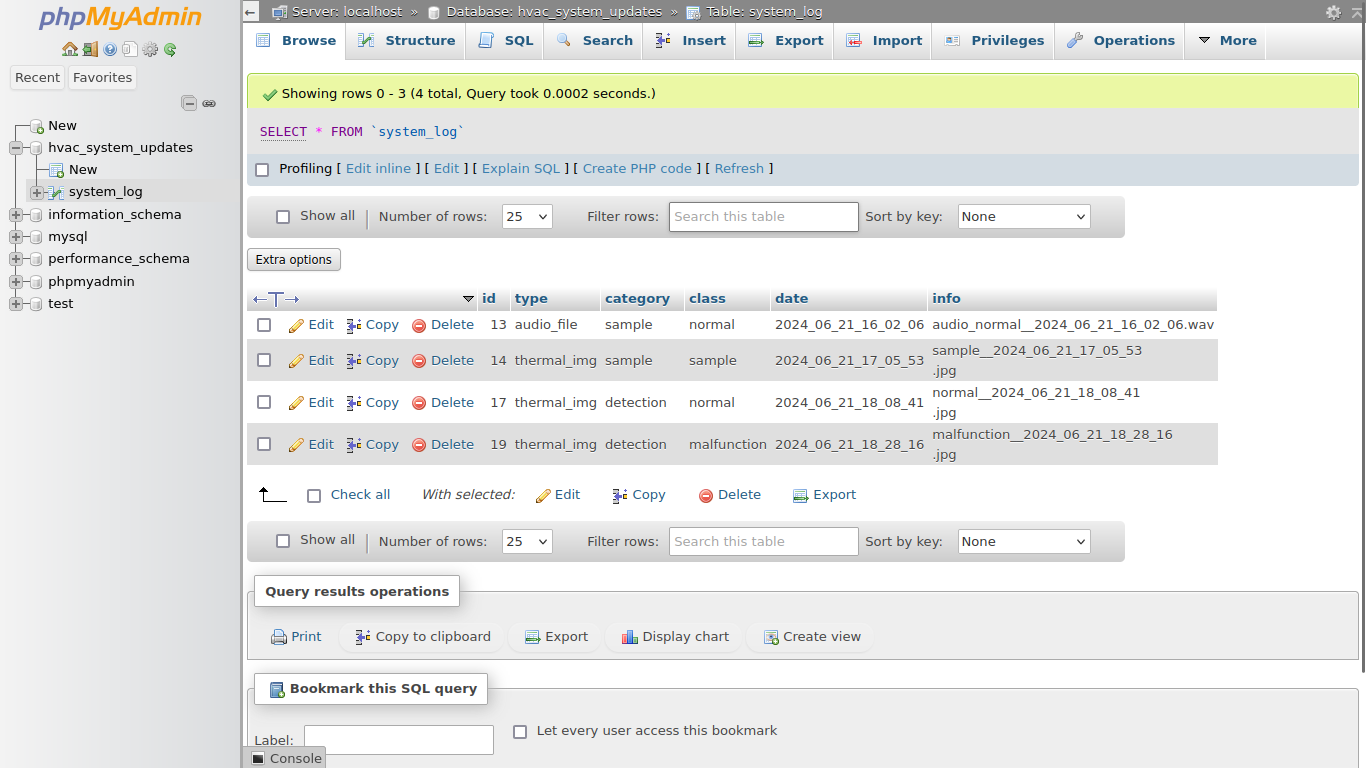
⭐ In the append_log_update function: ⭐ Insert a new system log update regarding data collection or model inference results into the system_log MariaDB database table.
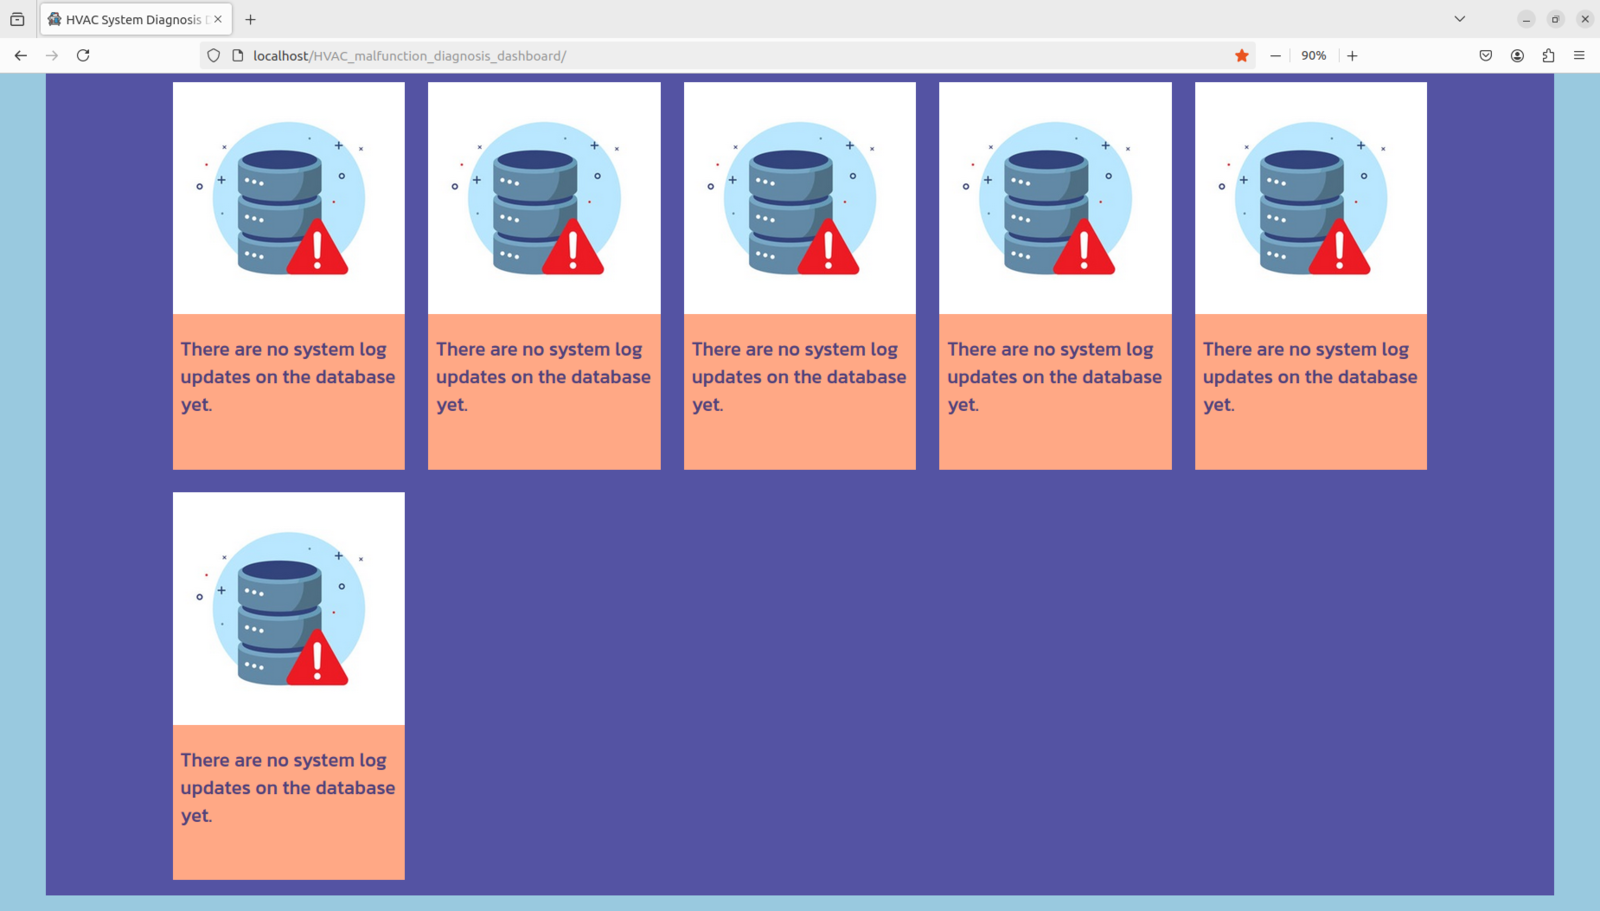
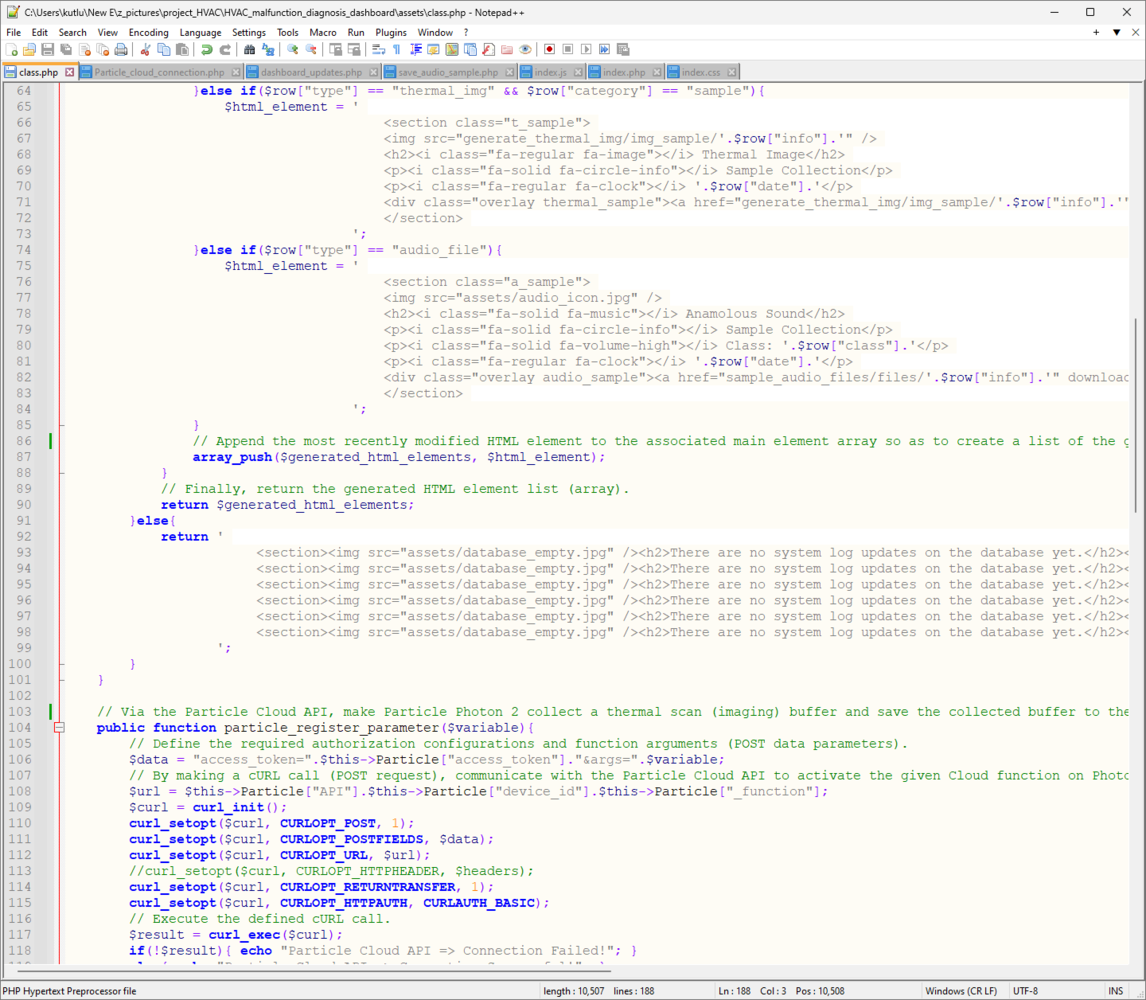
⭐ In the optain_modify_log_updates function: ⭐ Fetch all system log updates registered on the system_log database table. ⭐ According to the given log category, modify the obtained information to generate HTML elements for each system log update. ⭐ While generating HTML elements for the retrieved log updates, append each HTML element to an array so as to create a thorough index. ⭐ Finally, return the produced HTML element index (list). ⭐ If there is no registered system log update in the database table, return the default HTML element index.
⭐ In the particle_register_parameter function: ⭐ Define the authorization configurations and cloud function arguments (POST data parameters) required by the Particle Cloud API. ⭐ By making a cURL call (POST request), employ the Particle Cloud API to make Photon 2 collect a thermal scan (imaging) buffer and register the collected buffer to the Particle Cloud.
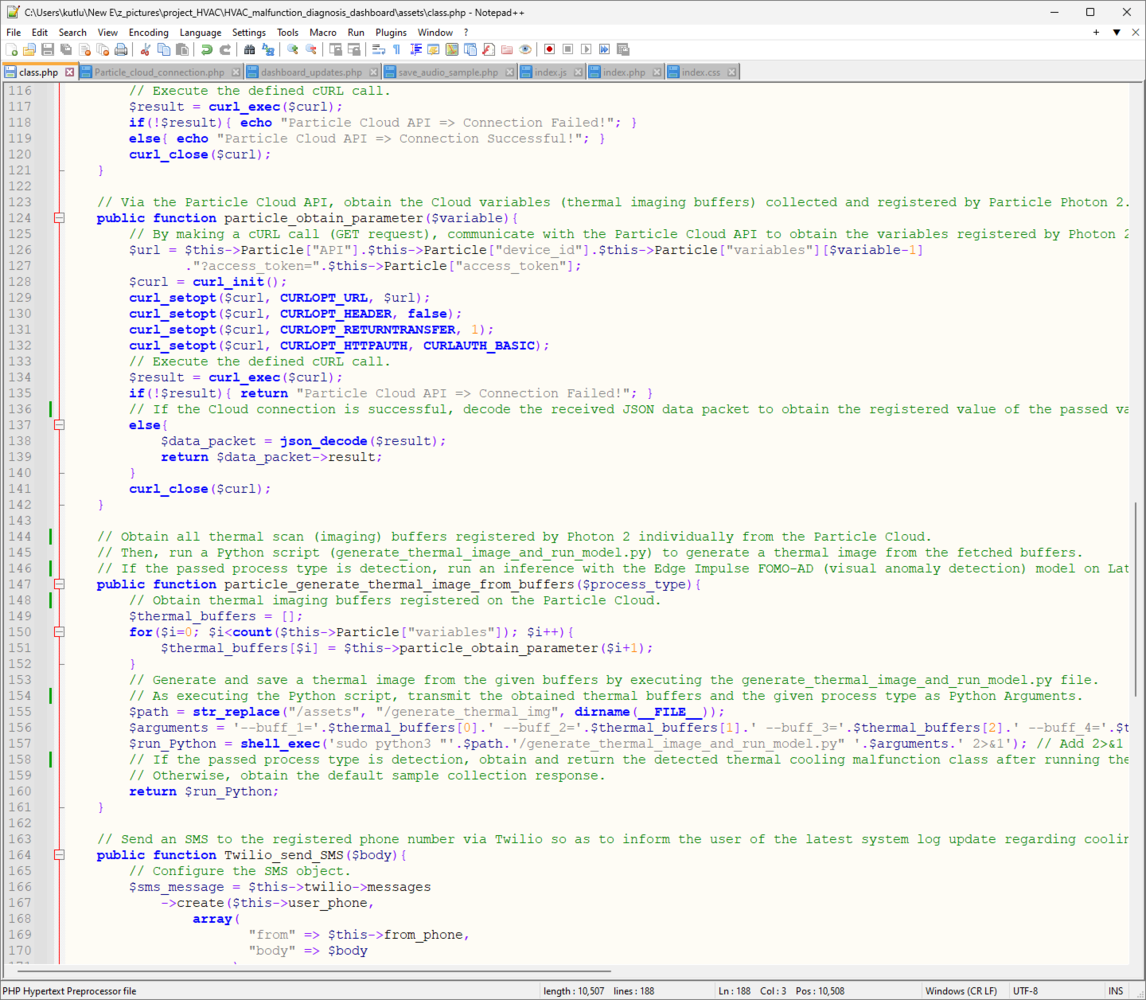
⭐ In the particle_obtain_parameter function: ⭐ By making a cURL call (GET request), employ the Particle Cloud API to obtain information regarding the passed Cloud variable registered by Photon 2. ⭐ If the Cloud response is successful, decode the received JSON data packet to fetch the given Cloud variable value. Then, return the obtained value.
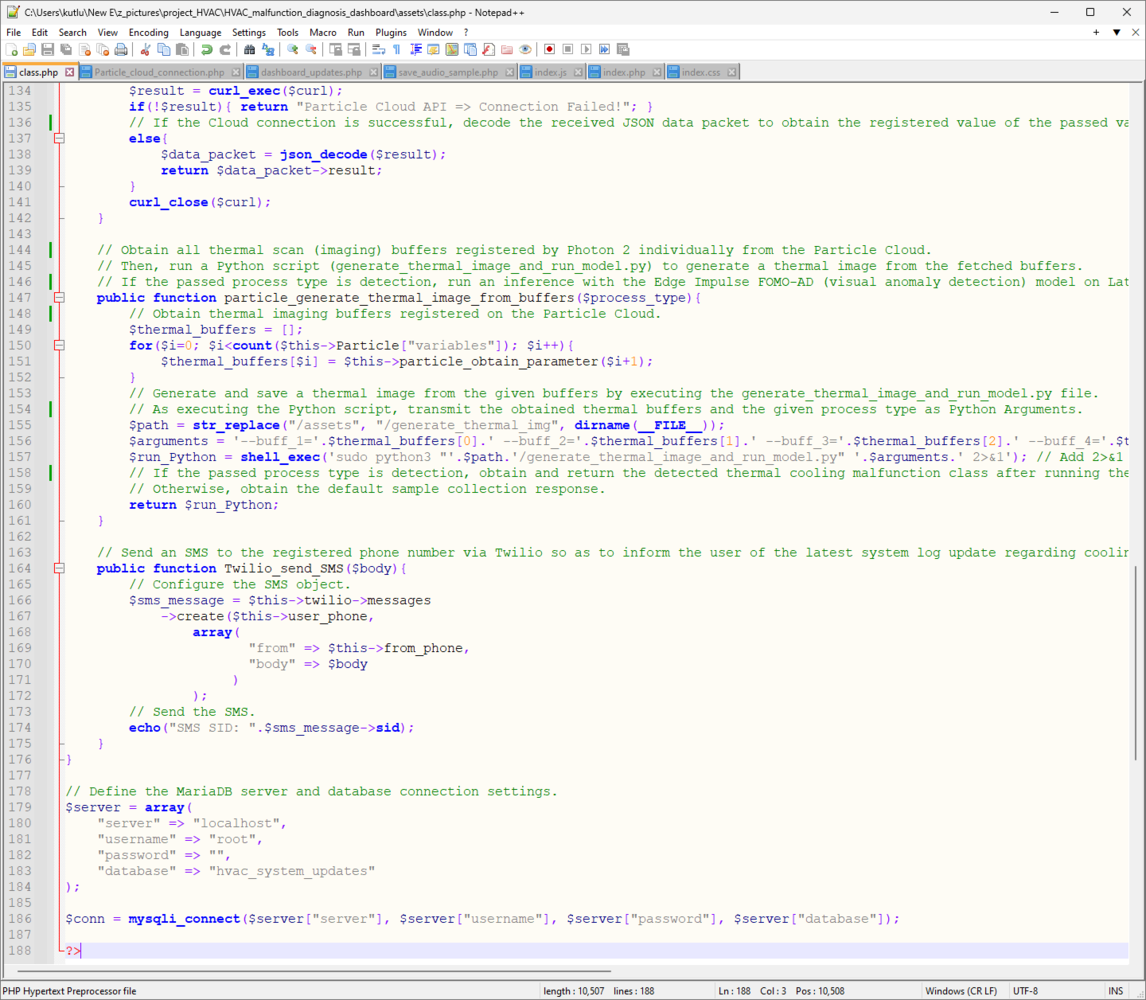
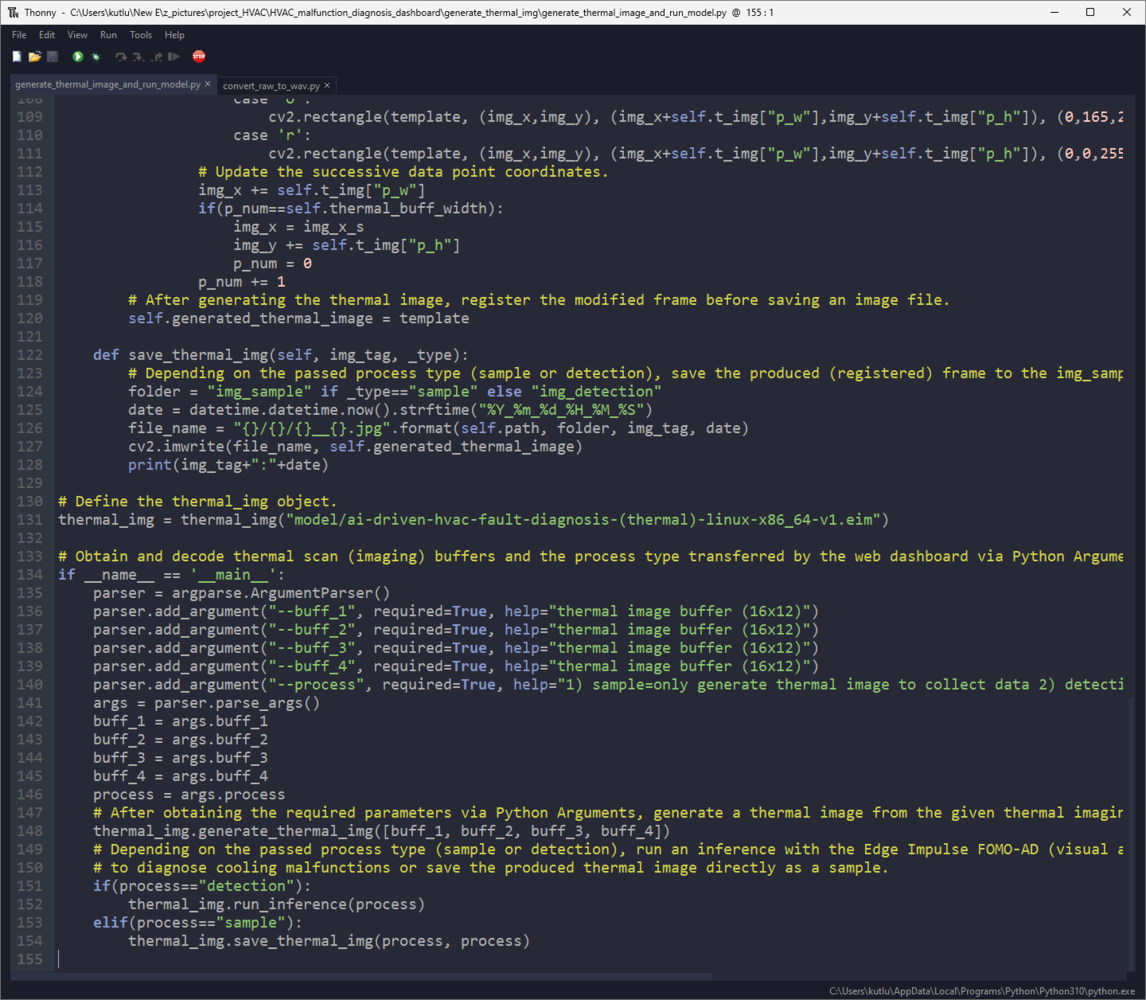
⭐ In the particle_generate_thermal_image_from_buffers function: ⭐ Obtain all thermal scan (imaging) buffers registered by Photon 2 individually from the Particle Cloud. ⭐ Then, generate a precise thermal image from the fetched buffers by executing a Python script, generate_thermal_image_and_run_model.py. ⭐ According to the passed process type, save the produced image as a sample directly or run an inference with the Edge Impulse FOMO-AD model via the same Python script. ⭐ Finally, return the response transferred by the executed Python script. Since the web application executes the given Python script via the shell_exec function, it is not possible to observe debugging errors like using the terminal. Thus, I appended 2>&1 to the command line in the shell_exec function to display debugging errors on the browser directly. In this regard, I was able to develop the web application way faster.
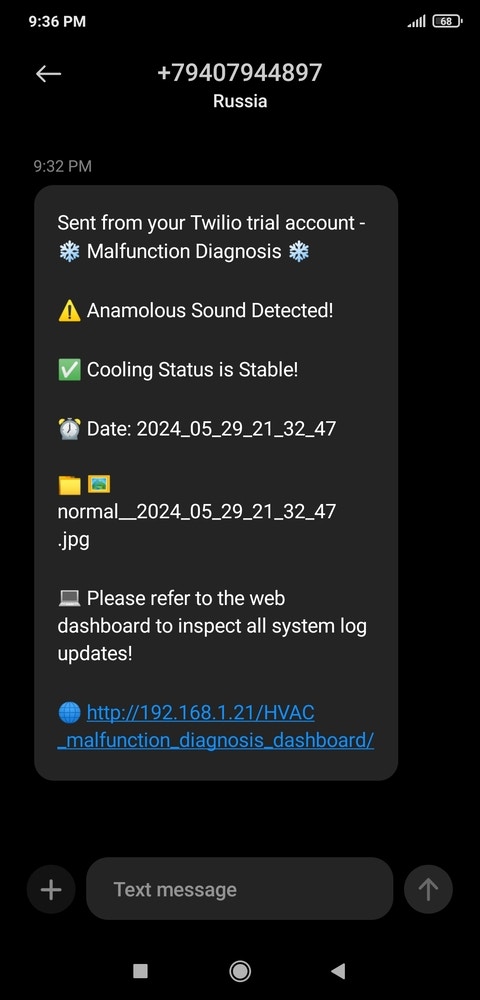
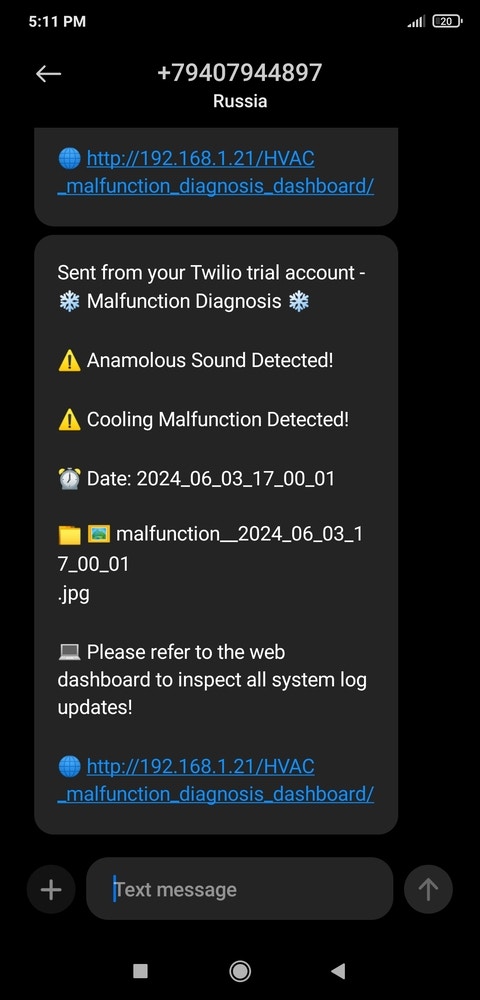
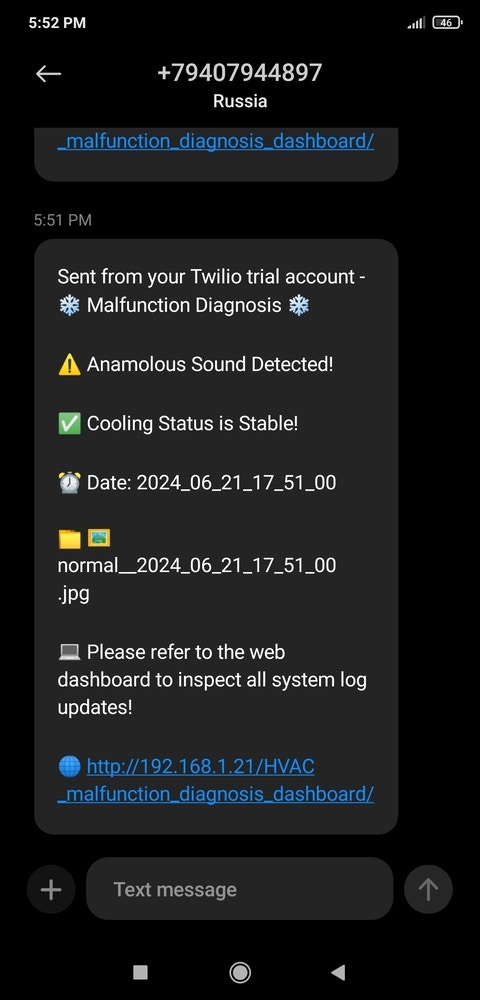
⭐ In the Twilio_send_SMS function: ⭐ Via the Twilio SMS API, send an SMS from the Twilio virtual phone number to the registered (user) phone number to transfer the given text message.
⭐ Define the required MariaDB database configurations for LattePanda Mu.
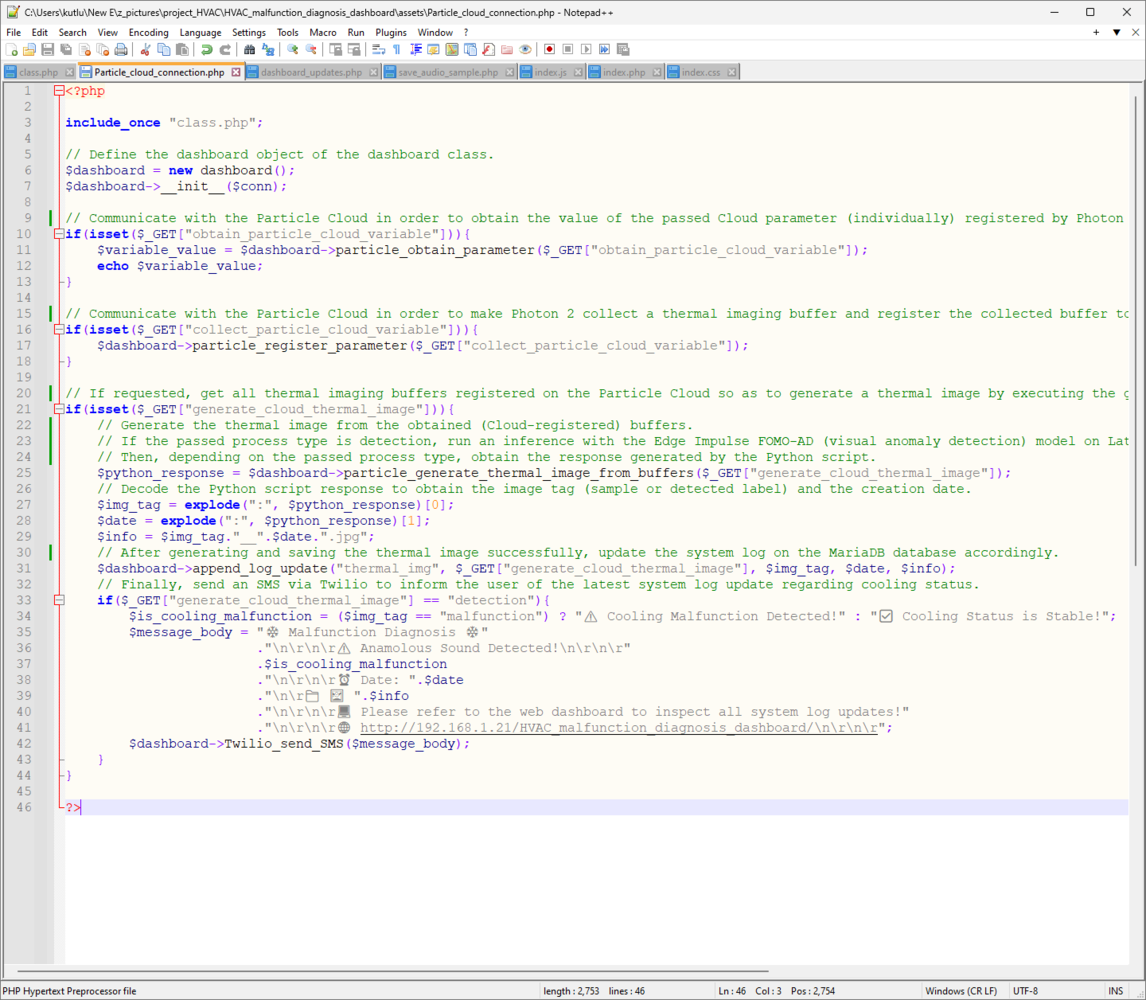
📁 Particle_cloud_connection.php ⭐ Include the class.php file and define the dashboard object of the dashboard class.
⭐ If requested via HTTP GET request, communicate with the Particle Cloud to obtain the value of the passed Cloud variable (individually) registered by Photon 2 and return the fetched value.
⭐ If requested via HTTP GET request, communicate with the Particle Cloud in order to make Photon 2 collect a thermal imaging buffer and register the collected buffer to the passed Cloud variable.
⭐ If requested via HTTP GET request: ⭐ Communicate with the Particle Cloud to obtain all thermal imaging buffers registered by Photon 2. ⭐ Generate a thermal image from the obtained buffers by executing a Python script, generate_thermal_image_and_run_model.py. ⭐ According to the passed process type (sample or detection), save the generated image as a sample or run an inference with the Edge Impulse FOMO-AD (visual anomaly detection) model via the same Python script. ⭐ Then, decode the response generated by the Python script to obtain the image tag (default sample or detected label) and the creation date. ⭐ After producing the thermal image and conducting the given process type successfully, update the system log on the MariaDB database accordingly. ⭐ Finally, depending on the process type, send an SMS via Twilio to inform the user of the latest system log update regarding cooling status.
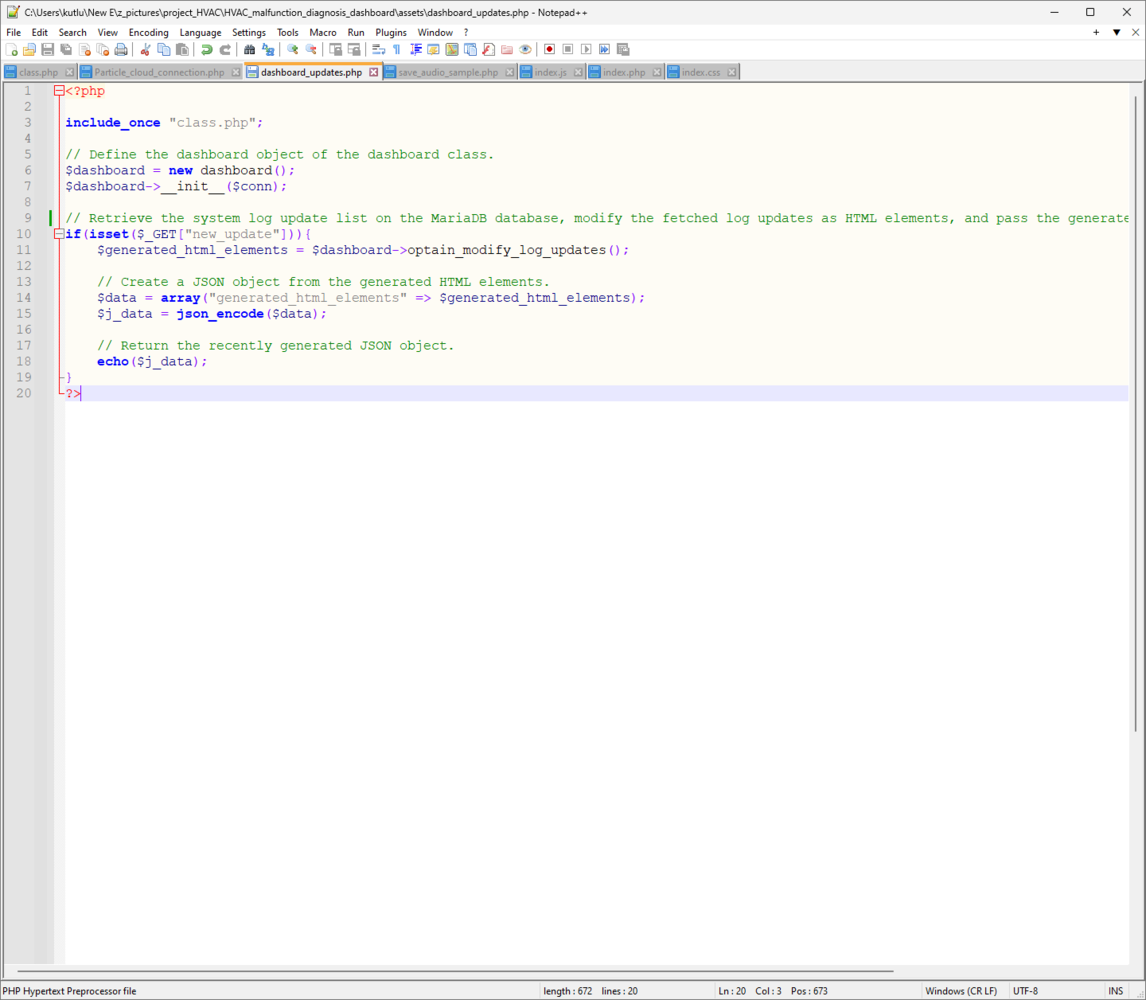
📁 dashboard_updates.php ⭐ Include the class.php file and define the dashboard object of the dashboard class.
⭐ If requested via HTTP GET request: ⭐ Retrieve all of the system log updates on the MariaDB database table, system_log. ⭐ According to the given log category, modify the obtained information to generate HTML elements for each system log update. ⭐ Then, create a JSON object from the produced HTML element index (list). ⭐ Finally, return the recently generated JSON object.
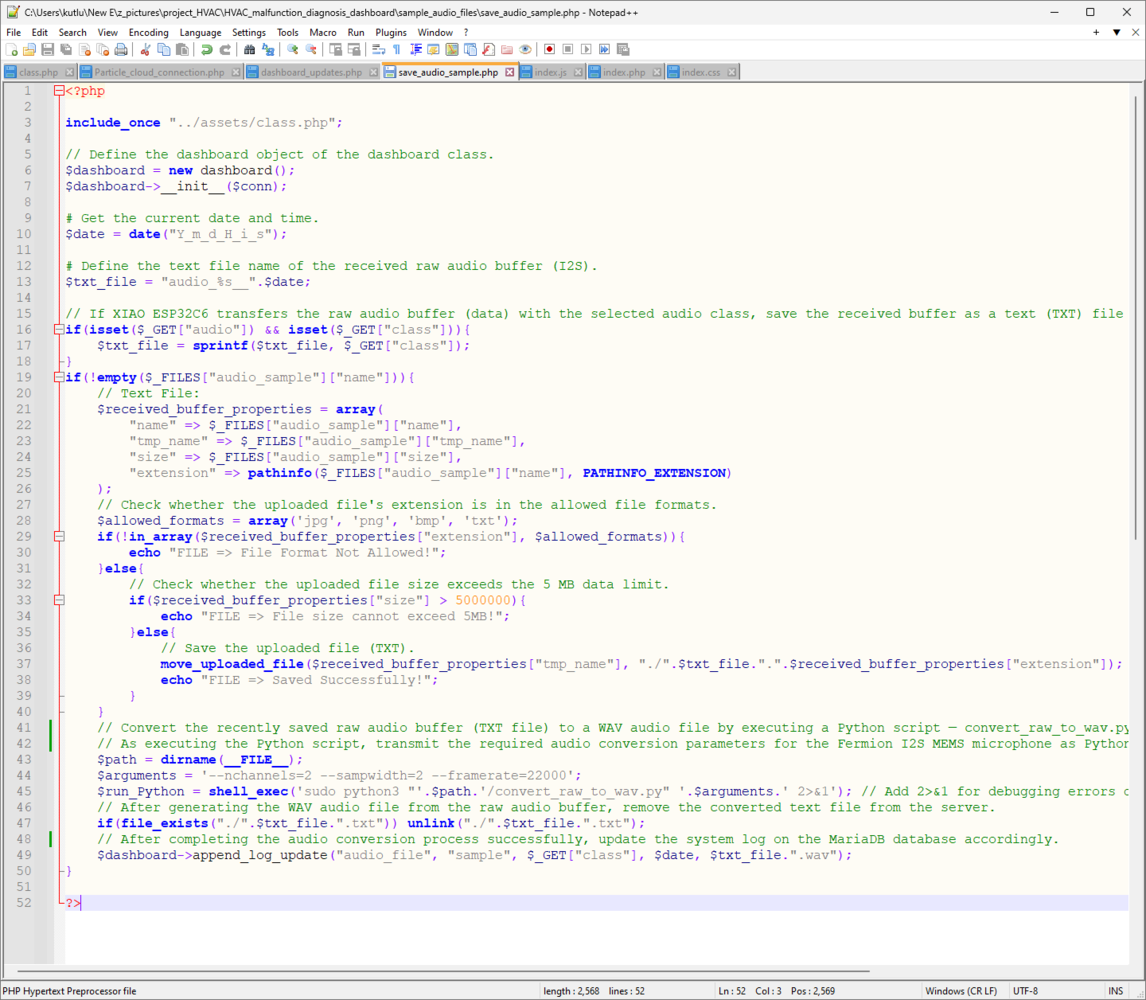
📁 save_audio_sample.php ⭐ Include the class.php file and define the dashboard object of the dashboard class.
⭐ Define the text file name for the received raw audio buffer (I2S). ⭐ If XIAO ESP32C6 transfers the selected audio class name via a GET (URL) parameter, modify the text file name accordingly.
⭐ If XIAO ESP32C6 transfers the collected raw audio buffer (I2S) via an HTTP POST request: ⭐ Save the received audio buffer to the defined text (TXT) file. ⭐ Then, convert the recently saved raw audio buffer (TXT file) to a WAV audio file by executing a Python script, convert_raw_to_wav.py. ⭐ As executing the Python script, transmit the required audio conversion parameters for the Fermion I2S MEMS microphone as Python Arguments. ⭐ After generating the WAV audio file from the raw audio buffer, remove the converted text file from the server. ⭐ After completing the audio conversion process successfully, update the system log on the MariaDB database accordingly. Since the web application executes the given Python script via the shell_exec function, it is not possible to observe debugging errors like using the terminal. Thus, I appended 2>&1 to the command line in the shell_exec function to display debugging errors on the browser directly. In this regard, I was able to develop the web application way faster.
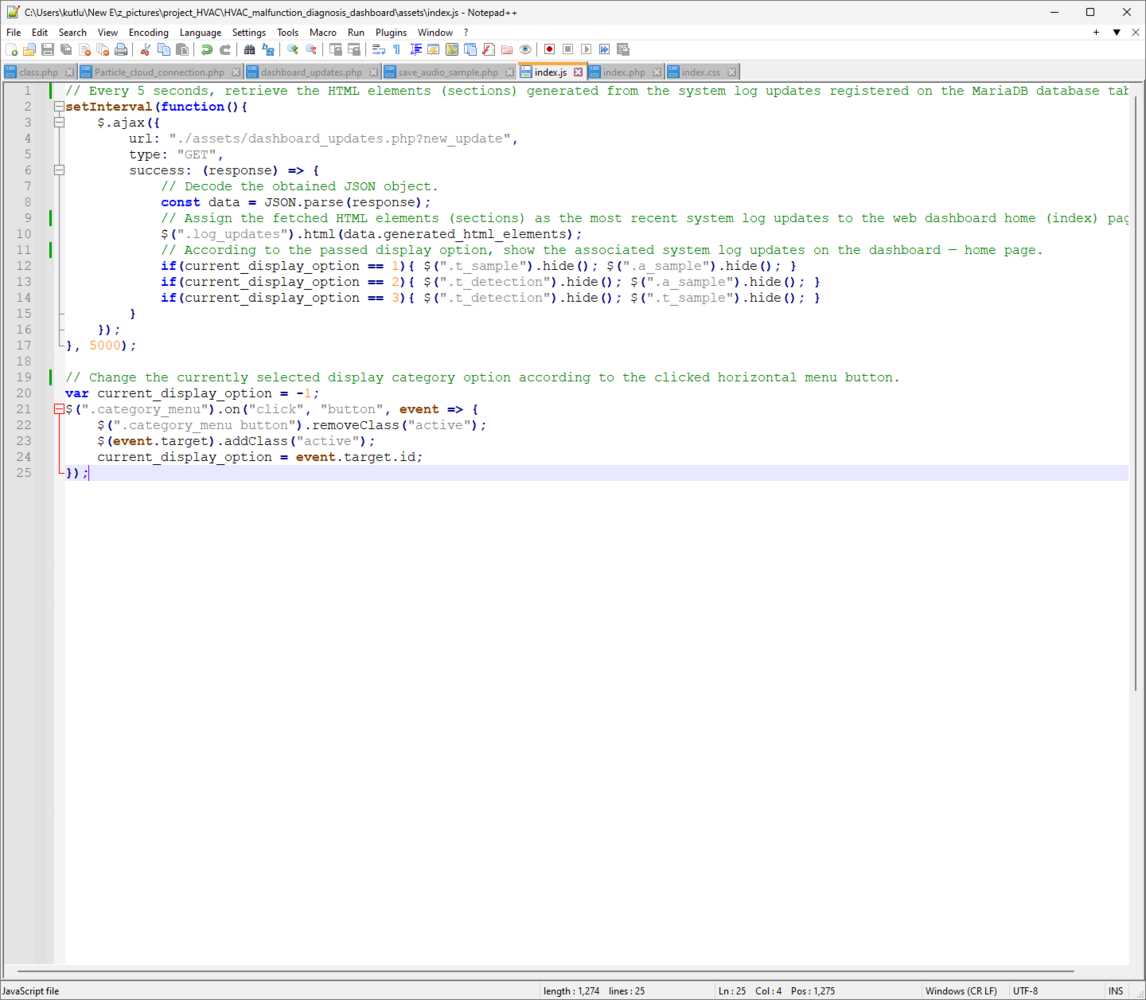
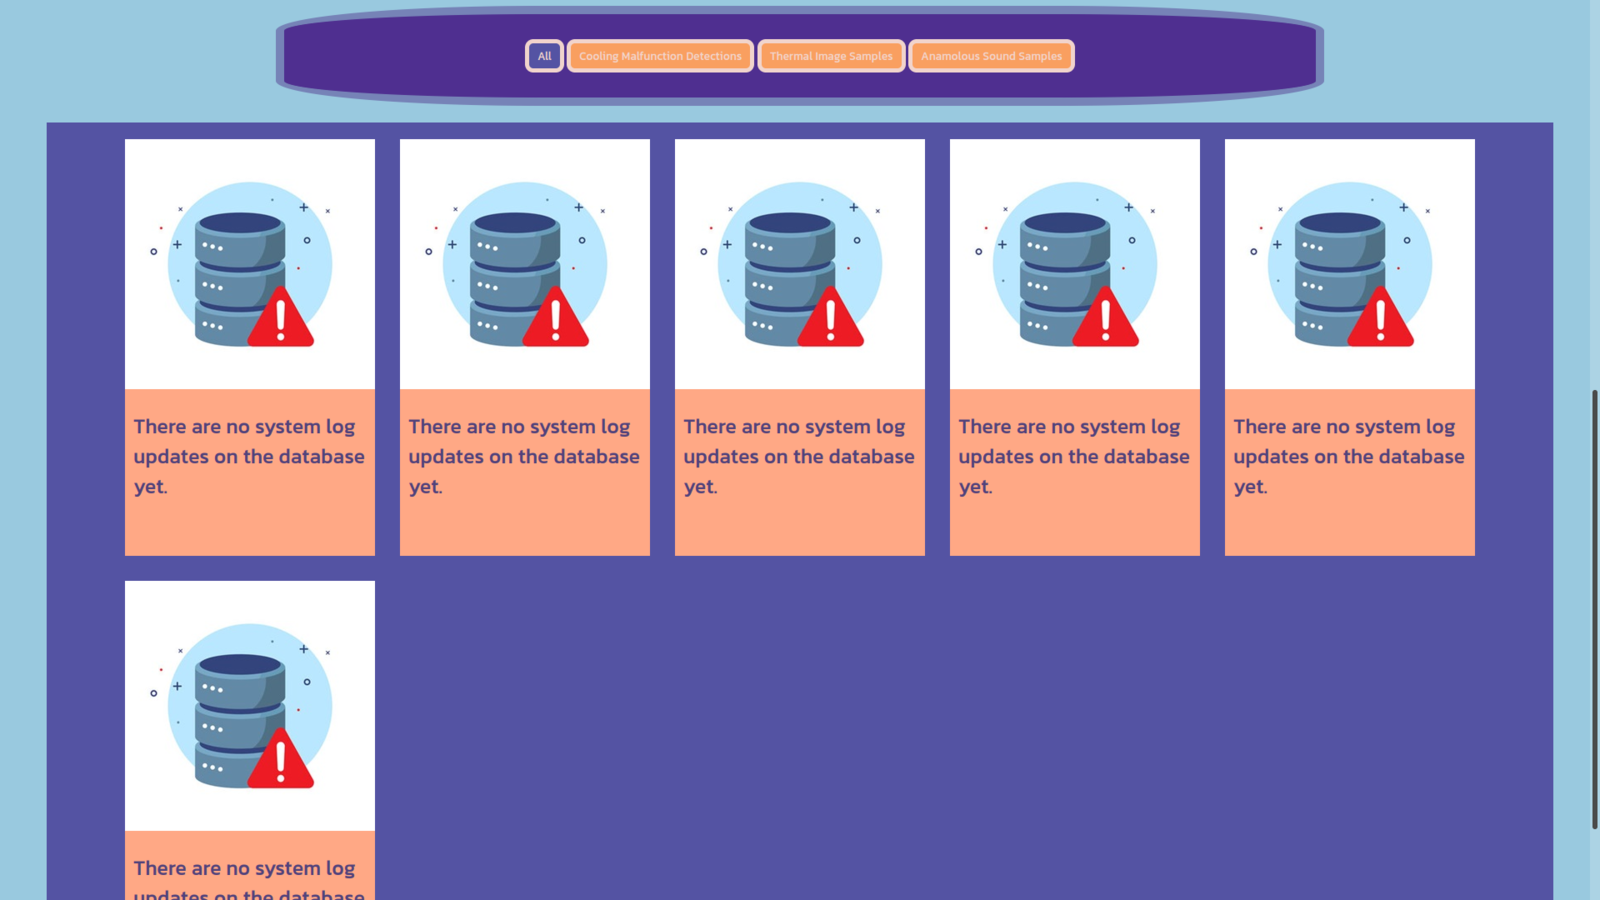
📁 index.js ⭐ Utilizing the setInterval function, every 5 seconds, make an HTTP GET request to the dashboard_updates.php file to: ⭐ Retrieve the HTML element index (list) as a JSON object generated from the system log updates registered on the MariaDB database table. ⭐ Decode the obtained JSON object. ⭐ Pass the fetched HTML elements (sections) to the web dashboard home (index) page automatically. ⭐ According to the given display category option, show the associated elements only on the index page.
⭐ According to the clicked horizontal menu button, change the display category option and the clicked button’s appearance by toggling classes.
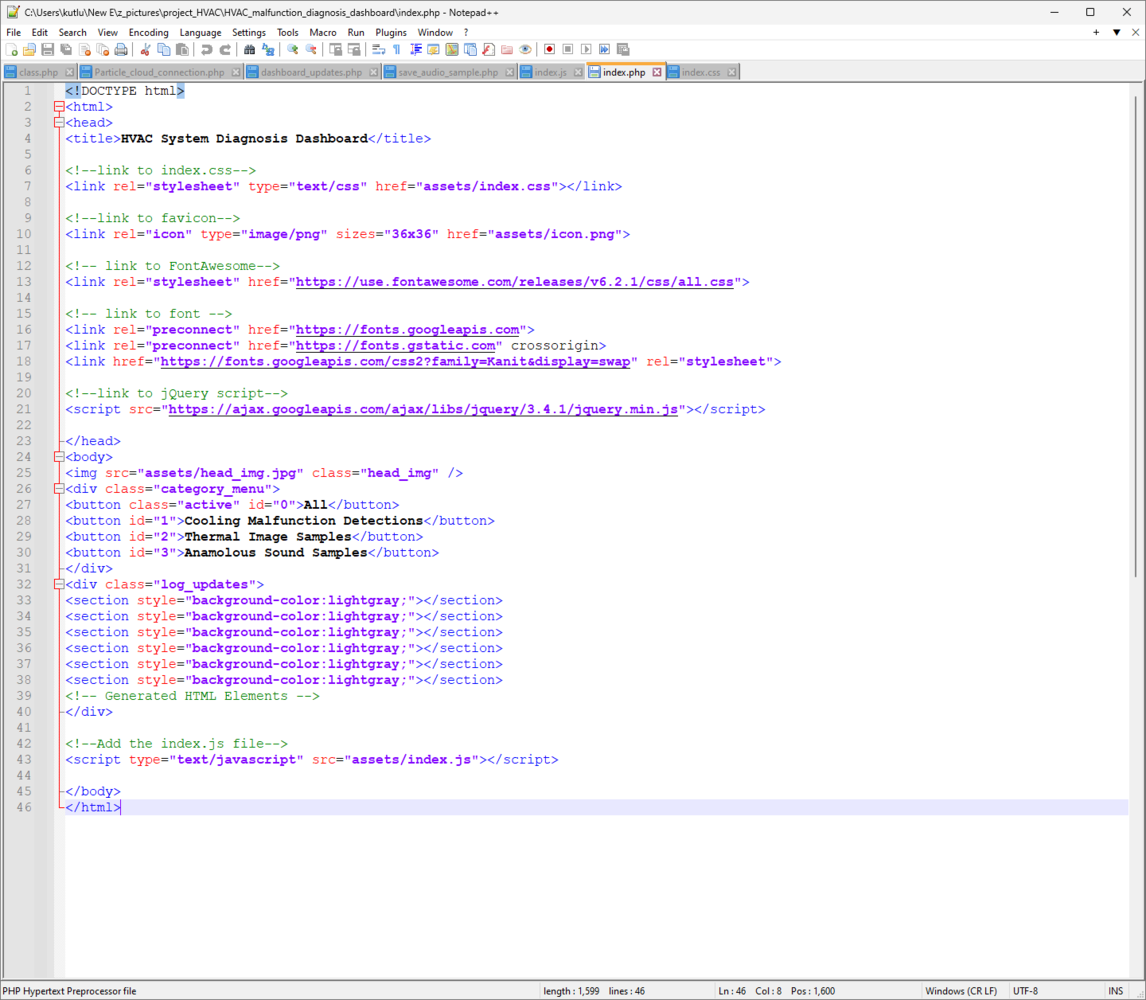
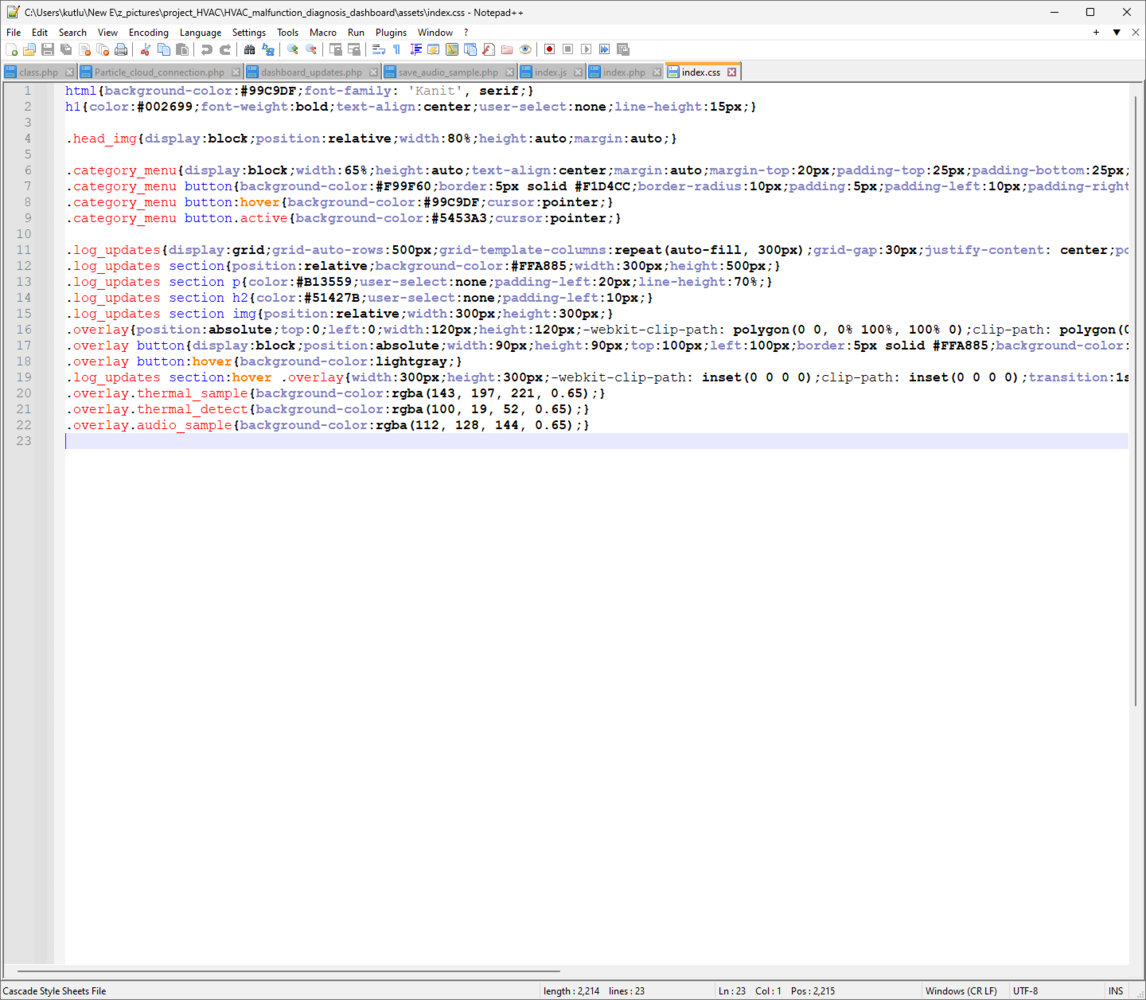
📁 You can inspect index.php and index.css files below, which are for designing the web dashboard home (index) page.
Editor view of the dashboard PHP class for database and log operations

270


Editor view of the dashboard update handler for system log entries

271


Editor view of the PHP page rendering cooling malfunction records

272


Editor view of the JavaScript controlling dashboard filters and updates

273


Editor view of the CSS styling for the HVAC dashboard interface

274


Editor view of the Particle Cloud connection helper in PHP

275


Editor view of the SMS notification helper using the Twilio API

276


Editor view of the audio sample upload endpoint

277


Editor view of the thermal image generation request handler

278


Editor view of dashboard routes tying audio, thermal, and model actions together

279

Step 5.1: Converting the raw audio buffers transferred by XIAO ESP32C6 via POST requests to WAV files and transmitting the required conversion parameters as Python Arguments

As explained earlier, I needed to convert the raw audio buffers transferred by XIAO ESP32C6 to WAV audio files in order to save compatible audio samples for Edge Impulse. Therefore, I programmed a simple Python script to perform the audio conversion process. Since Python scripts can obtain parameters as Python Arguments from the terminal (shell) directly, the web dashboard (application) passes the required audio conversion variables effortlessly. 📁 convert_raw_to_wav.py ⭐ Include the required modules.
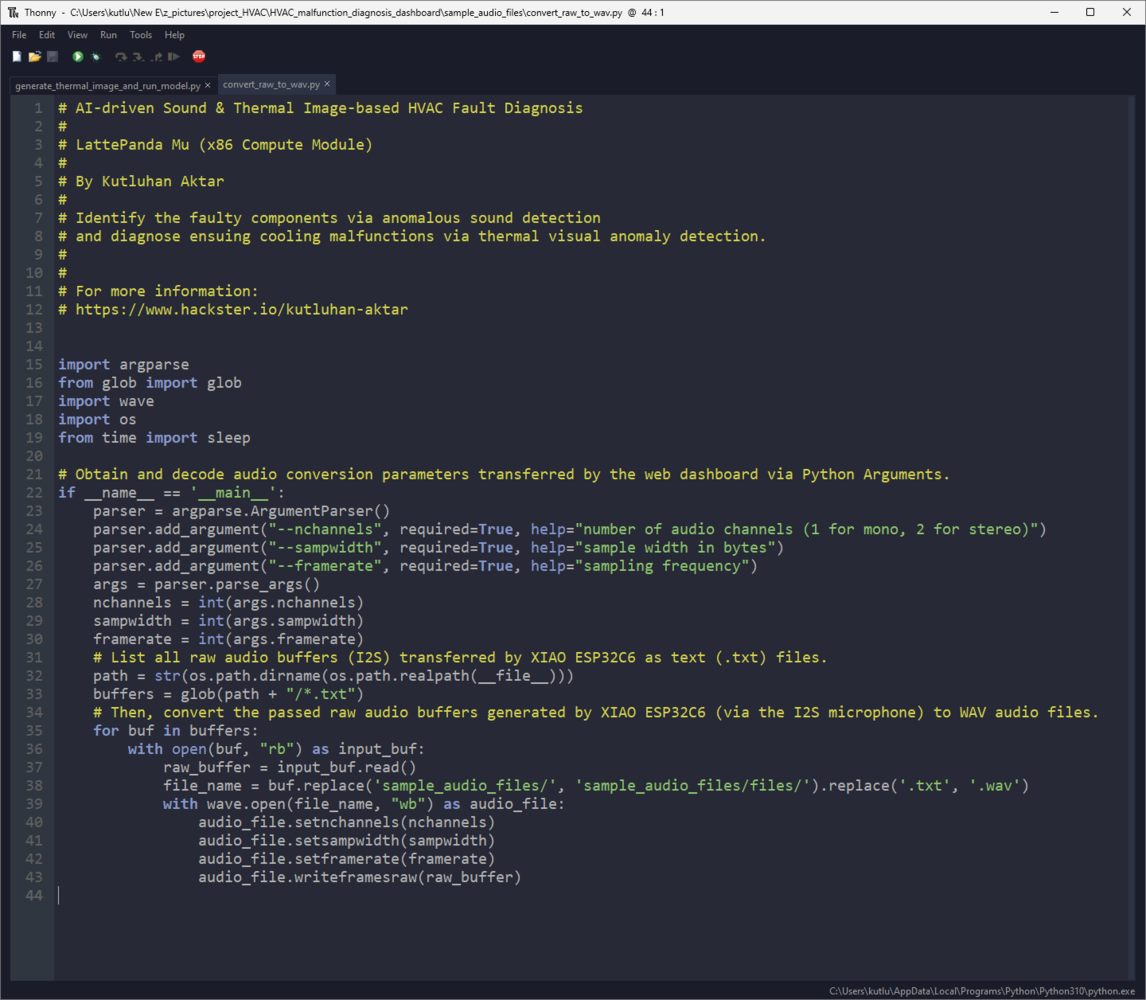
⭐ Obtain and decode audio conversion parameters transferred by the web dashboard as Python Arguments. ⭐ Get all text (.txt) files consisting of raw audio buffers (I2S) transferred by XIAO ESP32C6. ⭐ Then, open each text file to convert the stored raw audio buffers to WAV audio files and save the produced WAV audio samples to the files folder.
Editor view of convert_raw_to_wav.py reading raw buffers and writing WAV samples

280

Step 5.2: Transferring the thermal scan (imaging) buffers obtained from the Particle Cloud as Python Arguments to generate a precise thermal image

As discussed earlier, Photon 2 is not suitable for generating thermal images, saving image samples, and running a demanding visual anomaly detection model simultaneously due to memory limitations. Therefore, I utilized the web dashboard to obtain the thermal scan (imaging) buffers registered on the Particle Cloud and programmed a Python script to perform the mentioned processes. Since Python scripts can obtain parameters as Python Arguments from the terminal (shell) directly, the web dashboard (application) passes the obtained thermal imaging buffers and the given process type effortlessly. 📁 generate_thermal_image_and_run_model.py To bundle all functions under a specific structure, I created a class named thermal_img. Please refer to the following steps to inspect all interconnected device features. ⭐ Include the required modules.
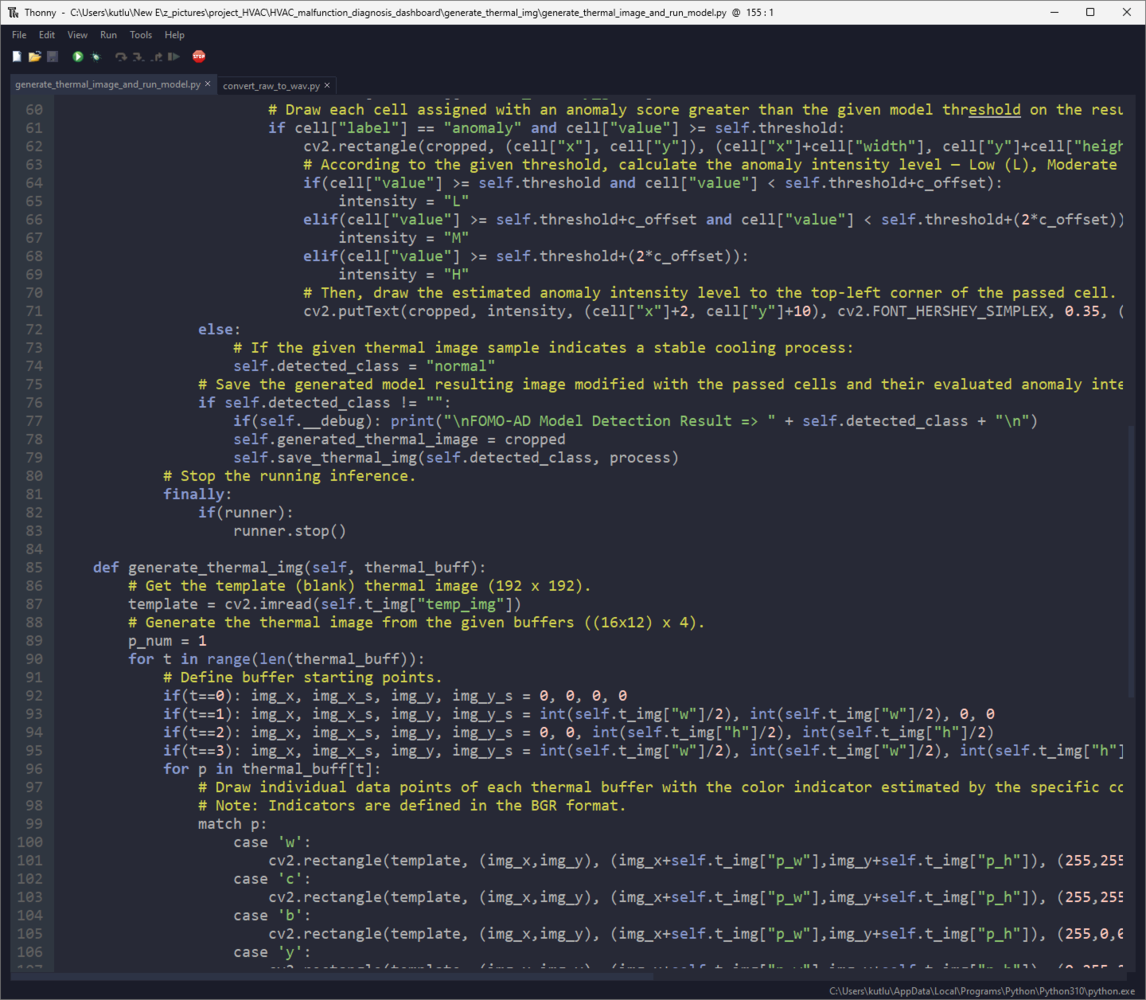
⭐ In the init function: ⭐ Get the absolute folder path to avoid errors while running this script via the web dashboard (application). ⭐ Define the required configurations to run the Edge Impulse FOMO-AD visual anomaly detection model converted to a Linux (x86_64) application (.eim). ⭐ Define the required variables to generate a thermal image from the given thermal scan (imaging) buffers, including the template (blank) image.
⭐ In the generate_thermal_img function: ⭐ Open and read the template (blank) image (192 x 192) via the built-in OpenCV function, imread. ⭐ Since the MLX90641 thermal imaging camera produces 16x12 IR arrays (buffers), I decided to set the pixel width as six (6) and the pixel height as eight (8) to fill the template image completely with four sequential buffers. ⭐ For each passed thermal imaging buffer ((16x12) x 4): ⭐ Define the coordinates for the first pixel. ⭐ Starting with the first pixel, draw each individual data point with the color indicator on the template image to generate a precise thermal image, estimated by the specific color algorithm based on the temperature ranges defined on Photon 2. ⭐ Note: Indicators are defined in the BGR format. ⭐ After drawing a pixel successfully, update the successive data point coordinates. ⭐ After generating the thermal image from the given buffers, store the modified template frame before saving an image file.
⭐ In the save_thermal_img function: ⭐ Depending on the passed process type (sample or detection), save the stored thermal image frame as a sample to the img_sample folder directly or save the modified model resulting image (after running the FOMO-AD model) to the img_detection folder. ⭐ Print the passed image tag (sample or the detected label) with the creation (or prediction) date as the response to the web dashboard.
⭐ In the run_inference function: ⭐ Print the provided information of the Edge Impulse FOMO-AD visual anomaly detection model. ⭐ Get the latest stored thermal image (frame). ⭐ After obtaining the latest thermal image, resize the retrieved frame if necessary and generate features from the cropped frame depending on the given model characteristics. ⭐ Run an inference. ⭐ Since the Edge Impulse FOMO-AD model categorizes a passed image by individual cells (grids) based on the dichotomy between two predefined classes (anomaly and no anomaly), utilize the mean visual anomaly value to detect overall (high-risk) thermal cooling malfunctions based on the confidence threshold estimated while testing the model accuracy on Edge Impulse. ⭐ If the calculated mean visual anomaly value is higher than the given threshold: ⭐ Obtain the visual anomaly grid produced by the FOMO-AD model, consisting of individual cells with coordinates, assigned labels, and anomaly scores. ⭐ If a cell’s assigned label is anomaly and its anomaly score is higher than the given threshold: ⭐ Draw a rectangle on the model resulting image (cropped) with the provided cell coordinates. ⭐ Calculate the cell’s anomaly intensity level (Low (L), Moderate (M), High (H)) in relation to the given threshold. ⭐ Then, draw the evaluated anomaly intensity level to the top-left corner of the cell rectangle. ⭐ Save the model resulting image modified with the cell rectangles and their evaluated anomaly intensity levels. ⭐ Finally, stop the running inference.
⭐ Define the thermal_img object of the thermal_img class and pass the path of the FOMO-AD model (Linux (x86_64) application) on the server.
⭐ Obtain and decode thermal scan (imaging) buffers and the process type transferred by the web dashboard as Python Arguments. ⭐ After obtaining the required parameters, generate a precise thermal image from the passed thermal scan (imaging) buffers. ⭐ Depending on the passed process type (sample or detection), run an inference with the Edge Impulse FOMO-AD visual anomaly detection model to diagnose thermal cooling malfunctions or save the produced thermal image directly as a sample.
Editor view of the dashboard update handler for system log entries

281


Editor view of the PHP page rendering cooling malfunction records

282

Step 5.3: Running the web application on LattePanda Mu

Since LattePanda Mu is a budget-friendly compute module providing consistent multitasking performance thanks to Intel N100 quad-core processor and 8GB LPDDR5 memory, I decided to host the web application on LattePanda Mu combined with its Lite Carrier board. :hash: After setting up the XAMPP application (lampp) on LattePanda Mu, open the phpMyAdmin tool on the browser manually to create a new database named hvac_system_updates. http://localhost/phpmyadmin/
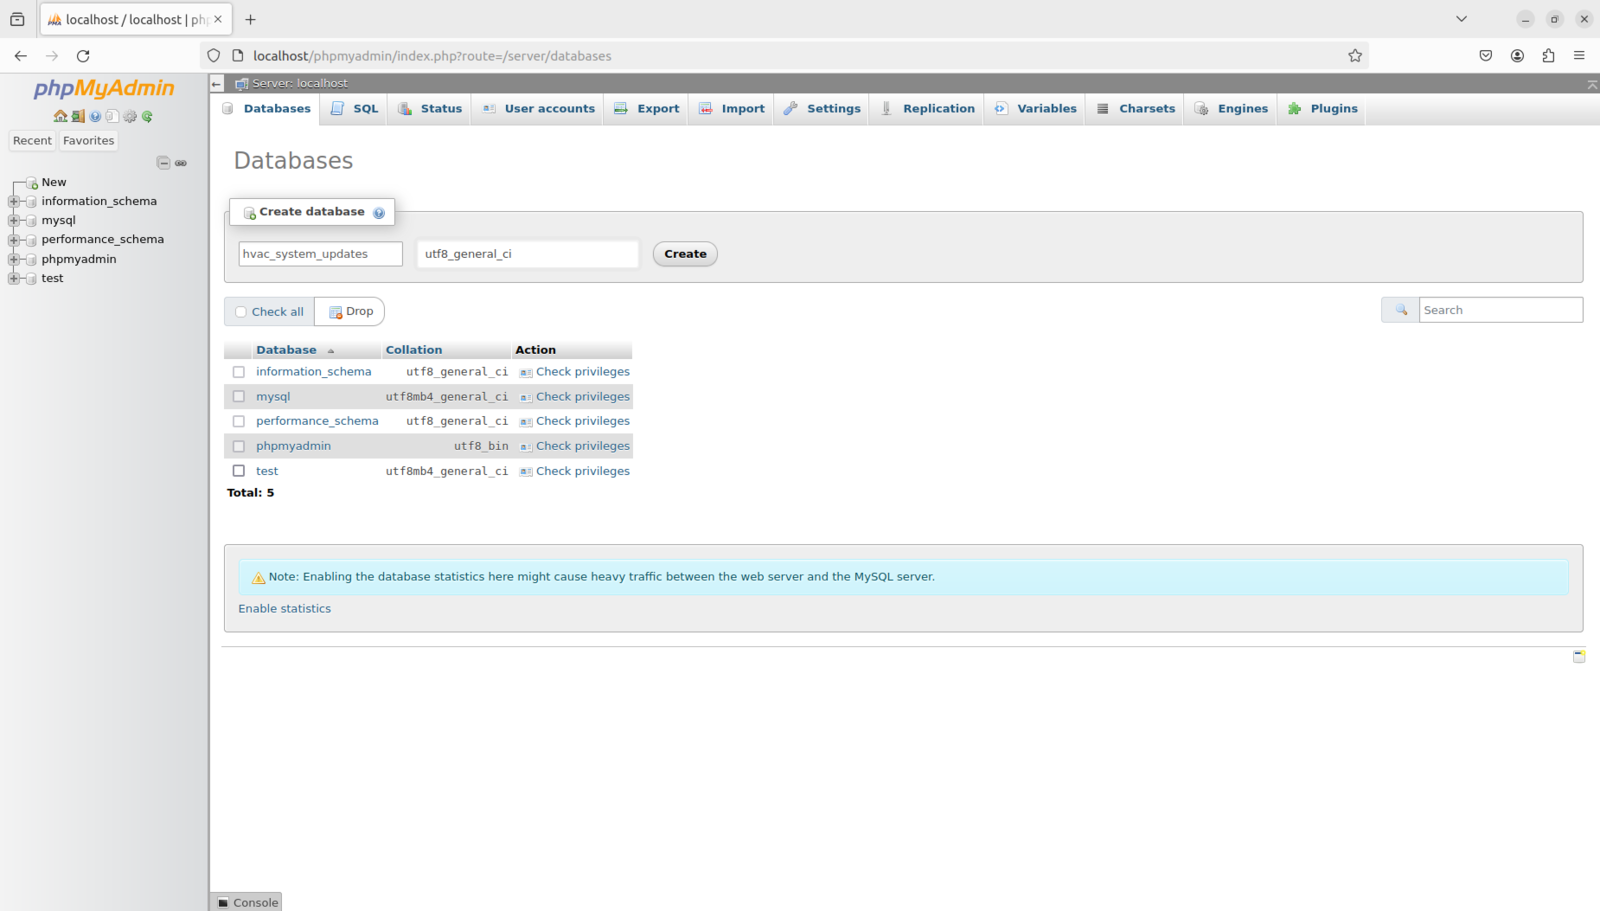
phpMyAdmin home page ready to create the HVAC dashboard database

283

:hash: After adding the database successfully, go to the SQL section to create a MariaDB database table named system_log with the required data fields.
phpMyAdmin table creation form for the system log database schema

284


system_log table structure with fields for classes, dates, and image paths

285


phpMyAdmin browse view showing initial dashboard log records

286

⚠️🔊♨️🖼️ After running the web dashboard for the first time, the home (index) page waits for obtaining the latest system log updates registered on the MariaDB database table. ⚠️🔊♨️🖼️ If there is no registered system log update in the database table, the index page displays the default placeholders to notify the user.
Dashboard home page showing HVAC artwork and category filter buttons for system logs

287


Dashboard view refreshing saved HVAC log entries from the local MariaDB database

288


Thermal image samples page listing generated HVAC thermal captures for download

289


Anomalous sound samples page listing converted WAV files and sample metadata

290

Step 6.a: Setting up XIAO ESP32C6 on Arduino IDE

Although XIAO ESP32C6 is a production-ready and compact IoT development board, before proceeding with the following steps, I needed to set XIAO ESP32C6 on the Arduino IDE, install the required libraries, and configure some default settings. When I was setting up XIAO ESP32C6 on the Arduino IDE, the current stable release of the Arduino-ESP32 board package (2.0.15) did not support the ESP32-C6 chipset. Therefore, I utilized the latest development release (3.0.0-rc1). :hash: First, remove the Arduino-ESP32 board package if you have already installed it on the Arduino IDE.
Arduino IDE Boards Manager search results for installing the ESP32 core

291

:hash: Then, go to Preferences ➡ Additional Boards Manager URLs and add the official development version URL for the Arduino-ESP32 board package: https://espressif.github.io/arduino-esp32/package_esp32_dev_index.json
Arduino IDE board selector set to Seeed Studio XIAO ESP32C6

292


Arduino IDE port selector showing the connected XIAO ESP32C6 board

293

:hash: To install the required core, navigate to Tools ➡ Board ➡ Boards Manager, search for esp32, and select the latest development release, 3.0.0-rc1.
Arduino IDE core version selection for the ESP32 development release

294

:hash: After installing the core, navigate to Tools ➡ Board ➡ ESP32 Arduino and select XIAO_ESP32C6.
Arduino IDE library manager with the required display and sensor libraries installed

295

:hash: Download and inspect the required libraries for the components connected to XIAO ESP32C6: Adafruit_SSD1306 | Download Adafruit-GFX-Library | Download :hash: If the Arduino IDE shows the correct port number but fails to upload the given code file, push and release the RESET button while pressing the BOOT button. Then, XIAO ESP32C6 should accept the uploaded code in the BootLoader mode.

Step 6.b: Setting up Particle Photon 2 on Visual Studio Code and enabling data transmission with the Particle Cloud

Even though C++ is available for programming Particle development products, the Arduino IDE is not suitable due to the additional requirements for the Particle Device OS. Fortunately, Particle officially supports Visual Studio Code (VSCode) and provides the Particle Workbench, which is an integrated development and debugging environment. Since the Particle Workbench capitalizes on the built-in IntelliSense features of VSCode, it makes programming Photon 2 straightforward and effortless. :hash: First, download Visual Studio Code (VSCode) from the official installer. :hash: After installing VS Code, go to Extensions Marketplace and search for the Particle Workbench extension. :hash: While downloading the Workbench extension, VSCode should install and build all dependencies automatically, including the device toolchain, C++ extension, Particle CLI, etc.
Particle Workbench extension installed in Visual Studio Code

296

:hash: After downloading the Workbench extension, go to the Command Palette and select Particle: Create New Project. Then, enter the project directory name.
Particle Workbench command palette for logging in and configuring the device

297

After creating a new project successfully on VSCode, I decided to utilize the Particle web-based setup wizard to configure the required settings for the Particle Cloud easily, providing step-by-step instructions. :hash: First, open the Particle setup wizard on the browser. https://setup.particle.io/
Particle console showing Photon 2 claimed to the account

298

:hash: After initiating the setup process, the wizard requests the user to create a Particle account.
Particle console product creation form for the HVAC control device group

299

:hash: After creating a new account, connect Particle Photon 2 to the computer through the USB port and resume the setup process.
Particle product device list with Photon 2 added as hvac_control

300


Particle device settings page for the selected Photon 2

301

:hash: Then, the setup wizard should recognize Photon 2 (P2) and fetch the board information automatically.
Particle console Device OS version selection for Photon 2

302


Particle console platform selector highlighting Photon 2 and P2

303

:hash: After getting the board information, the setup wizard updates Photon 2 to the latest Device OS and firmware.
Particle console showing the device online after configuration

304

:hash: After updating Photon 2, create a new product (device group) and add Photon 2 to the created product with a unique name, hvac_control.
Particle function panel prepared for remote thermal buffer collection

305


Particle variable panel listing registered thermal buffer strings

306

:hash: Connect Photon 2 to a Wi-Fi network in order to enable data transmission with the Particle Cloud.
Particle Cloud event log showing successful device communication

307


Particle console confirming function calls from the dashboard

308

:hash: Finally, go to the Particle Console to check whether the Cloud connection is established successfully.
Particle console overview with the configured HVAC control product

309

:hash: After setting up Photon 2 successfully via the web-based setup wizard, return to the Workbench extension and select Particle: Configure Project for Device on the Command Palette. :hash: Choose the compatible device OS version and select the target platform, Photon 2 / P2.
Visual Studio Code showing the Particle project files for Photon 2

310

:hash: Then, obtain the device ID from the Particle Console and enter it on the Workbench extension to enable extra features, such as cloud compiling.
Particle Workbench device compile task running for the Photon 2 target

311


Particle Workbench flashing the compiled firmware to the Photon 2

312

Even though Particle supports Arduino libraries, integrating them into the VSCode Workbench extension is not a simple copy-paste process. The Particle development environment requires the following file structure to compile a library. The src folder must contain all of the essential library files (.cpp and .h).
  • MyLibrary/
    • examples/
      • usage/
        • usage.ino
    • src/
      • MyLibrary.cpp
      • MyLibrary.h
    • library.properties
    • README.md
    • LICENSE
Thus, we need to modify the file structure of an existing Arduino library if it is not compatible with that of Particle. Nevertheless, Particle provides a plethora of production-ready Arduino libraries maintained by the Particle community. Thus, adding officially supported Arduino libraries to the Workbench extension is uncomplicated. :hash: First, search for the required library on the Particle libraries ecosystem via the Library search tool. :hash: If there is a supported version of the library in the ecosystem, go to the Workbench Welcome Screen and click Code ➜ Install library. :hash: Then, enter the library name to install the given library with all dependencies. Following the discussed steps, I installed these libraries from the Particle libraries ecosystem: Adafruit_GFX_RK | Inspect Adafruit_ST7735_RK | Inspect After installing the supported libraries, I modified the remaining Arduino libraries required for the components connected to Photon 2: Seeed_Arduino_MLX9064x | Inspect You can download the Arduino libraries I modified for the Particle development environment below.
Particle project library search for the MLX90641 thermal camera dependencies

313


Particle Workbench libraries added for the TFT display and thermal imaging camera

314

After completing setting up libraries, I tested the connection quality between Photon 2 and the Particle Cloud by utilizing the provided cloud transmission methods, Particle.variable() and Particle.function().
Particle Cloud console showing a successful variable or function test for Photon 2 communication

315

After ensuring consistent cloud data transmission, I needed to generate a user access token to make the web application (dashboard) employ the Particle Device Cloud API to communicate with the Particle Cloud. Despite the fact that the Particle CLI lets the user generate access tokens, you can also create a token using the official web-based token generation tool on the browser. :hash: After signing in to your account, go to the web-based token generation tool, enter the expiration time, and create a new user access token.
Particle account settings page for creating a new access token

316


Particle token creation dialog used by the web dashboard Particle Cloud API calls

317

Step 6.c: Displaying images on the SSD1306 OLED screen and the ST7735 TFT display

I followed the exact same process to display images on the SSD1306 OLED screen (XIAO ESP32C6) and the ST7735 TFT display (Photon 2). :hash: To be able to display images (icons), first convert image files (PNG or JPG) to monochromatic bitmaps. Then, convert the generated bitmaps to compatible C data arrays. I decided to utilize LCD Assistant to create C data arrays. :hash: After installing LCD Assistant, upload a monochromatic bitmap and select Vertical or Horizontal, depending on the screen type. :hash: Then, save all the converted C data arrays to the logo.h file. ⭐ In the logo.h file, I defined multi-dimensional arrays to group the assigned logos and their sizes (width and height).
Online image converter with a logo prepared for monochrome bitmap conversion

318


Bitmap conversion output showing C array data for the display icon

319


logo.h file containing grouped bitmap arrays for OLED and TFT interface icons

320

Step 7: Collecting the raw audio buffers produced by the I2S MEMS microphone

After setting up all development boards on their associated software, I started to work on improving and refining code to perform functions flawlessly. First, I focused on programming XIAO ESP32C6, which manages audio sample collection and data transmission to the web application. As explained in the previous steps, the device performs lots of interconnected features between different development boards and the web application for data collection and running advanced AI models. Thus, the described code snippets show the different aspects of the same code file. Please refer to the code files or the demonstration videos to inspect all interconnected functions in detail. 📁 HVAC_fault_diagnosis_anomalous_sound.ino ⭐ Include the required libraries.
⭐ Add the icons to be shown on the SSD1306 OLED display, which are saved and grouped in the logo.h file.
⭐ Define the required server configurations for the web application hosted on LattePanda Mu. ⭐ Then, initialize the WiFiClient object.
⭐ Define the Fermion I2S MEMS microphone pin configurations, audio sample bits, and the I2S processor port.
⭐ Configure the SSD1306 screen settings.
⭐ In the i2s_install function, configure the I2S processor port with the passed sampling rate and set the channel format as ONLY_RIGHT.
⭐ In the i2s_setpin function, assign the given I2S microphone pin configurations to the defined I2S port via the built-in I2S driver.
⭐ Wait until XIAO ESP32C6 establishes a successful connection with the given Wi-Fi network.
⭐ According to the pressed control button (A or C), adjust the highlighted menu option number by one: -1 (UP) or +1 (DOWN).
⭐ In the show_interface function: ⭐ According to the passed screen command and menu option number, get the assigned icon information, show the home screen with the highlighted menu option, or display the associated layout after the highlighted menu option is selected. ⭐ Depending on the status of the CNC positioning process (Waiting, Ongoing, Saved, or Image Ready), display the associated buffer operation status indicator on the screen for each positioning point (location). ⭐ Show the associated class icon and name according to the audio class predicted by the Audio MFE model.
⭐ In the microphone_sample function: ⭐ Obtain the information generated by the I2S microphone and save it to the input buffer, sample_audio_buffer. ⭐ If the I2S microphone generates raw audio data successfully, scale the produced raw audio buffer depending on the model requirements. Otherwise, the sound might be too quiet for classification. ⭐ If requested for debugging, display the average (mean) output values on the serial plotter.
⭐ In the make_a_post_request function: ⭐ Connect to the web application with the configured server settings. ⭐ Create the query string by appending the passed URL query (GET) parameters. ⭐ Define the AudioSample boundary parameter to transfer the produced raw audio sample to the web application as a plain text file. ⭐ Estimate the total message (content) length. ⭐ Initiate an HTTP POST request with the created query string as additional URL parameters to the web application. ⭐ While making the POST request, according to the defined buffer multiplier, collect and write (transfer) raw audio buffers consecutively to prevent memory allocation issues. ⭐ Then, conclude data (buffer) writing and the POST request. ⭐ Wait until fully transferring the raw audio sample produced from individual buffers.
⭐ After highlighting a menu option on the home screen, if the control button B is pressed, navigate to the selected option’s layout. ⭐ If the first option (Collect Audio) is activated: ⭐ Inform the user of the audio sample collection settings on the SSD1306 screen. ⭐ According to the pressed control button (A or C), select an audio class for the sample.
  • A ➜ normal
  • C ➜ defective
⭐ Before producing an audio sample, check the I2S microphone status by running the microphone_sample function once. ⭐ If the I2S microphone generates a raw audio buffer as expected, notify the user on the screen. ⭐ Then, collect raw audio buffers and transfer them simultaneously to the web application until reaching the predefined buffer multiplier number in order to send the produced audio sample without triggering memory allocation errors. ⭐ Notify the user of the web application data transmission success on the screen by showing the associated status icons. ⭐ If the control button D is pressed, redirect the user to the home screen.
Editor view of XIAO ESP32C6 Wi-Fi, I2S microphone, and OLED setup code

321


Editor view of XIAO ESP32C6 OLED menu rendering code

322


Editor view of XIAO ESP32C6 audio POST request code for raw buffer transfer

323


Editor view of XIAO ESP32C6 menu handling for Collect Audio mode

324


Editor view of XIAO ESP32C6 button handling and sample class selection code

325

Step 7.1: Generating raw audio samples and passing the produced samples to the web application for saving them as WAV files

⚠️🔊♨️🖼️ If XIAO ESP32C6 establishes a successful connection with the given Wi-Fi network and all connected components operate as expected, the device shows the home screen on the SSD1306 OLED display.
  • Collect Audio
  • Faulty Sound
  • CNC Positioning & Thermal Buffer Collection
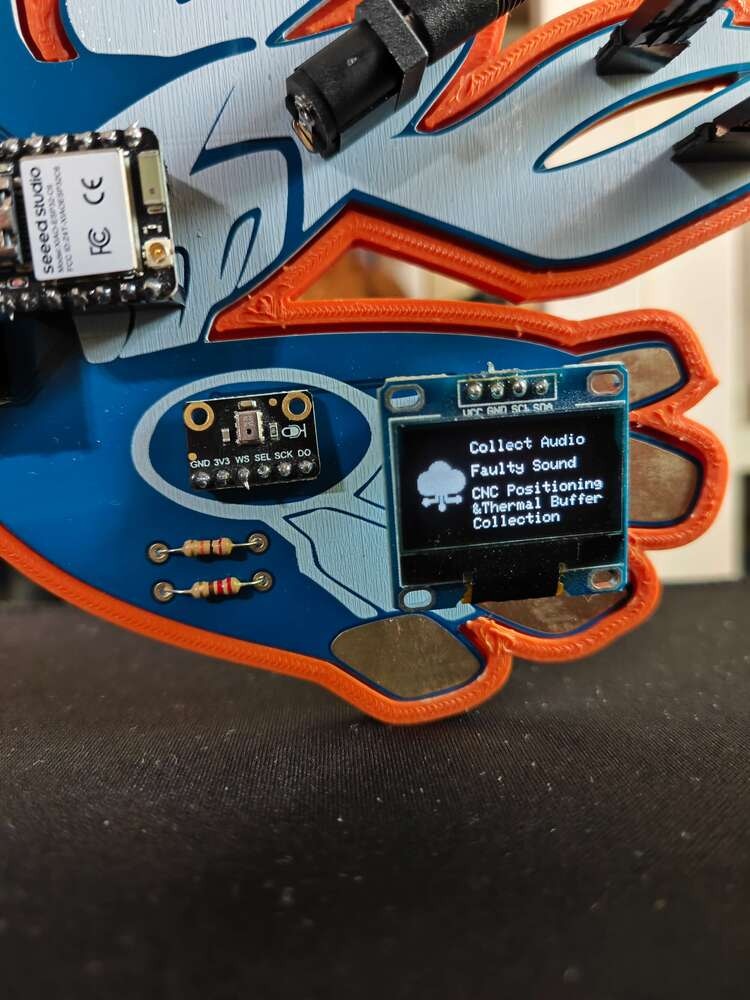
XIAO ESP32C6 OLED home screen with Collect Audio, Faulty Sound, and CNC options

326

⚠️🔊♨️🖼️ The device lets the user adjust the highlighted menu option on the home screen by pressing the control buttons: A (↑) and C (↓). ⚠️🔊♨️🖼️ After changing the highlighted menu option, the device also updates the icon on the home screen with the assigned option icon. ⚠️🔊♨️🖼️ As a menu option is highlighted, if the control button B is pressed, the device navigates to the selected option’s layout. ⚠️🔊♨️🖼️ Note: If the user presses the control button D, XIAO ESP32C6 returns to the home screen.
OLED menu with the highlighted option changed using the control buttons

327

⚠️🔊♨️🖼️ If the user activates the first menu option, Collect Audio: ⚠️🔊♨️🖼️ On the associated layout, the device informs the user of the audio sample collection settings, which allow the user to assign an audio class to the sample by pressing a control button.
  • A ➜ normal
  • C ➜ defective
Collect Audio screen listing normal and defective button choices

328

⚠️🔊♨️🖼️ After selecting an audio class, the device checks whether the I2S microphone operates accurately and informs the user regarding the microphone status on the screen before producing an audio sample.
OLED status screen checking the I2S microphone before sampling

329

⚠️🔊♨️🖼️ If the I2S microphone works as expected, the device collects raw audio buffers and transfers them simultaneously to the web application until reaching the predefined buffer multiplier number while maintaining an HTTP POST request. ⚠️🔊♨️🖼️ In this regard, the device can produce and send long raw audio samples to the web application without triggering memory allocation issues. ⚠️🔊♨️🖼️ After concluding the POST request, the device notifies the user of the data transmission success on the screen by showing the associated status icons.
OLED success screen after transferring the raw audio sample to the dashboard

330

⚠️🔊♨️🖼️ As explained in the previous steps, after receiving the produced raw audio sample, the web application saves the sample as a plain text file temporarily. ⚠️🔊♨️🖼️ Then, the web application runs a Python script to convert the raw audio sample to a WAV audio file compatible with Edge Impulse. ⚠️🔊♨️🖼️ After converting the given sample with the passed audio conversion parameters successfully, the web application updates the system log on the MariaDB database accordingly. ⚠️🔊♨️🖼️ Finally, the web application updates its home (index) page automatically to showcase the latest system log entries. In addition to displaying the collection dates and the assigned audio classes, the web application lets the user download audio samples individually on the home page.
Dashboard notification after receiving a new raw audio buffer from XIAO ESP32C6

331


Web application file list showing the saved raw audio sample before conversion

332


Dashboard audio sample entry after the WAV conversion script finishes

333


Audio samples dashboard entry showing converted normal and defective fan recordings

334

After collecting samples of normal and defective sound originating from the HVAC system cooling fans, I managed to construct a valid audio data set stored on the web application.
Animation of XIAO ESP32C6 collecting fan audio and the dashboard saving the converted sample

335


Dashboard audio sample table listing saved normal and defective WAV files

336

Step 8.a: Controlling CNC (thermal camera container head) motions via Arduino Nano

Since I decided to build a fully 3D-printable custom CNC router to position the MLX90641 thermal imaging camera, I needed to design a separate CNC control mechanism based on Arduino Nano. In this regard, I was able to move the thermal camera container head according to the CNC commands received via serial communication. After programming XIAO ESP32C6, I focused on improving and refining CNC functions performed by Arduino Nano. 📁 HVAC_thermal_camera_CNC.ino ⭐ Include the required libraries.
⭐ Define the 28BYJ-48 stepper motor configurations and initialize the stepper object.
⭐ Define a software serial port (XIAO) since the default (USB) hardware serial port is occupied for debugging.
⭐ Define all of the required CNC commands and step numbers by creating a struct (_CNC) so as to organize and call them efficiently.
⭐ Initiate the defined software serial port to communicate with XIAO ESP32C6.
⭐ In the CNC_motor_move function: ⭐ Rotate the stepper motor of the CNC router to move the thermal camera container head according to the passed step number and the direction.
  • CW: Clockwise
  • CCW: Counter-clockwise
⭐ While turning the stepper motor counter-clockwise, check whether the thermal camera container head triggers the micro switch by colliding. ⭐ If so, force the container head to return to the home position. Then, turn the RGB LED to white.
⭐ In the CNC_position_home function, return the thermal camera container head to the home position 0.
⭐ Obtain the data packet transferred by XIAO ESP32C6 via serial communication.
⭐ Depending on the received CNC coordinate update command, change the thermal camera container head position by rotating the stepper motor by the predefined step number. ⭐ When starting the positioning process, turn the RGB LED to red. After completing the positioning process, turn the RGB LED to yellow. ⭐ Then, send the coordinate update confirmation message CNC_OK to XIAO ESP32C6 via serial communication. ⭐ After sending the confirmation message, turn the RGB LED to green. ⭐ After going through four coordinate updates, if XIAO ESP32C6 transmits the zeroing command, return the thermal camera container head to the starting point (zeroing) by estimating the total revolved step number. ⭐ When starting the zeroing process, turn the RGB LED to red. After completing the zeroing process, turn the RGB LED to yellow. ⭐ Then, send the zeroing confirmation message CNC_OK to XIAO ESP32C6 via serial communication. ⭐ After sending the zeroing confirmation message, turn the RGB LED to purple. ⭐ Finally, clear the received data packet.
⭐ If the home button is pressed, initiate the container head homing sequence, which returns the container head to the home position (0) by utilizing the micro switch.
Editor view of Arduino Nano CNC motor setup and serial communication code

337


Editor view of CNC homing and coordinate movement functions

338


Editor view of CNC command handling with RGB status updates

339

Step 8.b: Communicating with Arduino Nano and the web application to initiate the four-step CNC positioning sequence for consecutive thermal imaging buffer collection via the Particle Cloud

After completing the CNC router programming, controlled by Arduino Nano, I focused on improving the remaining XIAO ESP32C6 features, including transferring commands to Arduino Nano and communicating with the web application regarding thermal imaging buffer collection. As explained in the previous steps, the device performs lots of interconnected features between different development boards and the web application for data collection and running advanced AI models. Thus, the described code snippets show the different aspects of the same code file. Please refer to the code files or the demonstration videos to inspect all interconnected functions in detail. 📁 HVAC_fault_diagnosis_anomalous_sound.ino ⭐ Define all of the required CNC commands and variables by creating a struct (_CNC) so as to organize and call them efficiently.
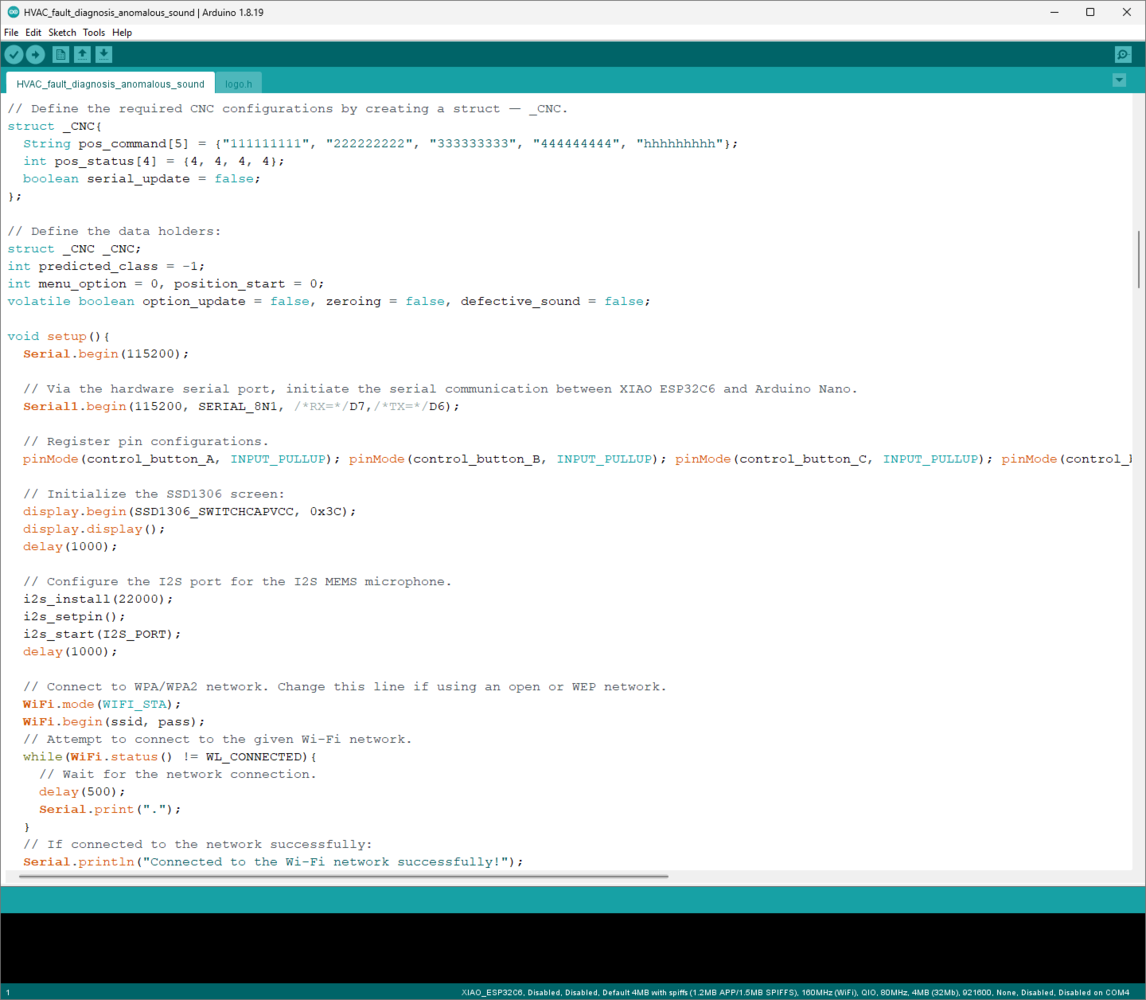
⭐ Initiate the hardware serial port (Serial1) to communicate with Arduino Nano.
⭐ In the make_a_get_request function: ⭐ Connect to the web application with the configured server settings. ⭐ Create the query string by appending the passed URL query (GET) parameters. ⭐ Make an HTTP GET request with the given URL parameters to the web application. ⭐ Wait until successfully completing the request process.
⭐ In the nano_update_response function: ⭐ Wait until Arduino Nano transfers a data packet via serial communication. ⭐ Then, return the obtained data packet.
⭐ In the thermal_buffer_collection_via_CNC function: ⭐ Initiate the four-step CNC positioning sequence consisting of different CNC commands, from 1 to 4. ⭐ For each CNC positioning command: ⭐ Transfer the given command to Arduino Nano via serial communication. ⭐ Update the buffer operation status indicator to Ongoing on the screen with the associated status icon. ⭐ Wait until Arduino Nano replies with the coordinate update confirmation message (CNC_OK) via serial communication after moving the thermal camera container head to the predefined position. ⭐ After obtaining the confirmation message, update the buffer status indicator to Completed on the screen with the associated status icon. ⭐ After positioning the container head according to the passed CNC command, make an HTTP GET request to the web application (dashboard) in order to make Photon 2 collect and register the associated thermal imaging buffer through the Particle Cloud API. ⭐ If the GET request is successful, update the buffer status indicator to Saved on the screen with the associated status icon. ⭐ Then, increase the command number to resume the positioning sequence. ⭐ After concluding the four-step CNC positioning sequence successfully, return the thermal camera container head to the starting point (zeroing) by transmitting the zeroing command to Arduino Nano via serial communication. ⭐ Wait until Arduino Nano replies with the zeroing confirmation message (CNC_OK) via serial communication after moving the thermal camera container head to the starting point. ⭐ After obtaining the zeroing confirmation message, change all buffer status indicators on the screen to Image Ready. ⭐ After finalizing the CNC positioning sequence and the zeroing procedure, make a successive HTTP GET request to the web application to initiate the thermal image conversion process with the thermal imaging buffers registered on the Particle Cloud. ⭐ If the GET request is successful, halt all processes and redirect the user to the home screen.
⭐ If the third option (CNC Positioning & Thermal Buffer Collection) is activated: ⭐ Clear the previously assigned buffer status indicators. ⭐ Initiate the four-step CNC positioning sequence so as to move the thermal camera container head to the predefined locations for consecutive thermal scan (imaging) buffer collection through the Particle Cloud API. ⭐ Notify the user of each buffer status indicator update by showing their associated status icons on the SSD1306 screen: Waiting, Ongoing, Saved, and Image Ready. ⭐ If the control button D is pressed, redirect the user to the home screen.
Editor view of XIAO ESP32C6 CNC command and HTTP request functions

340


Editor view of XIAO ESP32C6 CNC thermal buffer collection workflow

341

Step 8.c: Generating the required thermal imaging buffers via a specific color algorithm and registering the produced buffers to Particle Cloud variables

After working on the XIAO ESP32C6 data transmission procedure with the web application and the custom CNC router positioning sequence, I focused on developing and improving Particle Photon 2 functions related to thermal imaging buffer collection and registration. As discussed earlier, I set up the Particle Workbench on Visual Studio Code (VSCode) to be able to utilize the Particle Device OS to program Photon 2. You can inspect the integrated Particle Cloud transmission methods of the Device OS and their limitations from here. 📁 HVAC_fault_diagnosis_thermal_image.cpp ⭐ Include Particle Device OS APIs.
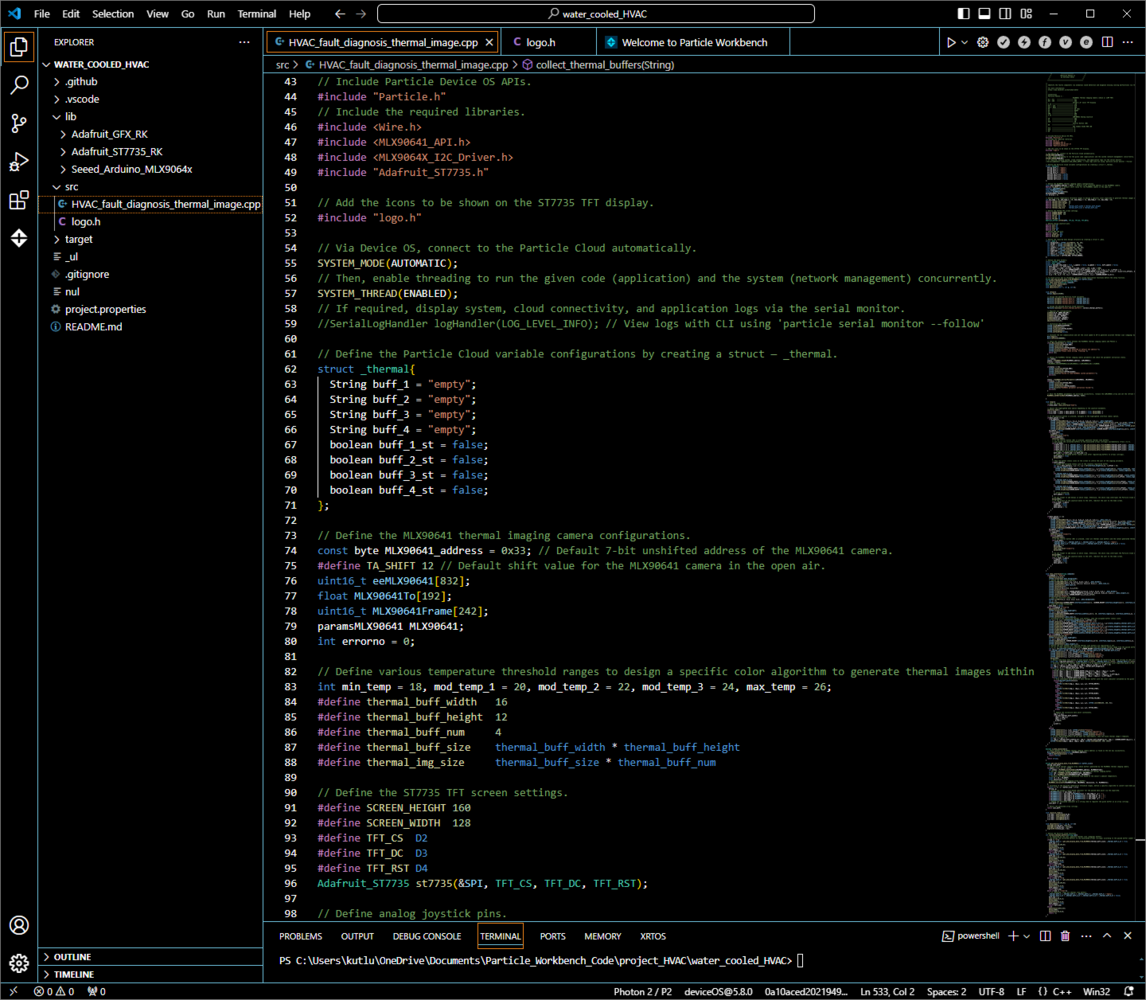
⭐ Include the required libraries.
⭐ Add the icons to be shown on the ST7735 TFT display, which are saved and grouped in the logo.h file.
⭐ Via the built-in Device OS functions, connect to the Particle Cloud automatically. ⭐ Then, enable threading to run the given program (application) and the built-in cloud transmission system (network management) concurrently.
⭐ Define the Particle Cloud variable names and registration status indicators by creating a struct (_thermal) so as to organize and call them efficiently.
⭐ Define the MLX90641 thermal imaging camera configurations, including the 7-bit unshifted device address and the open air shift value.
⭐ To create a specific color algorithm for converting IR array data items to color-based indicators to produce a thermal imaging buffer, define temperature threshold ranges. Then, define the required information to generate a preview (snapshot) thermal image from the produced buffers.
⭐ Configure the ST7735 TFT screen settings.
⭐ Define the required variables for the home screen and the option layouts by creating a struct (_menu) so as to organize and call them efficiently.
⭐ To prevent errors due to threading that manages simultaneous cloud transmission, declare custom application functions before the setup function.
⭐ Assign new variables to the Particle Cloud by utilizing the built-in Particle.variable method.
⭐ Assign new functions to the Particle Cloud by utilizing the built-in Particle.function method.
⭐ Initialize the ST7735 screen with the required configurations.
⭐ Initiate the I2C communication and set the clock speed to 2M to generate accurate thermal scan (imaging) buffers via the MLX90641 thermal imaging camera.
⭐ Check the I2C connection success with the MLX90641 thermal imaging camera and the camera parameter extraction status. ⭐ If the thermal imaging camera operates as expected and the parameter extraction is successful, release the eeMLX90641 array and set the refresh rate to 16 Hz.
⭐ According to the analog joystick movements (UP or DOWN), adjust the highlighted menu option number and the screen update status.
⭐ In the show_interface function: ⭐ According to the passed screen command and the menu option number, show the default home screen or the selected option layout. ⭐ Stop the home screen flickering by showing it for once when requested in the loop. ⭐ If the screen command is scan: ⭐ Show the associated interface icon on the layout. ⭐ Then, display the registration status indicators for each thermal imaging buffer with the assigned icons. ⭐ If the screen command is inspect: ⭐ Show the associated interface icon on the layout. ⭐ If all thermal scan (imaging) buffers are collected and registered successfully: ⭐ Obtain individual data points of each produced thermal buffer by converting them from strings to char arrays. ⭐ For each passed thermal imaging buffer ((16x12) x 4): ⭐ Define the coordinates for the first pixel. ⭐ Starting with the first pixel, draw each individual data point with the color indicator to display an accurate preview thermal image on the screen, estimated by the specific color algorithm based on the defined temperature threshold ranges. ⭐ After drawing a pixel successfully, update the successive data point coordinates. ⭐ If the registered thermal buffers do not meet the requirements, show the blank preview image to notify the user.
⭐ In the get_and_display_data_from_MLX90641 function: ⭐ Get the required variables generated by the MLX90641 thermal imaging camera to calculate the IR array (16x12). ⭐ Estimate the temperature reflection loss based on the sensor’s ambient temperature. ⭐ Then, compute and store the IR array. ⭐ Apply the specific algorithm based on the defined temperature ranges to convert each data point of the given IR array to color-based indicators. ⭐ Then, produce the thermal scan (imaging) buffer by appending each evaluated color indicator to the given string variable. ⭐ Finally, return the produced thermal imaging buffer string.
⭐ After changing the menu option number, highlight the selected option and show the associated icon on the home screen. ⭐ After highlighting a menu option on the home screen, if the joystick button is pressed, navigate to the selected option’s layout. ⭐ If the first option (Scan) is activated: ⭐ If the control button OK is pressed, produce a thermal imaging buffer and assign the generated buffer to the predefined string variable linked to the Particle Cloud variable according to the current buffer number, from 0 to 3. Also, update the associated buffer registration status indicator as registered. ⭐ Then, increase the buffer number incrementally. ⭐ After registering thermal buffers, show the buffer status indicators with the assigned icons on the screen to inform the user of the ongoing procedure. ⭐ To avoid flickering, only update the latest changed buffer status indicator. ⭐ If the analog joystick moves to the left, redirect the user to the default home screen. :hash: As mentioned earlier, the string variables are linked to the Particle Cloud variables. Since Photon 2 updates the cloud variables automatically when the linked variables are modified, do not forget to add delays in while loops. Otherwise, the while loop interrupts and blocks the Particle Cloud network connection (threading).
⭐ If the second option (Inspect) is activated: ⭐ Display the preview thermal image generated from the registered thermal imaging buffers on the layout. ⭐ If the registered thermal buffers do not meet the requirements, show the blank preview image. ⭐ If the control button OK is pressed, clear all registered thermal scan buffers and set their status indicators as blank. Then, remove the latest preview thermal image by displaying the blank one. ⭐ If the analog joystick moves to the left, redirect the user to the default home screen. :hash: Do not forget to add delays in while loops. Otherwise, the while loop interrupts and blocks the Particle Cloud network connection (threading).
⭐ In the collect_thermal_buffers function: :hash: As discussed earlier, this function is linked to a Particle Cloud function. Thus, the Particle Cloud API can access and execute the given function remotely. ⭐ According to the passed buffer number (from 1 to 4), produce a thermal imaging buffer and assign the generated buffer to the predefined string variable linked to the Particle Cloud variable. ⭐ Also, update the associated buffer status indicator as registered and blink the RGB LED as green to notify the user of the buffer registration success. ⭐ If requested, clear all registered thermal scan buffers and set their status indicators as blank.
Editor view of Particle Photon 2 libraries, cloud variables, and thermal camera setup

342


Editor view of Particle Photon 2 TFT menu rendering functions

343


Editor view of the MLX90641 thermal buffer conversion algorithm

344


Editor view of Particle Cloud variable registration for thermal buffers

345


Editor view of Photon 2 joystick handling for scan and inspect modes

346


Editor view of thermal buffer collection and status indicator updates

347


Editor view of TFT preview image drawing from registered thermal buffers

348


Editor view of Particle Photon 2 RGB LED and interface utility functions

349

Step 8.d: Producing accurate thermal images from the registered buffers and saving them as samples via the web application

⚠️🔊♨️🖼️ If the user presses the home button, Arduino Nano homes the thermal camera container head by employing the micro switch on the CNC router. ⚠️🔊♨️🖼️ When the homing sequence starts, Arduino Nano turns the RGB LED to blue. After returning the container head to the home position (0), it turns the RGB LED to white.
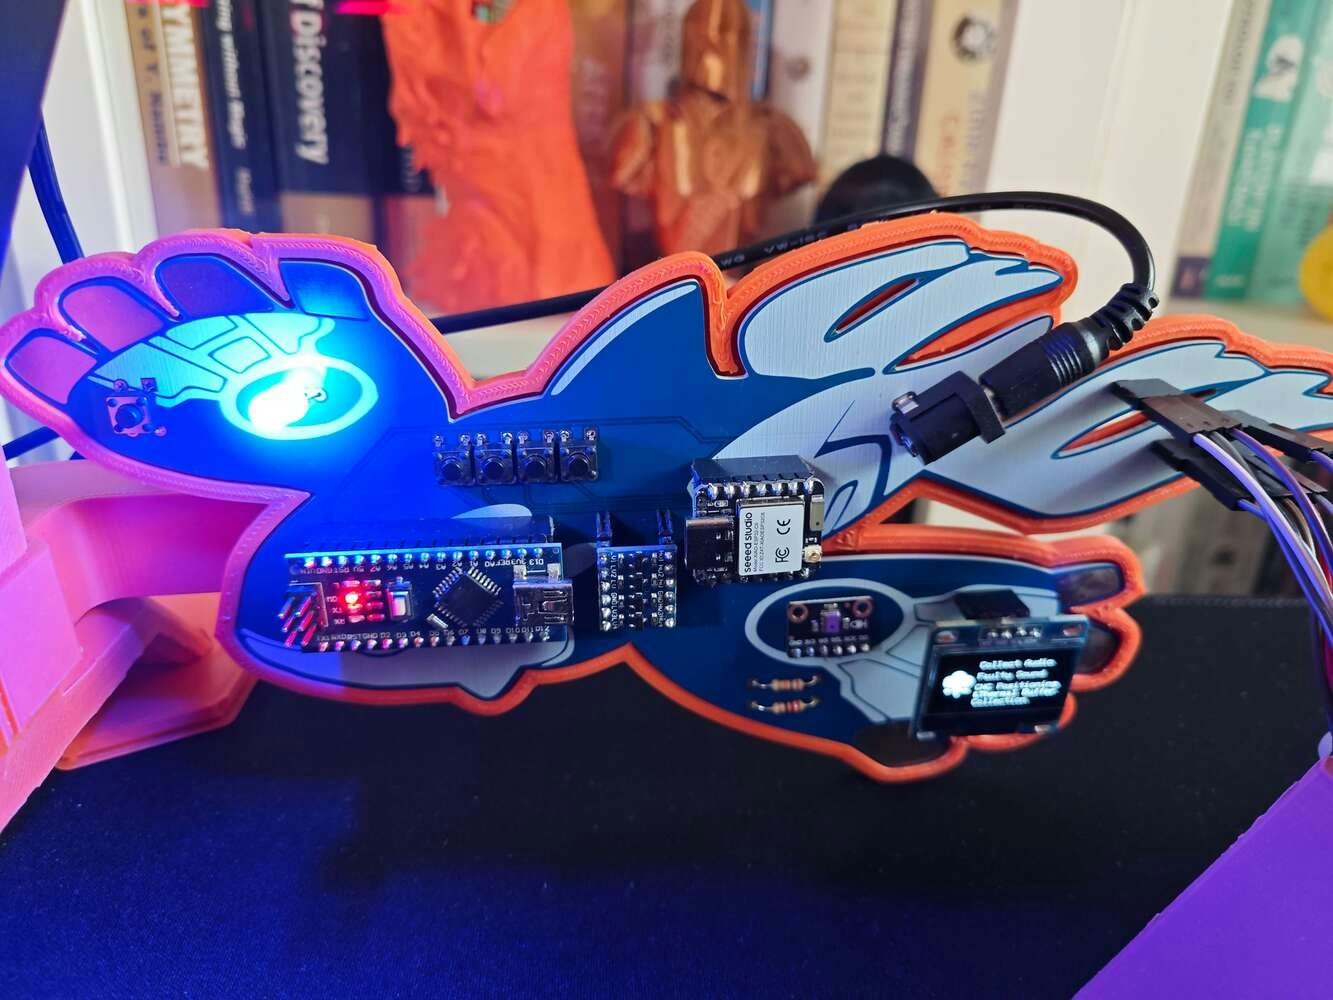
CNC thermal camera head returned to the home position beside the micro switch

350


CNC thermal camera head returned to the home position beside the micro switch

351


Animation of the CNC thermal camera head homing against the micro switch

352

⚠️🔊♨️🖼️ If Particle Photon 2 establishes a successful connection with the Particle Cloud and all connected components operate as expected, the device shows the home screen on the ST7735 TFT display.
  • Scan
  • Inspect
⚠️🔊♨️🖼️ The device lets the user adjust the highlighted menu option on the home screen by moving the analog joystick: UP (↑) and DOWN (↓). ⚠️🔊♨️🖼️ After changing the highlighted menu option, the device also updates the icon on the home screen with the assigned option icon. ⚠️🔊♨️🖼️ As a menu option is highlighted, if the joystick button is pressed, the device navigates to the selected option’s layout. ⚠️🔊♨️🖼️ Note: If the user moves the joystick to the left, Photon 2 returns to the default home screen.
Photon 2 TFT home screen with Scan and Inspect choices for thermal buffers

353

⚠️🔊♨️🖼️ If the user activates the first menu option, Scan: ⚠️🔊♨️🖼️ The device shows the current buffer registration status indicators with the assigned icons on the screen to inform the user of the ongoing procedure. Then, the device turns the RGB LED to cyan. ⚠️🔊♨️🖼️ The device lets the user manually produce thermal imaging buffers and register the generated buffers to the linked Particle Cloud variables by pressing the control button OK. For each press, the device registers the produced buffer to the Particle Cloud incrementally, from 1 to 4. ⚠️🔊♨️🖼️ After registering a thermal imaging buffer successfully, the device updates the associated buffer status indicator as registered.
TFT Scan screen listing four thermal buffer registration indicators

354


TFT display after registering initial thermal scan buffers

355


TFT display with additional thermal buffers saved during manual scan mode

356


TFT display showing all four thermal buffers registered successfully

357


Photon 2 and thermal camera positioned beside the aluminum cooling blocks

358


TFT thermal preview generated from the registered buffer set

359

:hash: Since XIAO ESP32C6 communicates with the web application (dashboard) to handle the thermal imaging buffer collection in sync with the four-step CNC positioning sequence, the following descriptions show features performed by XIAO ESP32C6 and Photon 2 in tandem. ⚠️🔊♨️🖼️ If the user activates the third menu option provided by XIAO ESP32C6, CNC Positioning & Thermal Buffer Collection: ⚠️🔊♨️🖼️ The device shows the buffer operation status indicators with the assigned icons on the SSD1306 OLED display for each thermal imaging buffer as Waiting.
OLED CNC positioning screen showing the first point status indicator

360


OLED CNC positioning screen after the first coordinate update

361

⚠️🔊♨️🖼️ XIAO ESP32C6 transfers the first CNC positioning command to Arduino Nano via serial communication to initiate the four-step CNC positioning sequence. Then, the device updates the first buffer operation status indicator to Ongoing. ⚠️🔊♨️🖼️ After XIAO ESP32C6 sends a CNC positioning command, Arduino Nano informs the user of the positioning process by adjusting the RGB LED color.
  • Red ➡ command received via serial communication
  • Yellow ➡ the positioning process is completed
  • Green ➡ the coordinate update confirmation message CNC_OK sent (replied) to XIAO ESP32C6 via serial communication
⚠️🔊♨️🖼️ After receiving the coordinate update confirmation message, XIAO ESP32C6 updates the associated buffer operation status indicator to Completed on the screen.
CNC camera carriage moving toward the next aluminum block scan point

362


OLED CNC positioning screen with multiple buffer status indicators updated

363


CNC carriage aligned over a cooling block for thermal buffer capture

364


OLED screen showing saved status for another thermal buffer

365


CNC carriage advancing along the rods during the four-point scan

366

⚠️🔊♨️🖼️ Then, XIAO ESP32C6 makes an HTTP GET request to the web dashboard in order to make Photon 2 produce a thermal imaging buffer and register the generated buffer to the first linked cloud variable via the Particle Cloud API. ⚠️🔊♨️🖼️ After making the GET request successfully, the device updates the associated buffer operation status indicator to Saved on the screen.
OLED status screen indicating the thermal image is ready after buffer collection

367

⚠️🔊♨️🖼️ After the web application runs the linked cloud function via the Particle Cloud API, Photon 2 employs the MLX90641 thermal imaging camera to generate a 16x12 IR array. ⚠️🔊♨️🖼️ Then, Photon 2 applies the specific color algorithm to convert the generated IR array to a thermal imaging buffer based on the predefined temperature thresholds.
  • ‘w’ ➜ White
  • ‘c’ ➜ Cyan
  • ‘b’ ➜ Blue
  • ‘y’ ➜ Yellow
  • ‘o’ ➜ Orange
  • ‘r’ ➜ Red
⚠️🔊♨️🖼️ After producing the thermal imaging buffer successfully, Photon 2 turns the RGB LED to green and updates the first buffer registration status indicator to registered. ⚠️🔊♨️🖼️ Since Photon 2 updates the cloud variables automatically as the linked program variables are modified, the produced thermal imaging buffer is registered to the first linked cloud variable automatically. ⚠️🔊♨️🖼️ Then, the device turns off the RGB LED.
Generated thermal sample image displayed after the first CNC scan sequence

368


Thermal image result page showing a stable cooling pattern

369


Thermal image result page showing a warmer cooling block region

370

⚠️🔊♨️🖼️ Until concluding the four-step CNC positioning sequence and registering all required thermal imaging buffers to the Particle Cloud, the device repeats the same procedure.
CNC rig at an intermediate scan point with the RGB status LED active

371


OLED display showing later CNC positioning progress during buffer collection

372


CNC carriage near the far scan point over the aluminum blocks

373


Generated thermal image after a later CNC scan point sequence

374


Thermal preview with hotter color regions from the simulated malfunction

375


OLED screen with saved and completed indicators for the scan sequence

376


Thermal camera head moving back across the CNC rods

377


OLED screen showing the final buffer status before zeroing

378


Thermal image result with varied heat distribution across both aluminum blocks

379


Thermal image preview showing stronger warm regions after heating

380


CNC carriage returning after collecting all thermal buffers

381


OLED screen showing image-ready status for the completed four-point scan

382


CNC assembly with thermal camera and wiring after the positioning sequence

383


Generated thermal image used for malfunction model testing

384


Thermal result view with visible hot zones on the scanned cooling blocks

385

⚠️🔊♨️🖼️ After finalizing the four-step CNC positioning sequence, XIAO ESP32C6 transmits the CNC zeroing command to Arduino Nano via serial communication. ⚠️🔊♨️🖼️ Then, Arduino Nano returns the thermal camera container head to the starting point (zeroing) by estimating the total revolved step number. ⚠️🔊♨️🖼️ After XIAO ESP32C6 sends the zeroing command, Arduino Nano informs the user of the zeroing process by adjusting the RGB LED color.
  • Red ➡ command received via serial communication
  • Yellow ➡ the zeroing process is completed
  • Purple ➡ the zeroing confirmation message CNC_OK sent (replied) to XIAO ESP32C6 via serial communication
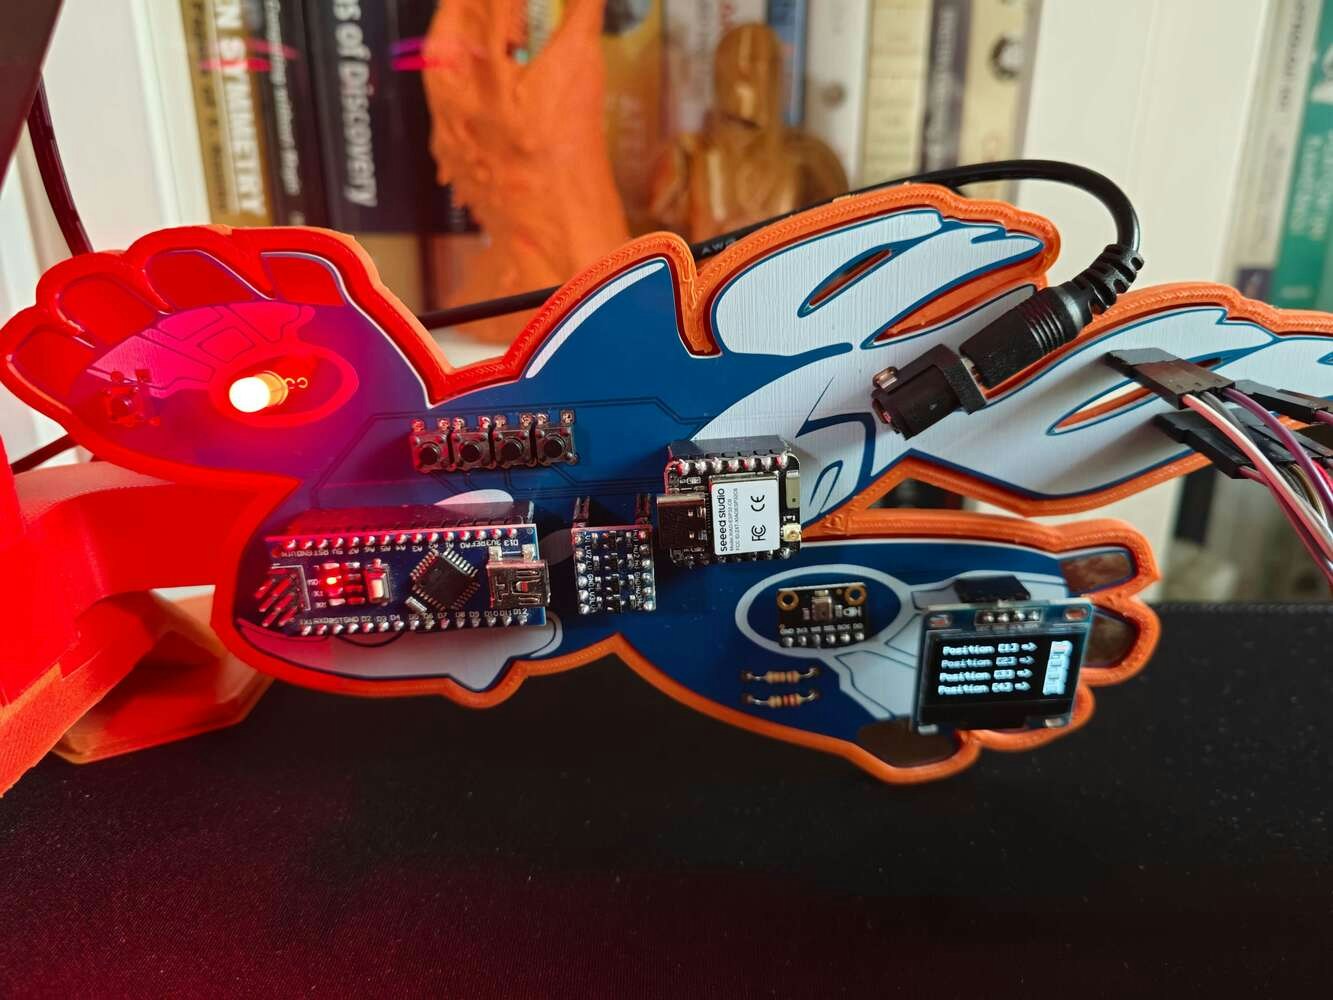
⚠️🔊♨️🖼️ After obtaining the zeroing confirmation message, XIAO ESP32C6 updates all buffer operation status indicators to Image Ready on the screen.
CNC rig and radiator assembly operating during automated thermal capture

386


OLED display showing completed CNC collection before image conversion

387


Full system view during the automated CNC scan and thermal image workflow

388


Completed CNC collection setup with the dashboard ready to save the image

389

⚠️🔊♨️🖼️ Then, XIAO ESP32C6 makes an HTTP GET request to the web dashboard in order to obtain all thermal imaging buffers registered on the Particle Cloud via the Particle Cloud API. ⚠️🔊♨️🖼️ As discussed in the previous steps, the web dashboard produces a precise thermal image (192 x 192) from the obtained buffers and saves the generated image on the server by running a Python script. ⚠️🔊♨️🖼️ After producing an accurate thermal image with the passed thermal imaging buffers successfully, the web application updates the system log on the MariaDB database accordingly. ⚠️🔊♨️🖼️ Finally, the web application updates its home (index) page automatically to showcase the latest system log entries. In addition to displaying the sample images and the collection dates, the web application lets the user download image samples individually on the home page.
Thermal inspection dashboard entry showing a generated sample image

390

⚠️🔊♨️🖼️ If the user activates the second menu option provided by Photon 2, Inspect: ⚠️🔊♨️🖼️ The device turns the RGB LED to yellow. ⚠️🔊♨️🖼️ The device draws each individual data point (color-based indicator) of the registered buffers on the ST7735 TFT display to show an accurate preview (snapshot) thermal image. ⚠️🔊♨️🖼️ If the registered thermal buffers do not meet the requirements to produce a thermal image, show the blank preview image to notify the user. ⚠️🔊♨️🖼️ Also, the device lets the user clear all registered thermal scan buffers and set their status indicators as blank by pressing the control button OK. Then, it also removes the latest preview thermal image by displaying the blank one.
Inspect screen with the generated thermal preview ready for review

391


Thermal preview on the TFT display beside the operating CNC rig

392


Full HVAC device running the thermal inspection workflow with lights and dashboard

393

After producing thermal images manifesting stable and malfunctioning water-based HVAC system operations, I managed to construct a valid thermal image data set stored on the web application.
Animation of the CNC router collecting four thermal buffers and generating a sample image

394


Complete HVAC rig collecting a thermal image sample with the CNC camera and dashboard active

395


Dashboard thermal sample collection view 1 with generated image entries and download controls

396


Dashboard thermal sample collection view 2 with generated image entries and download controls

397


Dashboard thermal sample collection view 3 with generated image entries and download controls

398


Dashboard thermal sample collection view 4 with generated image entries and download controls

399

Step 9: Building a neural network model (Audio MFE) w/ Edge Impulse Enterprise

As discussed earlier, while collecting audio samples to construct a valid audio data set, I simply differentiated the generated audio samples by the cooling fan failure presence:
  • normal
  • defective
After finalizing my audio data set, I started to work on my Audio MFE neural network model to identify anomalous sound emanating from the cooling fans. Since Edge Impulse provides developer-friendly tools for advanced AI applications and supports almost every development board due to its model deployment options, I decided to utilize Edge Impulse Enterprise to build my Audio MFE neural network model. Also, Edge Impulse Enterprise incorporates state-of-the-art machine learning algorithms and scales them for edge devices such as XIAO ESP32C6. For sound-based abnormality detection, Edge Impulse provides the required tools for inspecting audio samples, slicing them into smaller windows, and modifying windows to extract features from the supported audio file formats, such as WAV and MP4. Even though the Audio MFE processing block extracts time and frequency features from a signal, it employs a non-linear scale in the frequency domain, called Mel-scale. In that regard, the Audio MFE block extracts more features in the lower frequencies and fewer features in the high frequencies, thus it performs exceptionally well for non-voice recognition use cases. Plausibly, Edge Impulse Enterprise allows building predictive models with enhanced machine learning algorithms optimized in size and precision and deploying the trained model as an Arduino library. Therefore, I was able to build an accurate Audio MFE neural network model to identify anomalous sound originating from the cooling fans and run the optimized model on XIAO ESP32C6 without any additional requirements. You can inspect my Audio MFE neural network model on Edge Impulse as a public project.

Step 9.1: Uploading and processing samples

After splitting my audio data set into training and testing samples, I uploaded them to my project on Edge Impulse Enterprise. :hash: First of all, to utilize the incorporated tools for advanced AI applications, sign up for Edge Impulse Enterprise. :hash: Then, create a new project under your organization.
Edge Impulse project dashboard for the audio-based HVAC fault diagnosis model

400

:hash: Navigate to the Data acquisition page and click the Upload data icon.
Data acquisition page with the upload data button selected

401

:hash: Choose the data category (training or testing) and select WAV audio files. :hash: Utilize the Enter Label section to label the passed audio samples automatically with the same class in the file names. :hash: Then, click the Upload data button to upload the labeled audio samples.
Upload data dialog configured for labeled WAV audio samples

402


Upload queue showing normal fan audio files ready for import

403


Upload queue showing defective fan audio files ready for import

404


Data acquisition table with imported normal audio samples

405


Data acquisition table with imported defective audio samples

406


Audio sample detail page with waveform preview and label metadata

407


Training and testing split showing labeled fan sound recordings

408


Data acquisition filter focused on defective fan audio samples

409


Data acquisition filter focused on normal fan audio samples

410


Project data summary after uploading all audio samples

411

Step 9.2: Training the model on sound-based anomalous behavior

After uploading and labeling my training and testing samples successfully, I designed an impulse and trained the model to detect anomalous sound originating from the cooling fans of the water-based HVAC system. An impulse is a custom machine learning model in Edge Impulse. I created my impulse by employing the Audio (MFE) processing block and the Classification learning block. The Audio MFE processing block extracts time and frequency features from a signal and simplifies the generated features for non-voice recognition by using a non-linear scale, Mel-scale. The Classification learning block represents a Keras neural network model. This learning block lets the user change the model settings, architecture, and layers. :hash: Go to the Create impulse page and leave Window size and Window increase parameters as default. In this case, I did not need to slice the passed audio samples since all of them have roughly one-second duration.
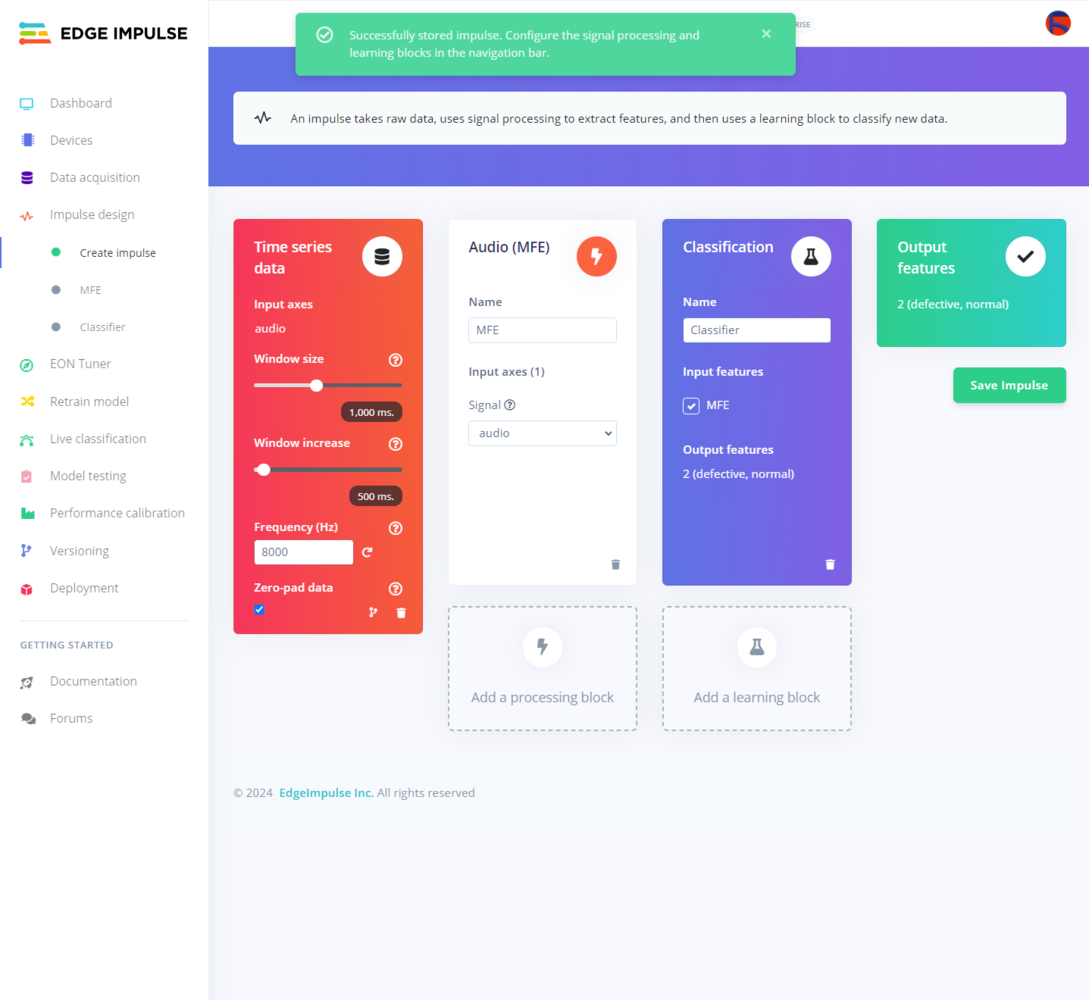
Create impulse page with Audio MFE and Classification blocks for fan sound detection

412

:hash: Before generating features for the Audio MFE model, go to the MFE page to configure the block settings if necessary. :hash: Since the MFE block transforms a generated window into a table of data where each row represents a range of frequencies and each column represents a span of time, you can configure block parameters to adjust the frequency amplitude to change the MFE’s output, the spectrogram. :hash: After inspecting the generated MFE parameters, I decided to utilize the default settings since my audio samples are simple and do not require precise tuning. :hash: Click Save parameters to save the calculated MFE parameters.
MFE processing block page with default audio feature parameters

413


MFE parameter panel showing frequency and frame settings for the audio model

414


Save parameters output for the configured Audio MFE block

415


MFE page confirming parameters before feature generation

416

:hash: After saving parameters, click Generate features to apply the MFE signal processing block to training samples.
Generate features page for the training audio samples

417


Feature explorer with generated MFE features for normal and defective sounds

418

:hash: Finally, navigate to the Classifier page and click Start training.
Classifier page with neural network settings ready for training

419


Classifier training output showing model progress and metrics

420

According to my prolonged experiments, I modified the neural network settings and architecture to achieve reliable accuracy and validity: 📌 Neural network settings:
  • Number of training cycles ➡ 100
  • Learning rate ➡ 0.010
  • Validation set size ➡ 10
After generating features and training my Audio MFE model, Edge Impulse evaluated the precision score (accuracy) as 100%. Since I configured this neural network model to conform to the cooling fans of my simplified HVAC system, the precision score (accuracy) is approximately 100%. Thus, I highly recommend retraining the model before running inferences to detect anomalous sound emanating from different HVAC system components.
Classifier results page reporting 100 percent accuracy for the fan sound model

421


Confusion matrix for the trained Audio MFE normal and defective classes

422

Step 9.3: Evaluating the model accuracy and deploying the model

After building and training my Audio MFE neural network model, I tested its accuracy and validity by utilizing testing samples. The evaluated accuracy of the model is 100%. :hash: To validate the trained model, go to the Model testing page and click Classify all.
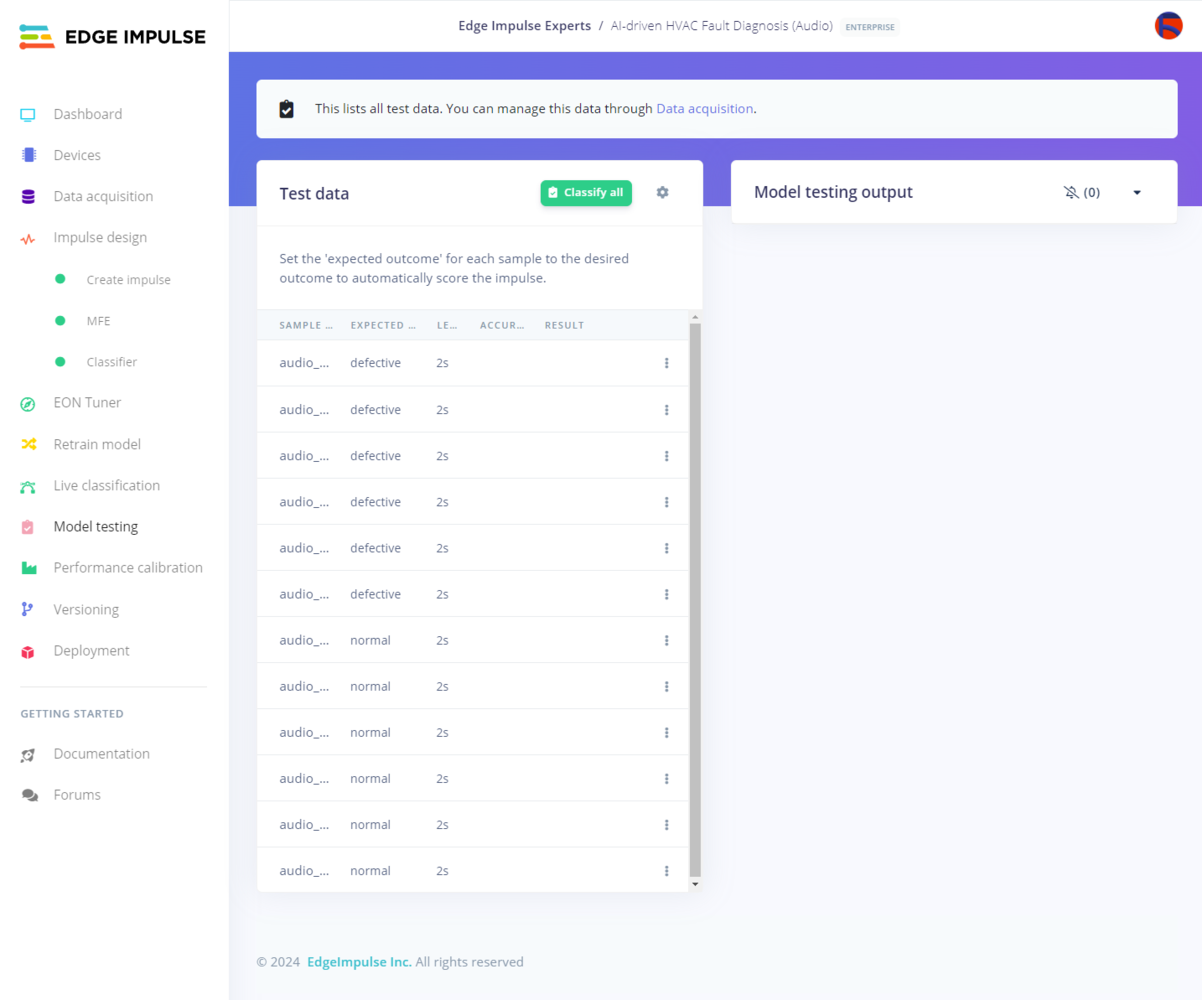
Model testing page ready to classify all held-out fan sound samples

423


Model testing results table with all audio samples classified correctly

424


Audio sample classification detail showing predicted fan sound class and confidence

425

After validating my neural network model, I deployed it as a fully optimized and customizable Arduino library. :hash: To deploy the validated model as an Arduino library, navigate to the Deployment page and search for Arduino library. :hash: Then, choose the Quantized (int8) optimization option to get the best performance possible while running the deployed model. :hash: Finally, click Build to download the model as an Arduino library.
Deployment page search results with Arduino library selected

426


Arduino library deployment settings using quantized int8 optimization

427


Build output for downloading the optimized Audio MFE Arduino library

428

Step 10: Building a visual anomaly detection model (FOMO-AD) w/ Edge Impulse Enterprise

As discussed earlier, while producing thermal image samples to construct a valid image data set, I utilized the default classes to label the generated samples, required by Edge Impulse to enable the F1 score calculation:
  • no anomaly
  • anomaly
After finalizing my thermal image data set, I started to work on my visual anomaly detection model to diagnose ensuing thermal cooling malfunctions after applying anomalous sound detection to the water-based HVAC system. Since Edge Impulse provides developer-friendly tools for advanced AI applications and supports almost every development board due to its model deployment options, I decided to utilize Edge Impulse Enterprise to build my visual anomaly detection model. Also, Edge Impulse Enterprise incorporates elaborate model architectures for advanced computer vision applications and optimizes the state-of-the-art vision models for edge devices and single-board computers such as LattePanda Mu. Since analyzing cooling anomalies based on thermal images of HVAC system components is a complicated task, I decided to employ an advanced and precise machine learning algorithm based on the GMM anomaly detection algorithm enriched with the optimized features of the Edge Impulse FOMO model. Thus, supported by Edge Impulse Enterprise, FOMO-AD is an exceptional algorithm for detecting unanticipated defects by applying unsupervised learning techniques. Although the FOMO-AD visual anomaly detection model is based on the FOMO algorithm, the FOMO-AD models behave significantly differently than FOMO models. By definition, the FOMO-AD models train only on normal (stable) image samples. Thus, handling unseen data or anomalies is not a challenge since the algorithm does not rely on the existence of training data demonstrating all possible anomalies. However, in this regard, the model accuracy is not calculated during training, and Edge Impulse requires predefined labels (anomaly and no anomaly) to estimate the precision (F1) score by running the model testing process. Plausibly, Edge Impulse Enterprise allows building advanced computer vision models optimized in size and accuracy efficiently and deploying the trained model as a supported firmware (Linux x86_64) for LattePanda Mu. Therefore, I was able to build an accurate visual anomaly detection model to diagnose thermal cooling malfunctions based on thermal images and run the optimized model on LattePanda Mu without any additional requirements. You can inspect my FOMO-AD visual anomaly detection model on Edge Impulse as a public project.

Step 10.1: Uploading images (samples) to Edge Impulse and assigning anomaly classes

After splitting my thermal image data set into training (stable) and testing (thermal malfunction) samples, I uploaded them to my project on Edge Impulse Enterprise. :hash: First of all, to utilize the incorporated tools for advanced AI applications, sign up for Edge Impulse Enterprise. :hash: Then, create a new project under your organization.
Edge Impulse project dashboard for the thermal FOMO-AD HVAC diagnosis model

429

:hash: To be able to label image samples manually on Edge Impulse for FOMO-AD visual anomaly detection models, go to Dashboard ➡ Project info ➡ Labeling method and select One label per data item.
Project info page with one-label-per-data-item labeling selected

430

:hash: Navigate to the Data acquisition page and click the Upload data icon.
Data acquisition page with the upload data action for thermal images

431

:hash: Distinguish image samples as training and testing samples depending on the presence of anomaly (malfunction). :hash: Choose the data category (training or testing) and select the associated image files. :hash: Utilize the Enter Label section to label the passed image samples automatically with the required class: no anomaly for training and anomaly for testing. :hash: Then, click the Upload data button to upload the labeled image samples.
Upload data dialog configured for no anomaly thermal image samples

432


Upload queue showing stable thermal images ready for training import

433


Upload data dialog configured for anomaly thermal image samples

434


Upload queue showing malfunction thermal images ready for testing import

435


Data acquisition table with uploaded no anomaly thermal samples

436


Data acquisition table with uploaded anomaly thermal samples

437


Thermal image sample detail page with label and preview

438


Project data summary after uploading thermal training and testing images

439

Step 10.2: Training the FOMO-AD model on the thermal images showcasing stable heat transfer

After uploading and labeling my training and testing samples with the default classes successfully, I designed an impulse and trained the model to diagnose ensuing thermal cooling malfunctions after applying anomalous sound detection to the water-based HVAC system. An impulse is a custom machine learning model in Edge Impulse. I created my impulse by employing the Image processing block and the FOMO-AD (Images) learning block. The Image processing block optionally turns the input image format to grayscale or RGB and generates a features array from the passed raw image. The FOMO-AD (Images) learning block represents a machine learning algorithm that identifies anomalies based on the trained normal (stable) images by applying a Gaussian Mixture Model. In this case, I configured the input image format as RGB since distinguishing thermal cooling malfunctions based on thermal images highly relies on color differences. As stated by Edge Impulse, they empirically obtained the best anomaly detection results by applying 96x96 ImageNet weights regardless of the intended raw image input resolution. Thus, I utilized the same resolution for my visual anomaly detection model. :hash: Go to the Create impulse page and set image width and height parameters to 96. Then, select the resize mode parameter as Fit shortest axis so as to scale (resize) given training and testing image samples. :hash: Select the Image processing block.
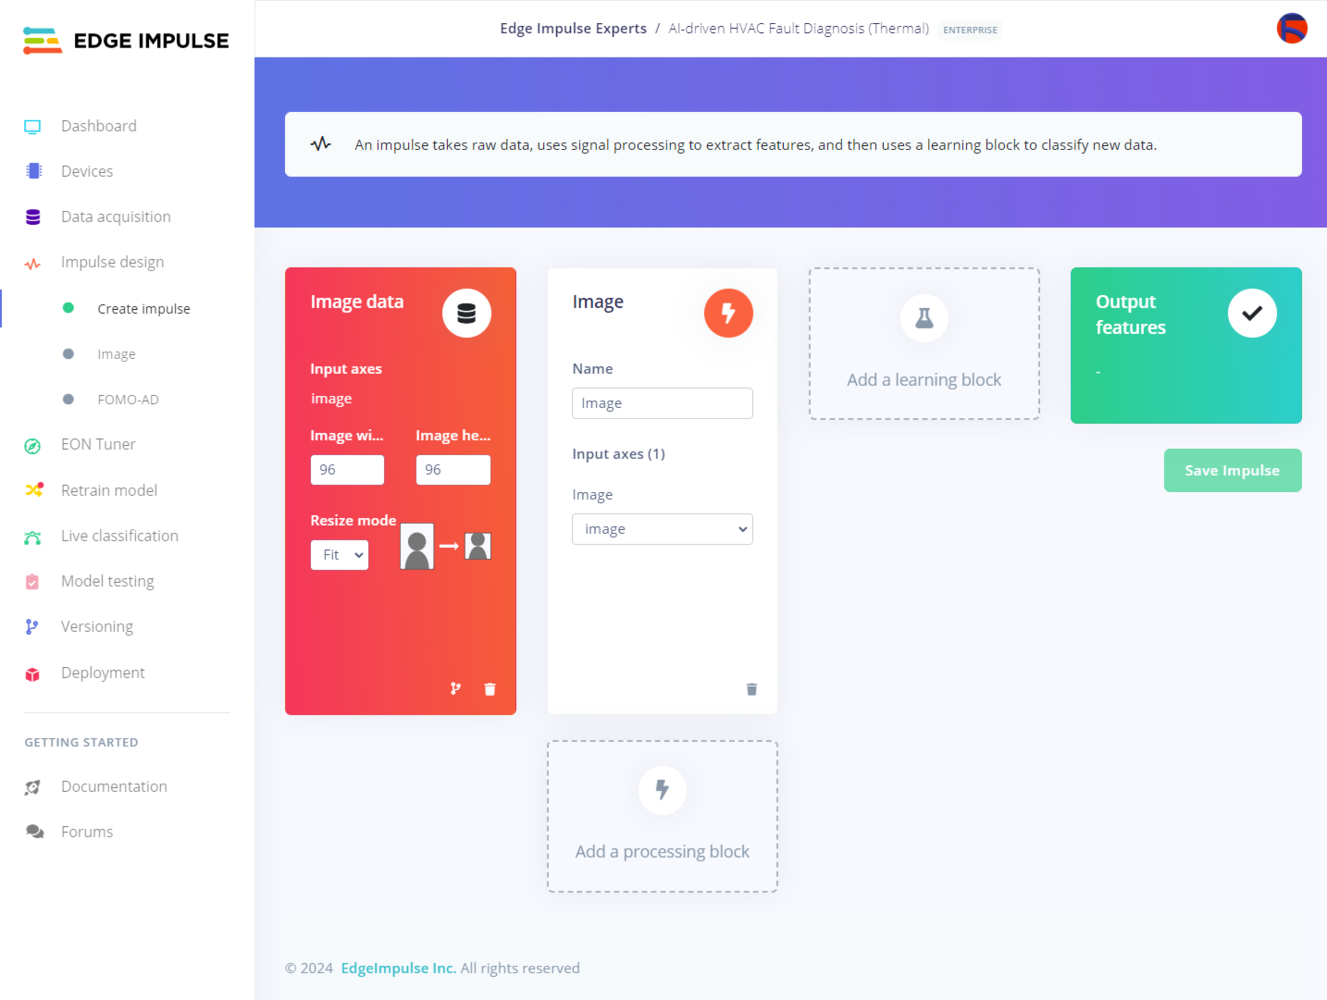
Create impulse page with image dimensions set for 96 by 96 thermal samples

440

:hash: Then, to choose the visual anomaly detection algorithm, click Add a learning block and select the FOMO-AD (Images) learning block. Finally, click Save Impulse.
Learning block selector with FOMO-AD Images chosen for visual anomaly detection

441


Saved impulse containing the Image processing block and FOMO-AD learning block

442

:hash: Before generating features for the visual anomaly detection model, go to the Image page and set the Color depth parameter as RGB. Then, click Save parameters.
Image processing block page with RGB color depth selected

443

:hash: After saving parameters, click Generate features to apply the Image processing block to training image samples.
Generate features page for stable thermal training images

444


Feature explorer with generated image features for no anomaly samples

445

:hash: After generating features successfully, navigate to the FOMO-AD page and click Start training.
FOMO-AD training page with the start training button ready

446

:hash: According to my prolonged experiments, I modified the neural network settings and architecture to achieve reliable accuracy and validity: 📌 Neural network settings:
  • Capacity ➡ High
📌 Neural network architecture:
  • MobileNetV2 0.35
The FOMO-AD learning block has one adjustable parameter, capacity. Higher capacity means a higher number of Gaussian components, increasing the model adaptability considering the original distribution. As discussed earlier, by definition, Edge Impulse does not evaluate the precision score (accuracy) during training.
FOMO-AD training configuration using high capacity and MobileNetV2 0.35

447


FOMO-AD training results page after learning normal thermal patterns

448

Step 10.3: Evaluating the model accuracy and deploying the model

After building and training my FOMO-AD visual anomaly detection model, I tested its accuracy and validity by utilizing testing samples. In addition to validating the model during testing, Edge Impulse evaluates the F1 precision score (accuracy) and provides per region anomalous scoring results for the passed testing images. To tweak the learning block sensitivity, Edge Impulse lets the user change the suggested confidence threshold estimated based on the top anomaly scores in the training dataset. In that regard, the user can adjust the anomaly detection rate according to the expected real-world conditions. After validating my FOMO-AD model, Edge Impulse evaluated the precision score (accuracy) as 100%. Since I configured this visual anomaly detection model to conform to the produced thermal images of my simplified HVAC system components, the precision score (accuracy) is approximately 100%. Thus, I highly recommend constructing a new thermal image data set of different HVAC system components and retraining the model before running inferences to diagnose thermal cooling malfunctions. :hash: To validate the trained model, go to the Model testing page and click Classify all.
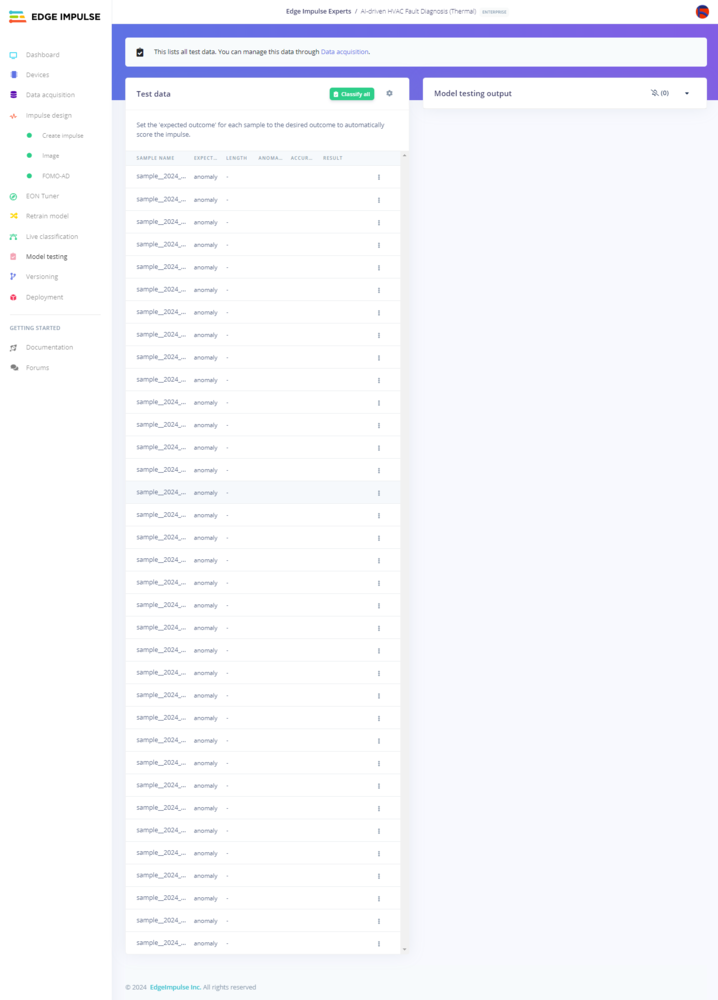
Model testing page ready to classify held-out thermal image samples

449


Model testing results table with F1 score for anomaly and no anomaly images

450

:hash: Then, click the Gear icon and select Set confidence thresholds to tweak the learning block sensitivity to adjust the anomaly detection rate based on the expected real-world conditions. According to my rigorous experiments, I set the confidence threshold as 5.
Confidence threshold menu opened from the model testing gear icon

451


Set confidence thresholds dialog with the anomaly threshold adjusted

452


Model testing page after applying the confidence threshold of 5

453

:hash: After setting the confidence threshold, select a testing image sample and click Show classification to inspect the detected label and the per region anomalous scoring results. Since this classification page provides max and mean anomaly scores, Edge Impulse lets the user compare region anomaly results effortlessly based on the altered confidence thresholds.
Thermal image classification detail with per-region anomaly scores

454


Classification overlay showing anomalous thermal regions on the sample image

455

After setting the confidence threshold, I deployed my visual anomaly detection model as a fully optimized and customizable Linux (x86_64) application (.eim). :hash: To deploy the validated model as a Linux (x86_64) application, navigate to the Deployment page and search for Linux (x86). :hash: Then, choose the Quantized (int8) optimization option to get the best performance possible while running the deployed model. :hash: Finally, click Build to download the model as a Linux (x86_64) application (.eim).
Deployment page search results with Linux x86 selected for the FOMO-AD model

456


Linux deployment settings using quantized int8 optimization for the visual model

457


Build output for downloading the optimized FOMO-AD Linux EIM application

458

Step 11.a: Setting up the neural network model (Audio MFE) on XIAO ESP32C6

Since Edge Impulse optimizes and formats signal processing, configuration, and learning blocks into a single package while deploying models as Arduino libraries, even for complex machine learning algorithms, I was able to import my advanced model effortlessly to run inferences on XIAO ESP32C6. :hash: After downloading the model as an Arduino library in the ZIP file format, go to Sketch ➡ Include Library ➡ Add .ZIP Library… :hash: Then, include the AI-driven_HVAC_Fault_Diagnosis_Audio__inferencing.h file to import the Edge Impulse Audio MFE neural network model.
After importing my model successfully, I programmed XIAO ESP32C6 to run inferences to identify anomalous sound emanating from the cooling fans. However, the Arduino IDE kept throwing a compile error message as shown below during my initial experiments.
:hash: To solve the mentioned compiling error, open the ei_classifier_config.h file and set EI_CLASSIFIER_TFLITE_ENABLE_ESP_NN to 0.
  • \Arduino\libraries\AI-driven_HVAC_Fault_Diagnosis_Audio__inferencing\src\edge-impulse-sdk\classifier\ei_classifier_config.h*
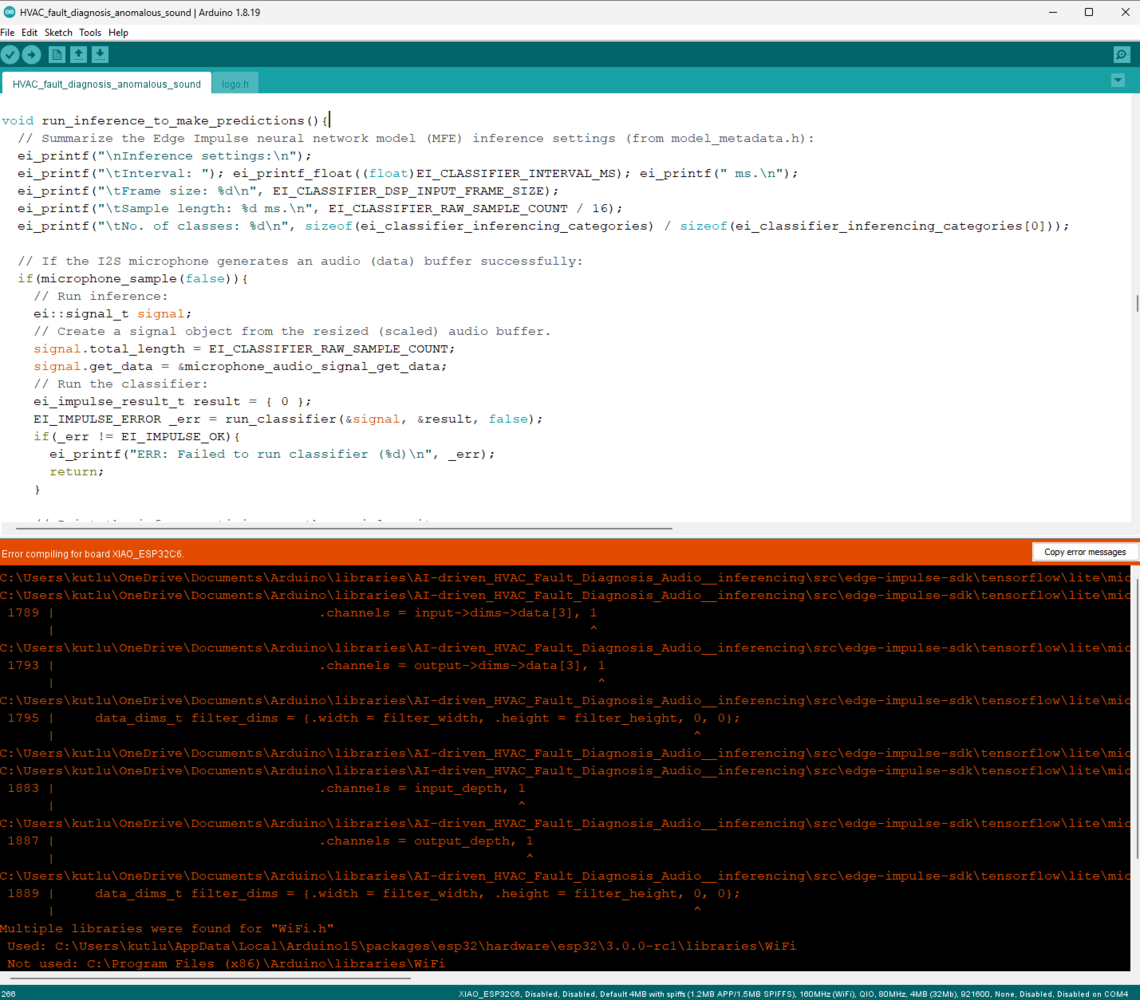
Arduino IDE compile error caused by ESP32 core compatibility with the Edge Impulse library

459


Arduino IDE board package settings changed to resolve the XIAO ESP32C6 compile error

460

As explained in the previous steps, the device performs lots of interconnected features between different development boards and the web application for data collection and running advanced AI models. Thus, the described code snippets show the different aspects of the same code file. Please refer to the code files or the demonstration videos to inspect all interconnected functions in detail. 📁 HVAC_fault_diagnosis_anomalous_sound.ino ⭐ Define the required parameters to run an inference with the Edge Impulse Audio MFE neural network model. ⭐ Define the threshold value for the model outputs (predictions). ⭐ Define the anomalous sound (audio) class names.
⭐ In the run_inference_to_make_predictions function: ⭐ Summarize the Edge Impulse neural network model (Audio MFE) inference settings and print them on the serial monitor. ⭐ If the I2S microphone generates a raw audio (data) buffer successfully: ⭐ Create a signal object from the resized (scaled) raw data buffer, the raw audio buffer. ⭐ Run an inference. ⭐ Print the inference timings on the serial monitor. ⭐ Obtain the prediction results for each label (class). ⭐ Print the model classification results on the serial monitor. ⭐ Get the predicted label (class) explicitly based on the given threshold. ⭐ Print inference anomalies on the serial monitor, if any. ⭐ Release the previously generated raw audio buffer if requested.
⭐ In the microphone_audio_signal_get_data function: ⭐ Convert the given microphone (raw audio) data (buffer) to the out_ptr format required by the Edge Impulse neural network model (Audio MFE).
⭐ If the second option (Faulty Sound) is activated: ⭐ Every five seconds, run an inference with the Edge Impulse Audio MFE neural network model. ⭐ If the given model detects anomalous sound originating from the cooling fans: ⭐ Clear the previously assigned buffer operation status indicators. ⭐ Start the four-step CNC positioning sequence to collect thermal imaging buffers and produce a precise thermal image. :hash: The process is the same for generating a sample thermal image (the third option), except for the passed process type (GET request parameter). This time, the web application utilizes the produced thermal image to run an inference with the Edge Impulse FOMO-AD visual anomaly detection model and generate a model resulting image. ⭐ If the control button D is pressed, redirect the user to the home screen.
Editor view of XIAO ESP32C6 Audio MFE signal preparation code

461


Editor view of XIAO ESP32C6 classifier inference and result handling code

462

Step 11.b: Setting up the visual anomaly detection model (FOMO-AD) on LattePanda Mu

Since Edge Impulse optimizes and formats signal processing, configuration, and learning blocks into a single EIM file while deploying models as a Linux (x86_64) application, even for complex visual anomaly detection models, I was able to import my advanced FOMO-AD model effortlessly to run inferences in Python on LattePanda Mu (x86 Compute Module). :hash: After downloading the generated Linux (x86_64) application to the model folder under the root folder of the web application, make sure to change the file permissions via the Properties tab to be able to execute the model file. As shown earlier, you can also use the terminal (shell) to change file permissions.
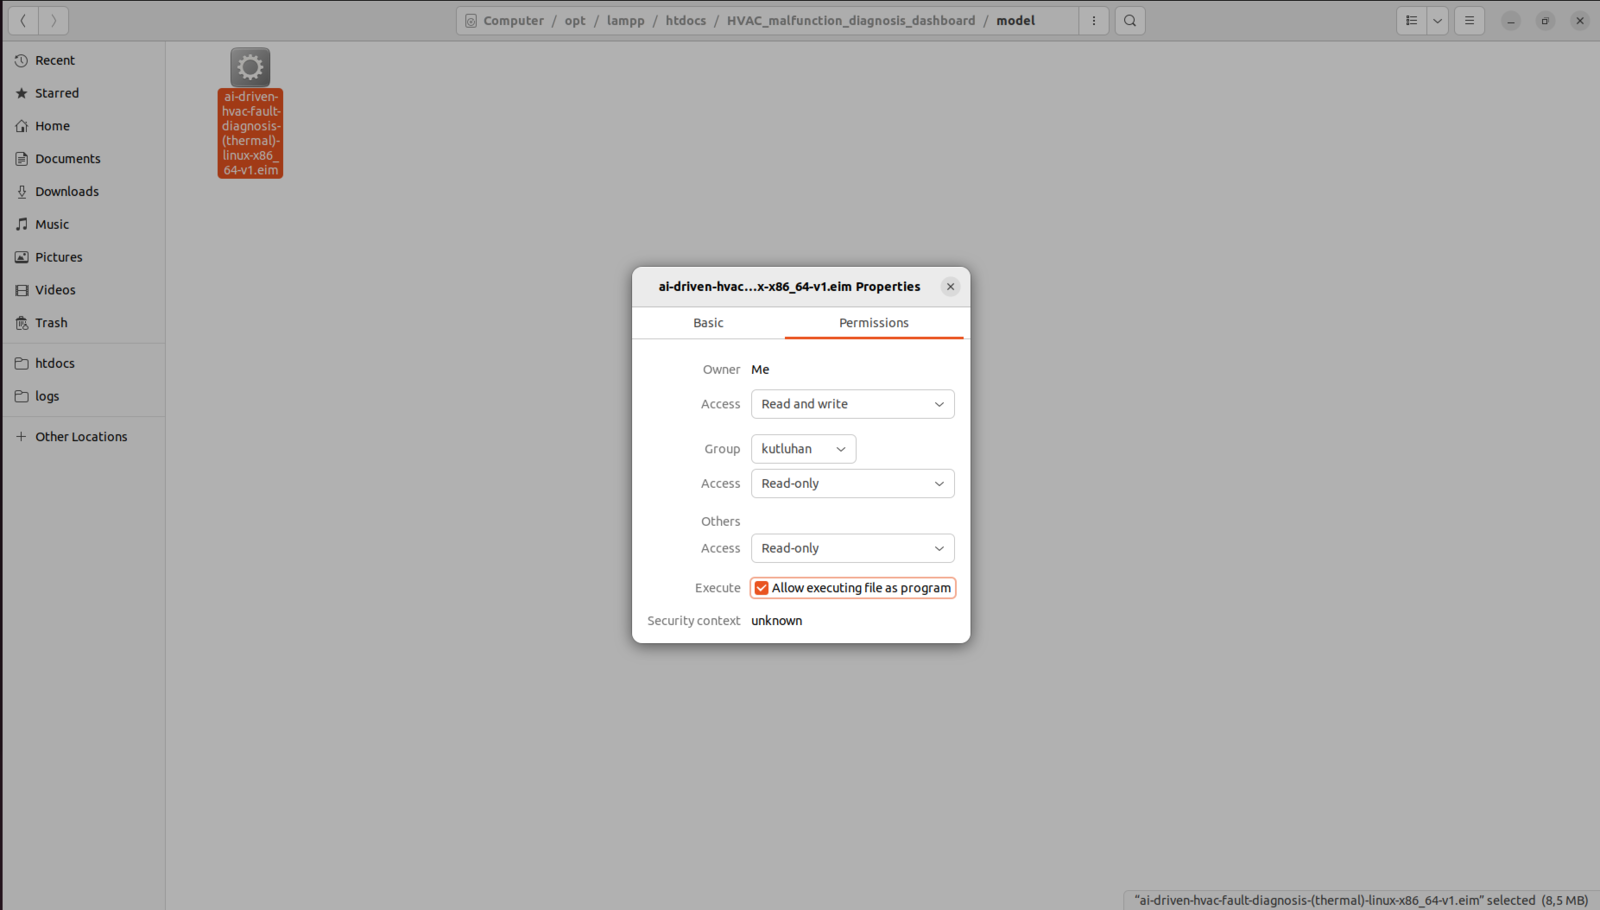
LattePanda Mu terminal setup for placing the downloaded FOMO-AD Linux model file

463

After importing the generated Linux application successfully, I programmed LattePanda Mu to run inferences to diagnose thermal cooling malfunctions of HVAC system components based on specifically produced thermal images. Since I described all of the web application features earlier, including the Python script handling thermal image generation, running the visual anomaly detection model, and modifying the resulting image based on the visual anomaly grid with estimated cell anomaly intensity levels, please refer to Step 5.2 to inspect code snippets.
Editor view of the dashboard PHP class for database and log operations

464

Step 11.c: Running both machine learning models consecutively to detect anomalous sound originating from the cooling fans and diagnose ensuing thermal cooling malfunctions of the HVAC system and informing the user of the cooling status via SMS

⚠️🔊♨️🖼️ If the user activates the second menu option provided by XIAO ESP32C6, Faulty Sound:
XIAO ESP32C6 OLED screen with the Faulty Sound menu option selected

465

⚠️🔊♨️🖼️ XIAO ESP32C6 generates a raw audio buffer via the I2S microphone and runs an inference with the Edge Impulse Audio MFE neural network model every five seconds to identify anomalous sound originating from the HVAC system cooling fans. ⚠️🔊♨️🖼️ Then, the device shows the detected audio class and its associated icon on the SSD1306 OLED display.
OLED display showing the normal fan sound class after Audio MFE inference

466


OLED display showing the defective fan sound class after Audio MFE inference

467

⚠️🔊♨️🖼️ If the Audio MFE detects anomalous sound, XIAO ESP32C6 initiates the four-step CNC positioning sequence to collect thermal imaging buffers and produce a precise thermal image via the web application. ⚠️🔊♨️🖼️ Except for the passed process type (detection) while making an HTTP GET request to the web application, the process is exactly the same for producing a thermal image sample as explained in Step 8.d.
OLED status screen starting CNC thermal buffer collection after anomalous sound detection

468


CNC carriage begins scanning the cooling blocks after the faulty sound result

469


OLED display updates the first CNC buffer status during model execution

470


CNC thermal camera head moves to the next scan position over the tubing

471


OLED display showing multiple CNC positions with saved buffer indicators

472


CNC router advances the MLX90641 camera along the aluminum blocks

473


OLED display nearing the end of the four-step CNC scan sequence

474


CNC carriage reaches the far scan point before zeroing

475


OLED display showing all thermal buffers ready for image generation

476


CNC camera head returns toward the home position after scanning

477


OLED display showing image-ready status after the zeroing command

478


Full system view while the dashboard processes model results

479


OLED display showing final Audio MFE detection status on the device

480


XIAO ESP32C6 and CNC rig after completing the audio-triggered thermal inspection

481

⚠️🔊♨️🖼️ After obtaining the thermal scan (imaging) buffers registered on the Particle Cloud, the web application produces a precise thermal image by running the Python script as shown in Step 8.d. ⚠️🔊♨️🖼️ However, instead of saving the produced image as a sample directly, the web application runs an inference with the Edge Impulse FOMO-AD visual anomaly detection model to diagnose consecutive thermal cooling malfunctions of HVAC system components after anomalous sound detection. ⚠️🔊♨️🖼️ Since the FOMO-AD model categorizes a passed image by individual cells (grids) based on the dichotomy between two predefined classes (anomaly and no anomaly), the web application utilizes the mean visual anomaly value to diagnose overall (high-risk) thermal cooling malfunctions based on the given confidence threshold. ⚠️🔊♨️🖼️ If the mean visual anomaly value is smaller than the given threshold, the web application saves the model resulting image directly by adding the prediction date to the file name. normal__2024_06_21_18_08_41.jpg
FOMO-AD result image with a thermal view classified as normal with no highlighted anomaly cells

482

⚠️🔊♨️🖼️ Otherwise, the web application obtains the visual anomaly grid, consisting of individual cells with coordinates, assigned labels, and anomaly scores. ⚠️🔊♨️🖼️ If a cell’s assigned label is anomaly, the web application calculates the cell’s anomaly intensity level (Low (L), Moderate (M), High (H)) in relation to the given threshold. ⚠️🔊♨️🖼️ Then, the web application modifies the resulting image with the cells (rectangles) and their intensity levels, emphasizing the risk of component abnormalities. ⚠️🔊♨️🖼️ After modifying the resulting image, the web application saves it by adding the prediction date to the file name. malfunction__2024_06_21_18_22_19.jpg
FOMO-AD malfunction result with colored grid cells marking thermal anomaly intensity on the cooling blocks

483


Second malfunction result image with anomaly rectangles over the generated thermal cooling scan

484

⚠️🔊♨️🖼️ After generating and saving the model resulting image, the web application updates the system log on the MariaDB database accordingly.
Updated system_log rows after running the audio and thermal models

485


phpMyAdmin table view with saved prediction entries and resulting image filenames

486

⚠️🔊♨️🖼️ Then, the web application updates its home (index) page automatically to showcase the latest system log entries. In addition to displaying the model resulting images, anomalous sound notifications, thermal cooling malfunction status, and prediction dates, the web application lets the user download modified resulting images individually on the home page. ⚠️🔊♨️🖼️ Furthermore, the web dashboard allows the user to change the system log update category to display only the associated system log entries.
  • All
  • Cooling Malfunction Detections
  • Thermal Image Samples
  • Anomalous Sound Samples
Cooling malfunction dashboard with model result images and prediction dates

487


Filtered dashboard log view focused on detected cooling malfunction entries

488

⚠️🔊♨️🖼️ Finally, the web application sends an SMS via Twilio to inform the user of anomalous sound detection and the status of the ensuing thermal cooling malfunctions of HVAC system components.
Phone notification showing the HVAC anomaly alert sent through Twilio SMS

489


Phone notification showing the thermal cooling malfunction status message

490


Phone screen with a final Twilio SMS summarizing model detection results

491

⚠️🔊♨️🖼️ If the user activates the second menu option provided by Photon 2, Inspect: ⚠️🔊♨️🖼️ Similar to the image sample generation, the device draws each individual data point (color-based indicator) of the registered buffers on the ST7735 TFT display to show an accurate preview (snapshot) thermal image.
Photon 2 TFT display showing the generated thermal preview in Inspect mode

492

⚠️🔊♨️🖼️ Also, XIAO ESP32C6 prints progression notifications on the serial monitor for debugging.
Arduino serial monitor printing XIAO ESP32C6 progress messages during model execution

493

While conducting experiments with this HVAC system malfunction detection device, I added an aquarium heater to the water reservoir to artificially increase the temperature of the water circulating in the closed-loop system. In that regard, I was able to simulate and diagnose thermal cooling malfunctions of HVAC system components (aluminum blocks) after identifying anomalous sound originating from the cooling fans.
Animation of the audio and thermal models running consecutively on the completed HVAC rig

494


Water reservoir with heater installed to raise coolant temperature for malfunction simulation

495


Closed-loop tubing carrying heated coolant through the radiator and aluminum blocks

496


Thermal camera inspecting the heated cooling block during malfunction testing

497


Dashboard detection results view 1 with FOMO-AD images, anomaly status, and category filters

498


Dashboard detection results view 2 with FOMO-AD images, anomaly status, and category filters

499


Dashboard detection results view 3 with FOMO-AD images, anomaly status, and category filters

500


Dashboard detection results view 4 with FOMO-AD images, anomaly status, and category filters

501

Further Discussions

By applying advanced AI-powered multi-algorithm detection methods to identify anomalous sound emanating from the cooling fans and diagnose ensuing thermal cooling malfunctions of water-based HVAC system components, we can achieve to: ⚠️🔊♨️🖼️ prevent pernicious cooling aberrations deteriorating heat regulation for industrial facilities, ⚠️🔊♨️🖼️ avert production downtime for demanding industrial processes, ⚠️🔊♨️🖼️ reduce production costs and increase manufacturing efficiency, ⚠️🔊♨️🖼️ obviate excessive energy consumption via real-time (automated) malfunction diagnosis, ⚠️🔊♨️🖼️ extend equipment lifespan by maintaining stable heat transfer, ⚠️🔊♨️🖼️ deter exorbitant overhaul processes due to prolonged negligence, leading to a nosedive in production quality.
Full HVAC monitoring system assembly step 18, joining parts in an exploded view with the completed build in place alongside the radiator, reservoir, CNC rig, and dashboard

502

Project GitHub Repository

As a developer, if you want to inspect or access code files and custom design files effortlessly, you can visit the project’s GitHub repository, providing:
  • Code files
  • Gerber files
  • STL files
  • Custom libraries
  • Edge Impulse machine learning models: Audio MFE and FOMO-AD

References

[^1] What is an Industrial Water-Based Cooling System and How Does it Work?, ChemREADY, https://www.getchemready.com/water-facts/what-is-an-industrial-water-based-cooling-system-and-how-does-it-work/. [^2] Industrial water cooling systems-chillers, Atlas Copco, https://www.atlascopco.com/en-uk/compressors/products/industrial-water-cooling-systems. [^3] Jian Bi, Hua Wang, Enbo Yan, Chuan Wang, Ke Yan, Liangliang Jiang, Bin Yang, AI in HVAC fault detection and diagnosis: A systematic review, Energy Reviews, Volume 3, Issue 2, 2024, https://doi.org/10.1016/j.enrev.2024.100071. [^4] Herbert W. Stanford III, HVAC Water Chillers and Cooling Towers: Fundamentals, Application, and Operation, CRC Press, 2nd edition, March 29, 2017, Page: 16-28, https://www.google.com/books/edition/HVAC_Water_Chillers_and_Cooling_Towers/KDteO_-GaLkC.

Schematics

Kyogre PCB schematic overview for XIAO ESP32C6, Arduino Nano, microphone, OLED, and CNC connections

1


Kyogre PCB board layout with component footprints and Pokémon-inspired outline

2


Kyogre PCB front copper and silkscreen routing for the sound and CNC controller

3


Kyogre PCB back copper routing for the XIAO ESP32C6 and Arduino Nano connections

4


Kyogre PCB 3D render showing headers, buttons, display connector, and logic converter

5


Kyogre PCB fabrication preview with the final board shape and silkscreen

6


Groudon PCB schematic overview for Photon 2, MLX90641 camera, TFT display, and joystick

7


Groudon PCB board layout with thermal camera and cloud communication connections

8


Groudon PCB front copper and silkscreen routing for the thermal subsystem

9


Groudon PCB back copper routing for Photon 2 and peripheral connectors

10


Groudon PCB 3D render showing headers, TFT connector, joystick, and camera port

11


Groudon PCB fabrication preview with the final board shape and red silkscreen

12


Pinout schematic for wiring XIAO ESP32C6 to the microphone, OLED, buttons, and serial interface

13